Laminar
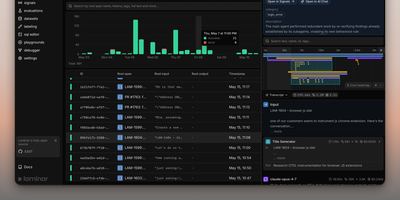
Backed by Y Combinator (S24) and processing traces from thousands of AI agents in production, Laminar is the open-source observability platform that treats agent debugging as a first-class engineering discipline rather than an afterthought. Its OpenTelemetry-native SDK auto-instruments Vercel AI SDK, LangChain, OpenAI, Anthropic, Gemini, Browser Use, Stagehand, Mastra, Pydantic AI, and the OpenAI Agents SDK with a single line of code, capturing every LLM turn, tool call, and sub-agent delegation as nested spans with full input/output data and token costs. The Signals engine lets you describe failures in plain language — "agent is stuck in a loop" or "tool returned empty results" — then reads every trace and alerts via Slack when it detects a match. A built-in debugger records runs and replays them from cache so each iteration takes seconds, designed for Claude Code, Cursor, or Codex to drive the repair loop via the MCP server or CLI. Run code-first evaluations in Python or TypeScript locally or in CI/CD pipelines, build datasets from production traces, and query everything with raw SQL through custom dashboards, the in-app editor, or your coding agent. The Rust backend delivers 20x trace compression, a custom real-time streaming engine, ultra-fast full-text search, and gRPC ingestion, while ClickHouse powers columnar analytics and PostgreSQL stores application state. Running on a dedicated VPS on RepoCloud with guaranteed CPU, RAM, and SSD, full root SSH access, and a browser serial console. Apache 2.0 licensed.

Grafana
The de facto dashboard of observability: Grafana is the open-source frontend that turns the data stores you already run into interactive graphs. It does not store metrics itself; it connects to the data stores you already run and turns their contents into interactive dashboards. Supported sources number over 150 via plugins: Prometheus, Loki, Tempo, InfluxDB, Elasticsearch, MySQL, PostgreSQL, Microsoft SQL Server, AWS CloudWatch, Azure Monitor, Google Cloud Monitoring, and many more. Dashboards are built from a large library of panel types (time series, heatmaps, tables, gauges, logs) with template variables for reusable, parameterized views. Unified alerting evaluates rules against any connected data source, not just Prometheus, and routes notifications to Slack, PagerDuty, email, and other channels with grouping and silencing - unlike Prometheus Alertmanager, a single rule can combine a Loki log pattern, a PostgreSQL query result, and a CloudWatch metric. Dashboards serialize to JSON and data sources configure via provisioning files, so the entire observability setup can live in Git and deploy repeatably across environments. Explore mode adds ad-hoc querying outside dashboards, with split view for correlating a metric spike against the matching log lines, and access control spans organizations, teams, folder permissions, and OAuth, LDAP, and SAML integration. Written in Go and TypeScript, AGPL-licensed. Self-hosting gives you unlimited users, dashboards, and queries at flat hosting cost, without Grafana Cloud's usage-based pricing.
CPA Manager Plus
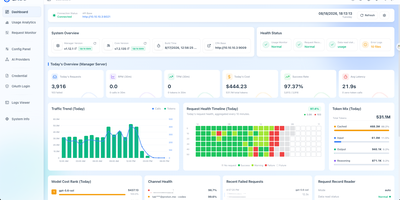
CPA Manager Plus is a self-hosted observability dashboard and management panel that tracks every AI request flowing through your CLI Proxy API gateway, breaking down failures, costs, and account health across providers like OpenAI, Anthropic, xAI, and Codex in one interface. When a request fails, drill into the persistent history to see status codes, affected models, latency, and redacted failure evidence without exposing raw response bodies. The cost analytics engine breaks down token consumption and estimated spend by model, provider, account, API key, project, channel, and time range while tracking input, output, reasoning, cache, and service-tier pricing semantics separately. Model prices sync automatically from models.dev with LiteLLM and OpenRouter fallbacks, and you can add local overrides for aliases or internal models. For teams running Codex or xAI accounts, the health inspector reads quota windows, reset evidence, credential state, and workspace status on a configurable schedule, routing credential failures into an action queue for review rather than letting them silently degrade throughput. Deploy the Lightweight Panel to replace your existing CPA management UI without adding another service, or run Full Mode as a single Docker container that adds the Manager Server with persistent SQLite storage for request history, historical analytics, and automated account inspections. Export or import request history as JSONL for external analysis, and back up the SQLite files alongside your encrypted management keys. Running on a dedicated VPS on RepoCloud with guaranteed CPU, RAM, and SSD, full root SSH access, and a browser serial console. MIT licensed.
QuestDB
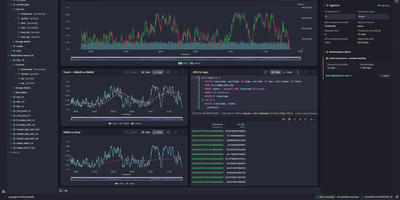
Powering trading floors at firms processing millions of market data events per second and trusted by organizations including Airbus, Yahoo, and Copenhagen Atomics, QuestDB has earned over 17,000 GitHub stars as the time-series database that refuses to make you choose between ingestion speed and query latency. The column-oriented, time-partitioned storage engine processes millions of rows per second on ingest through write-ahead logging with instant durability, while SIMD-accelerated parallel execution returns analytical queries over billions of rows in milliseconds. Time-series SQL extensions add ASOF JOIN for point-in-time lookups across tables with misaligned timestamps, SAMPLE BY for downsampling at arbitrary time intervals, LATEST ON for last-value queries, and WINDOW JOIN for sliding window aggregations — all through standard SQL syntax accessible via the PostgreSQL wire protocol, REST API, or the QuestDB Wire Protocol (QWP) that streams Apache Arrow at 220 million rows per second. Multi-tier storage automatically moves data from the WAL through native columnar format to Parquet files on S3-compatible object storage, keeping hot data fast and cold data portable without manual tiering. The built-in web console provides an interactive SQL editor with syntax highlighting, autocomplete, and charting for quick data exploration. Views, materialized views, and n-dimensional arrays support real-time analytics, while native Parquet export enables direct integration with Python, DuckDB, and AI/ML frameworks. Running on a dedicated VPS on RepoCloud with guaranteed CPU, RAM, and SSD, full root SSH access, and a browser serial console. Apache 2.0 licensed.
Langfuse
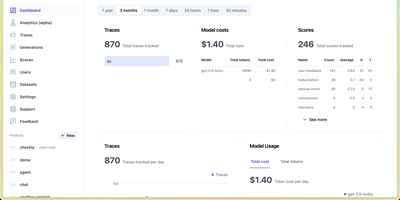
Backed by Y Combinator and trusted by over 2,300 companies processing billions of observations monthly, Langfuse is the most widely adopted open-source platform for building, monitoring, evaluating, and debugging LLM applications. The hierarchical tracing engine captures every LLM call, tool invocation, retrieval step, and agent action as nested spans based on OpenTelemetry, with automatic cost calculation, latency tracking, and token usage attribution across sessions and users. Prompt Management separates prompts from code with versioned artifacts, label-based deployments, one-click rollbacks, and runtime SDK fetching with server-side caching, while linking every generation back to its exact prompt version for attribution analytics. The evaluation system supports LLM-as-a-judge scoring, heuristic code evaluators, user feedback collection, and manual annotation workflows that run automatically on production traces or against curated datasets. The Playground enables interactive prompt testing on real production inputs with side-by-side model comparison across providers. Datasets and Experiments define test cases for systematic benchmarking with comparative result visualization. Native SDKs for Python and TypeScript provide decorator-based instrumentation, while 100+ integrations cover LangChain, LlamaIndex, OpenAI SDK, LiteLLM, Vercel AI SDK, and any OpenTelemetry-instrumented framework. The analytics dashboard surfaces cost breakdowns, quality scores, latency percentiles, and usage trends across models and prompt versions. Running on a dedicated VPS on RepoCloud with guaranteed CPU, RAM, and SSD, full root SSH access, and a browser serial console. MIT licensed.
Beszel
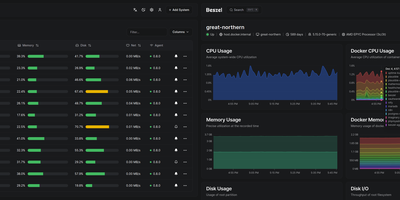
Reaching 24,000 GitHub stars within two years of its first commit in July 2024, Beszel delivers Netdata-grade monitoring dashboards from a single Docker container with no Prometheus stack, no external database, and no complex configuration — just a one-binary hub on PocketBase (SQLite embedded) and a sub-15 MB agent per host that auto-discovers Docker and Podman containers on contact. The agent connects outbound via WebSocket or SSH tunnel, requiring zero open ports on monitored servers and zero manual network configuration. Per-host metrics cover CPU usage, memory with swap and ZFS ARC breakdown, disk I/O across multiple partitions, network throughput, load average, sensor temperatures, battery charge, and GPU utilization with power draw for Nvidia, AMD, and Intel cards — features that competitors lock behind paid tiers. S.M.A.R.T. disk health including eMMC wear indicators and Linux mdraid array status surface hardware degradation before failures occur. Container statistics track CPU, memory, and network history per container with automatic discovery as new containers start. Configurable threshold alerts notify via email, Discord, Telegram, ntfy, Pushover, Gotify, Matrix, Mattermost, Signal, Slack, Microsoft Teams, and Twilio when metrics exceed defined limits. Multi-user accounts with OAuth/OIDC authentication let teams share monitored systems with role-based access, while automatic backups persist data to disk or S3-compatible storage. Running on a dedicated VPS on RepoCloud with guaranteed CPU, RAM, and SSD, full root SSH access, and a browser serial console. MIT licensed.
SigNoz
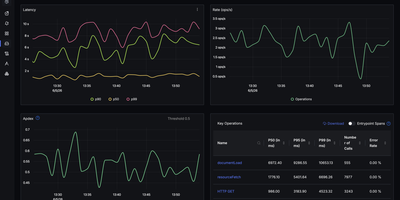
With over 31,000 GitHub stars and native OpenTelemetry support that eliminates vendor lock-in from day one, SigNoz delivers full-stack observability covering metrics, traces, and logs in a single pane of glass without the per-host pricing model of commercial APM platforms. The platform ingests telemetry data through the OpenTelemetry Collector, supporting auto-instrumentation for Java, Python, Node.js, Go, Ruby, PHP, and .NET applications with zero code changes required for basic tracing. ClickHouse serves as the columnar storage backend, providing fast aggregation queries over billions of spans and log lines with configurable retention policies and tiered storage. The distributed tracing view renders flame graphs and Gantt charts showing request flow across microservices with latency breakdowns, error rates, and p99 percentile calculations. Custom dashboards support PromQL and ClickHouse SQL queries with time-series charts, bar graphs, tables, and value widgets. The log management pipeline supports structured and unstructured logs with full-text search, log pipelines for parsing and enrichment, and correlation with traces via trace IDs. Alert rules can be configured on any metric or log query with notification channels including Slack, PagerDuty, OpsGenie, webhooks, and email. The exceptions monitoring module automatically groups and tracks application errors with stack traces, occurrence counts, and first-seen timestamps. Service maps visualize inter-service dependencies with real-time latency and error rate overlays. Running on a dedicated VPS on RepoCloud with guaranteed CPU, RAM, and SSD, full root SSH access, and a browser serial console. MIT licensed with an enterprise edition available.
Sentry
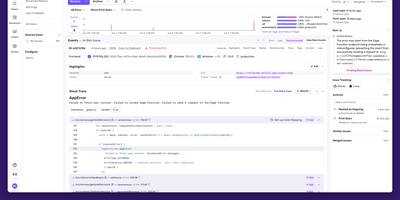
Backed by 44,000 GitHub stars and trusted by over four million developers, Sentry is the debugging platform that captures errors, traces, replays, profiles, and metrics from your applications and connects them all through distributed tracing. The error tracking engine captures full stack traces with source context, breadcrumbs, and automatic demangling for native crashes, while intelligent grouping consolidates duplicate events into actionable issues with regression detection and automatic assignment. Performance monitoring instruments your frameworks automatically, capturing every database query, API call, cache hit, and queue operation as spans within distributed traces that flow across frontend, backend, and mobile boundaries. Session Replay produces video-like recordings of real user sessions showing DOM interactions, network requests, console messages, and errors on a synchronized timeline, with AI-powered summaries that describe what happened without watching the full replay. Continuous profiling captures CPU execution data at the function and line level for Node.js, Python, iOS, and Android, linking slow spans directly to the exact code responsible. Cron monitoring tracks scheduled jobs for failures, missed runs, and duration anomalies. The alerting engine fires notifications through Slack, PagerDuty, Opsgenie, and webhooks on new issues, regressions, error spikes, or when latency and crash-free session rate thresholds are crossed. Self-hosted deployment runs as a Docker Compose stack with PostgreSQL, ClickHouse, Kafka, Redis, and Relay. Running on a dedicated VPS on RepoCloud with guaranteed CPU, RAM, and SSD, full root SSH access, and a browser serial console. FSL licensed.
OpenSearch
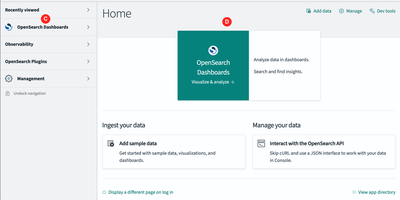
OpenSearch is a search and analytics platforms, powering full-text search, log analytics, observability, and AI-powered vector retrieval at petabyte scale. The distributed engine provides BM25 full-text search alongside k-NN vector search using NMSLIB, Faiss, and Lucene libraries, enabling semantic search, hybrid search combining keyword and vector scoring through normalization processors, neural sparse search, and retrieval-augmented generation workflows with built-in ML Commons for model hosting. OpenSearch Dashboards delivers interactive visualization with Discover for log exploration, custom dashboards, alerting, anomaly detection using Random Cut Forest algorithms, and Security Analytics with detection rules mapped to MITRE ATT&CK. Native Prometheus integration with full PromQL support unifies metrics alongside logs and traces in a single observability interface, while Data Prepper handles telemetry ingestion from OpenTelemetry collectors, Fluent Bit, and Logstash-compatible pipelines. SQL and Piped Processing Language queries with a visual PPL builder enable analysts to query data without learning the native DSL. Index State Management automates index lifecycle with rollover, shrink, and delete policies, while cross-cluster replication and searchable snapshots on S3-compatible storage provide disaster recovery. Scoped API keys, field-level security, document-level security, and audit logging deliver enterprise-grade access control. Docker Compose deploys multi-node clusters alongside the Kubernetes operator for orchestrated production environments. Running on a dedicated VPS on RepoCloud with guaranteed CPU, RAM, and SSD, full root SSH access, and a browser serial console. Apache 2.0 licensed.
Radar
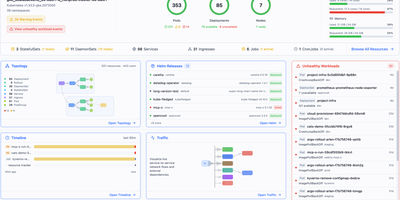
Radar is an open-source Kubernetes management dashboard and Model Context Protocol server that gives engineering teams complete cluster visibility, automated issue diagnosis, and GitOps controls through a unified web interface. Operators explore live interactive cluster topology maps rendered with automated layout engines, grouping workloads by namespace or custom application labels to trace network communication pathways. The unified event timeline retains Kubernetes activity and state change diffs well beyond default one-hour limits, allowing site reliability engineers to diagnose historical CrashLoopBackOff states and investigate failed deployment rollouts. Teams manage Helm releases by inspecting deployed values, comparing manifest revisions side by side, and initiating rollbacks or upgrades with a single click. The built-in GitOps workspace correlates ArgoCD and Flux applications, surfacing synchronization health, field-level configuration drifts, and automated remediation suggestions. Developers inspect container image filesystems directly from pod detail panels without pulling images locally or establishing interactive terminal sessions, browsing permissions and downloading specific files. Native Model Context Protocol endpoints expose cluster telemetry and operational tools to artificial intelligence coding assistants, enabling external agents to diagnose failing pods and inspect access controls securely. Running on a dedicated VPS on RepoCloud with guaranteed CPU, RAM, and SSD, full root SSH access, and a browser serial console. Apache 2.0 licensed.
Coroot
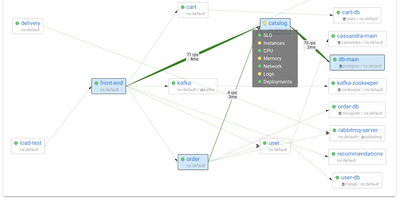
Coroot uses eBPF to capture metrics, distributed traces, logs, and continuous CPU profiles directly from the Linux kernel, delivering full observability without any application code changes, SDKs, or sidecars. From the first minute of deployment, an automatically generated service map covers every microservice, database, message queue, and external dependency with request rate, error rate, and latency measurements. When a service breaches its SLO, AI-powered inspections analyze telemetry across all dimensions to pinpoint the root cause and send a single consolidated alert with findings, replacing the flood of fragmented notifications typical of traditional monitoring. Deployment tracking automatically discovers Kubernetes rollouts and compares each release against the previous one to detect performance regressions, resource spikes, and cost impacts without CI/CD pipeline integration. Continuous profiling captures CPU flame graphs down to the line of code with negligible overhead. Integrated cost monitoring tracks cloud spending across AWS, GCP, and Azure, attributing expenses to individual services and deployments. Coroot supports Prometheus, OpenTelemetry, and ClickHouse as data sources and works identically on Kubernetes clusters, virtual machines, and bare-metal hosts. 7,700+ GitHub stars. Apache-2.0 licensed.
Wazuh
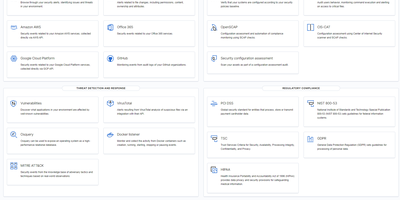
Protecting over 10,000 organizations worldwide with 16,000+ GitHub stars, Wazuh delivers enterprise-grade security operations through a fully open-source platform with zero feature gating. The unified XDR and SIEM solution deploys lightweight agents across Linux, Windows, macOS, Solaris, AIX, and HP-UX endpoints that stream security telemetry to a centralized cluster built on OpenSearch for indexing and the Wazuh Dashboard for visualization and management. Core capabilities include real-time file integrity monitoring with inotify-based detection and who-data attribution, automated vulnerability assessment that correlates software inventories against continuously updated CVE databases, Security Configuration Assessment against CIS benchmarks, rootkit detection, and log data analysis with a rules engine supporting over 3,000 built-in detection rules mapped to MITRE ATT&CK tactics and techniques. Wazuh monitors cloud infrastructure at the API level with native modules for AWS, Azure, and Google Cloud, detects container anomalies through Docker engine integration, and ingests third-party telemetry via syslog and REST APIs from sources like VirusTotal, TheHive, YARA, Suricata, and PagerDuty. Pre-built compliance dashboards and reports cover PCI DSS, HIPAA, NIST 800-53, GDPR, and TSC frameworks. Active response capabilities automatically trigger countermeasures including firewall rule updates, account lockouts, and endpoint isolation when threats are detected. The platform scales horizontally with multi-node clustering for high availability. Running on a dedicated VPS on RepoCloud with guaranteed CPU, RAM, and SSD, full root SSH access, and a browser serial console. GPL-2.0 licensed.
Quickwit
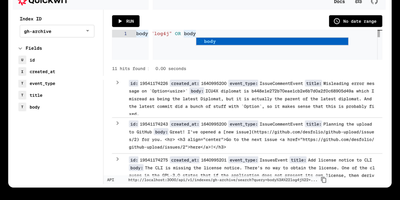
With over 11,000 GitHub stars and now backed by Datadog while remaining fully Apache 2.0 licensed, Quickwit delivers the search performance Elasticsearch users expect at a fraction of the infrastructure cost by moving the index to object storage instead of expensive local SSDs. The Rust-based engine, built on the Tantivy search library with SIMD-accelerated vectorized processing and zero garbage collection overhead, achieves sub-second search latency directly against Amazon S3, Azure Blob Storage, Google Cloud Storage, or any S3-compatible backend like MinIO and Ceph. The Elasticsearch-compatible REST API covers ingest, search, query DSL, and aggregations, enabling existing log shippers including Vector, Fluent Bit, and Syslog to migrate without rewriting configurations. Native OpenTelemetry Protocol endpoints accept logs and traces via gRPC, while Jaeger integration provides a drop-in distributed tracing backend. Ingestion from Apache Kafka, Amazon Kinesis, and Apache Pulsar supports streaming pipelines with multi-index partitioning, and the schemaless JSON indexing mode eliminates the need for upfront schema definitions. Stateless searchers and indexers scale horizontally on Kubernetes or bare metal, with a control plane that distributes indexing tasks and a janitor that manages retention policies and GDPR-compliant deletions. The built-in web UI displays search results and cluster state, while the official Grafana data source enables log exploration dashboards. Running on a dedicated VPS on RepoCloud with guaranteed CPU, RAM, and SSD, full root SSH access, and a browser serial console. Apache 2.0 licensed.
GoAccess
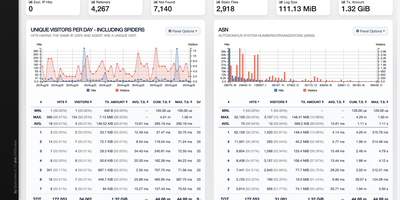
GoAccess processes millions of web log entries in seconds and renders the results as interactive dashboards that update every 200 milliseconds in the terminal or every second via WebSocket-connected HTML reports. Written entirely in C with only ncurses as a dependency, it achieves exceptional performance even on resource-constrained servers, reducing memory usage by approximately 20% and parsing time by 35% in recent releases through optimized in-memory hash tables with on-disk persistence support. The analyzer parses virtually every web log format out of the box (Apache Combined and Common, Nginx, Amazon CloudFront, Amazon S3, AWS Elastic Load Balancing, Google Cloud Storage, Squid, W3C IIS, Caddy JSON, and Traefik) while supporting fully custom log format strings for non-standard configurations. The self-contained HTML dashboard displays 15+ interactive panels covering unique visitors, requested files, static files, 404 errors, referring sites, search keyphrases, geographic location with city-level GeoIP resolution, operating systems, browsers, HTTP status codes, time distribution, and virtual host metrics. WebSocket authentication via JWT provides secure remote access, and incremental log processing ensures data continuity across daemon restarts. Docker deployment requires a single command with volume-mapped access logs. Over 20,800 stars with active development since 2010. Running on a dedicated VPS on RepoCloud with guaranteed CPU, RAM, and SSD, full root SSH access, and a browser serial console. MIT licensed.
Zabbix
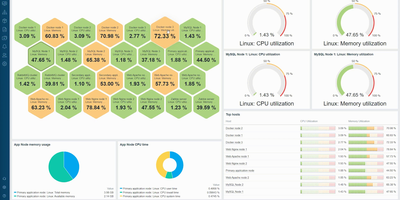
Monitoring everything from network switches to Kubernetes clusters since 2001 with over 6,200 GitHub stars and deployments exceeding 100,000 devices per installation, Zabbix has established itself as one of the most mature and feature-rich open-source monitoring platforms available, trusted by organizations including Dell, Salesforce, ICANN, and T-Mobile. The platform collects metrics from virtually any source using Zabbix Agent written in C, Zabbix Agent 2 written in Go with native plugin support, SNMP v1/v2c/v3 polling and trapping, IPMI for hardware health, JMX for Java applications, SSH and Telnet checks, HTTP/HTTPS polling, and ODBC database queries. Version 7.0 LTS introduced synthetic browser monitoring that executes user-defined JavaScript via WebDriver to simulate multi-step user interactions on websites, proxy load balancing with automatic host redistribution across proxy groups for high availability, in-memory proxy data buffering delivering up to 100x performance improvement, native multi-factor authentication with TOTP and Duo support, and just-in-time user provisioning from SAML and LDAP. Low-level discovery automatically detects file systems, network interfaces, SNMP OIDs, VMware resources, and Kubernetes pods, creating monitoring items and triggers dynamically. The alerting engine correlates events with configurable escalation chains, sending notifications through Slack, Microsoft Teams, PagerDuty, Jira, email, and SMS with customizable message templates. Over 1,000 official templates provide instant monitoring for Linux, Windows, VMware, AWS, Azure, Docker, PostgreSQL, MySQL, Apache, Nginx, and hundreds more. Running on a dedicated VPS on RepoCloud with guaranteed CPU, RAM, and SSD, full root SSH access, and a browser serial console. AGPL-3.0 licensed.
OpenObserve
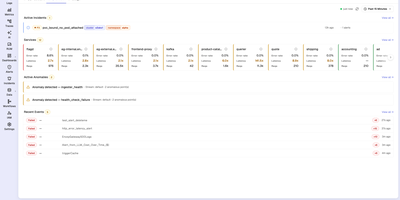
With 20,500+ GitHub stars and over 6,000 organizations running it in production — including a Fortune 100 company ingesting more than 4 PB per day — OpenObserve is the open-source observability platform that replaces your entire Datadog, Splunk, or ELK stack with a single Rust binary deploying in under two minutes. Apache Parquet columnar storage with zstd compression on S3-compatible object storage delivers 140x lower storage costs than Elasticsearch while providing better query performance on a quarter of the hardware. Ingest logs, metrics, and distributed traces via native OpenTelemetry OTLP endpoints with no vendor lock-in. Query logs and traces with standard SQL, metrics with SQL or PromQL — no proprietary query language to learn. The built-in dashboard builder offers 19 chart types including time-series graphs, heatmaps, gauges, tables, and top-K lists with drag-and-drop layout combining data from all signal types. Data pipelines process, enrich, redact, or normalize ingestion streams using Vector Remap Language for real-time transformations including PII redaction and logs-to-metrics conversion. Real User Monitoring captures frontend performance with session replay. The Service Catalog provides topology-based trace analysis with side-panel drill-downs into database queries and error details. Alerting supports real-time and scheduled rules with SQL and PromQL conditions. Native multi-tenancy isolates organizations and streams with complete data separation. Running on a dedicated VPS on RepoCloud with guaranteed CPU, RAM, and SSD, full root SSH access, and a browser serial console. AGPLv3 licensed.
LogTide
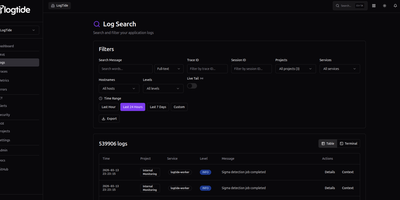
Every production incident starts the same way: someone asks "what do the logs say?" and the answer takes 45 minutes to find. LogTide collapses that search into seconds with a unified observability platform that indexes logs, traces, and metrics into a single queryable interface, backed by your choice of TimescaleDB, ClickHouse, or MongoDB. The log search interface supports full-text queries across millions of entries with filters for trace ID, session ID, project, service, hostname, and severity level, plus a live tail mode that streams new log lines as they arrive. Distributed traces render as waterfall timelines showing every span, its duration, and cross-service dependencies, while correlated logs for each trace are one click away. The metrics explorer visualizes OTLP gauge and counter data from your applications with system CPU, memory, disk, and network panels that update in near real-time. Where LogTide diverges from standard observability is its built-in SIEM engine: Sigma-compatible detection rules scan incoming logs for security threats like SQL injection, privilege escalation, lateral movement, and C2 communication, surfacing findings on a dedicated security dashboard with severity distribution, detection timelines, and affected service breakdowns. Alerting pushes notifications to Email, Slack, or Discord webhooks when thresholds trip or security rules fire. Native SDKs for Node.js, Python, Go, PHP, Kotlin, and Ruby ship logs with retry logic and circuit breakers, and the platform accepts OpenTelemetry data natively. Running on a dedicated VPS on RepoCloud with guaranteed CPU, RAM, and SSD, full root SSH access, and a browser serial console. AGPL-3.0 licensed.
HyperDX
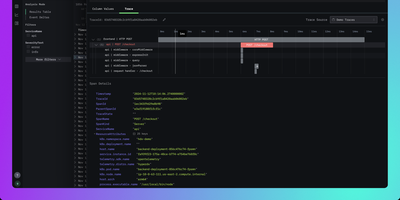
HyperDX correlates logs, metrics, traces, session replays, and errors in a single interface so engineers can resolve production incidents in minutes instead of hours. Nearly 10,000 GitHub stars reflect its role as the integrated UI layer for the ClickStack blueprint endorsed by ClickHouse. The platform connects to any ClickHouse cluster as its storage backend, working with existing table structures without requiring data migration or proprietary ingestion formats. An intuitive Lucene-like search syntax supports full-text queries and property filtering like level:err or service.name:api without needing SQL, while native JSON string querying and event delta analysis surface anomalies in high-cardinality datasets. One-click cross-signal correlation lets you jump from a log line to its distributed trace, from a slow span to associated logs, or from a frontend session replay to the backend errors it triggered. The OpenTelemetry Collector accepts telemetry via OTLP on gRPC port 4317 and HTTP port 4318, supporting automatic instrumentation for Node.js, Python, Java, Go, Ruby, and browser applications. APM tracks HTTP request latency, database query duration, and external service calls with trace waterfall visualizations. Configurable alerts trigger via webhook, Slack, PagerDuty, or email when thresholds are breached. Deploys via Docker Compose with ClickHouse, MongoDB, Redis, and the OpenTelemetry Collector. Running on a dedicated VPS on RepoCloud with guaranteed CPU, RAM, and SSD, full root SSH access, and a browser serial console. MIT licensed.