Stars
Forks
Watchers
Developer links
Peekaping
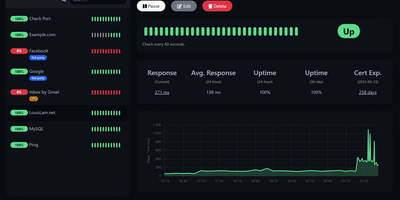
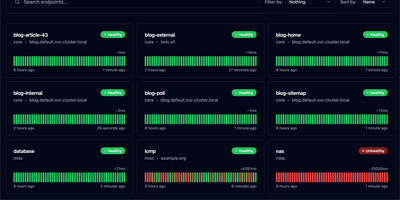
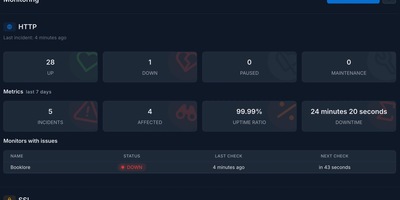
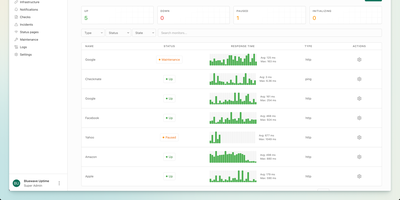
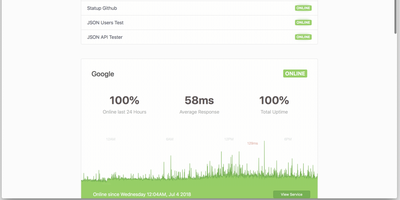
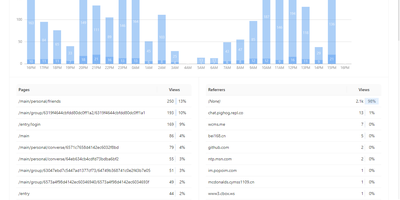
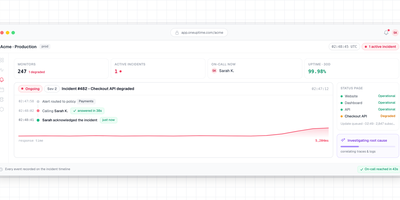
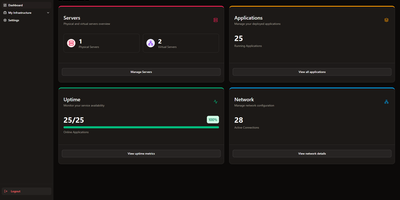
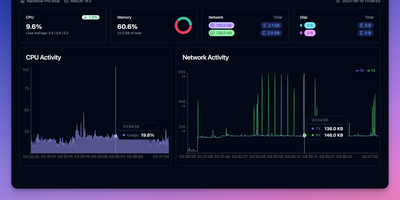
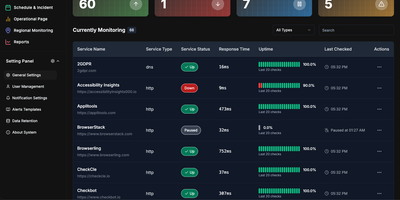
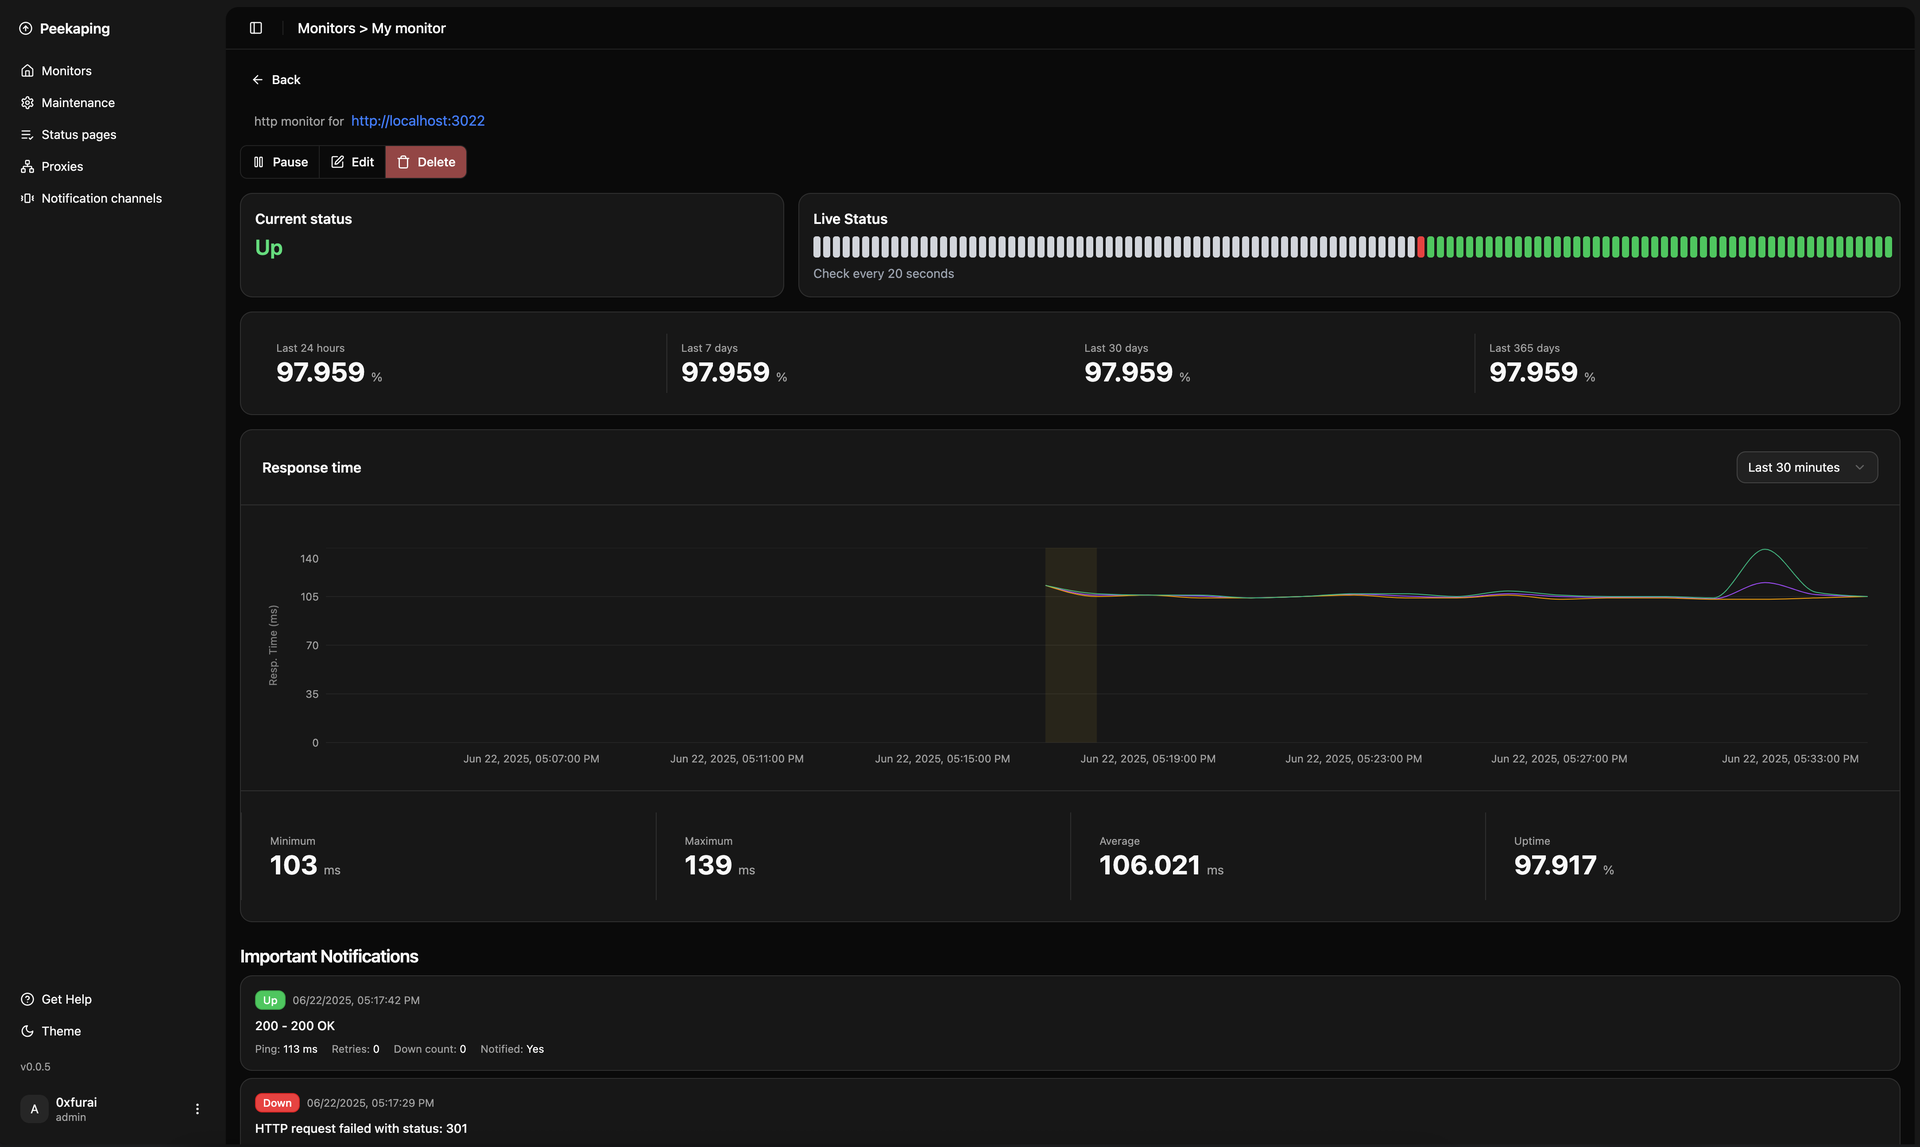
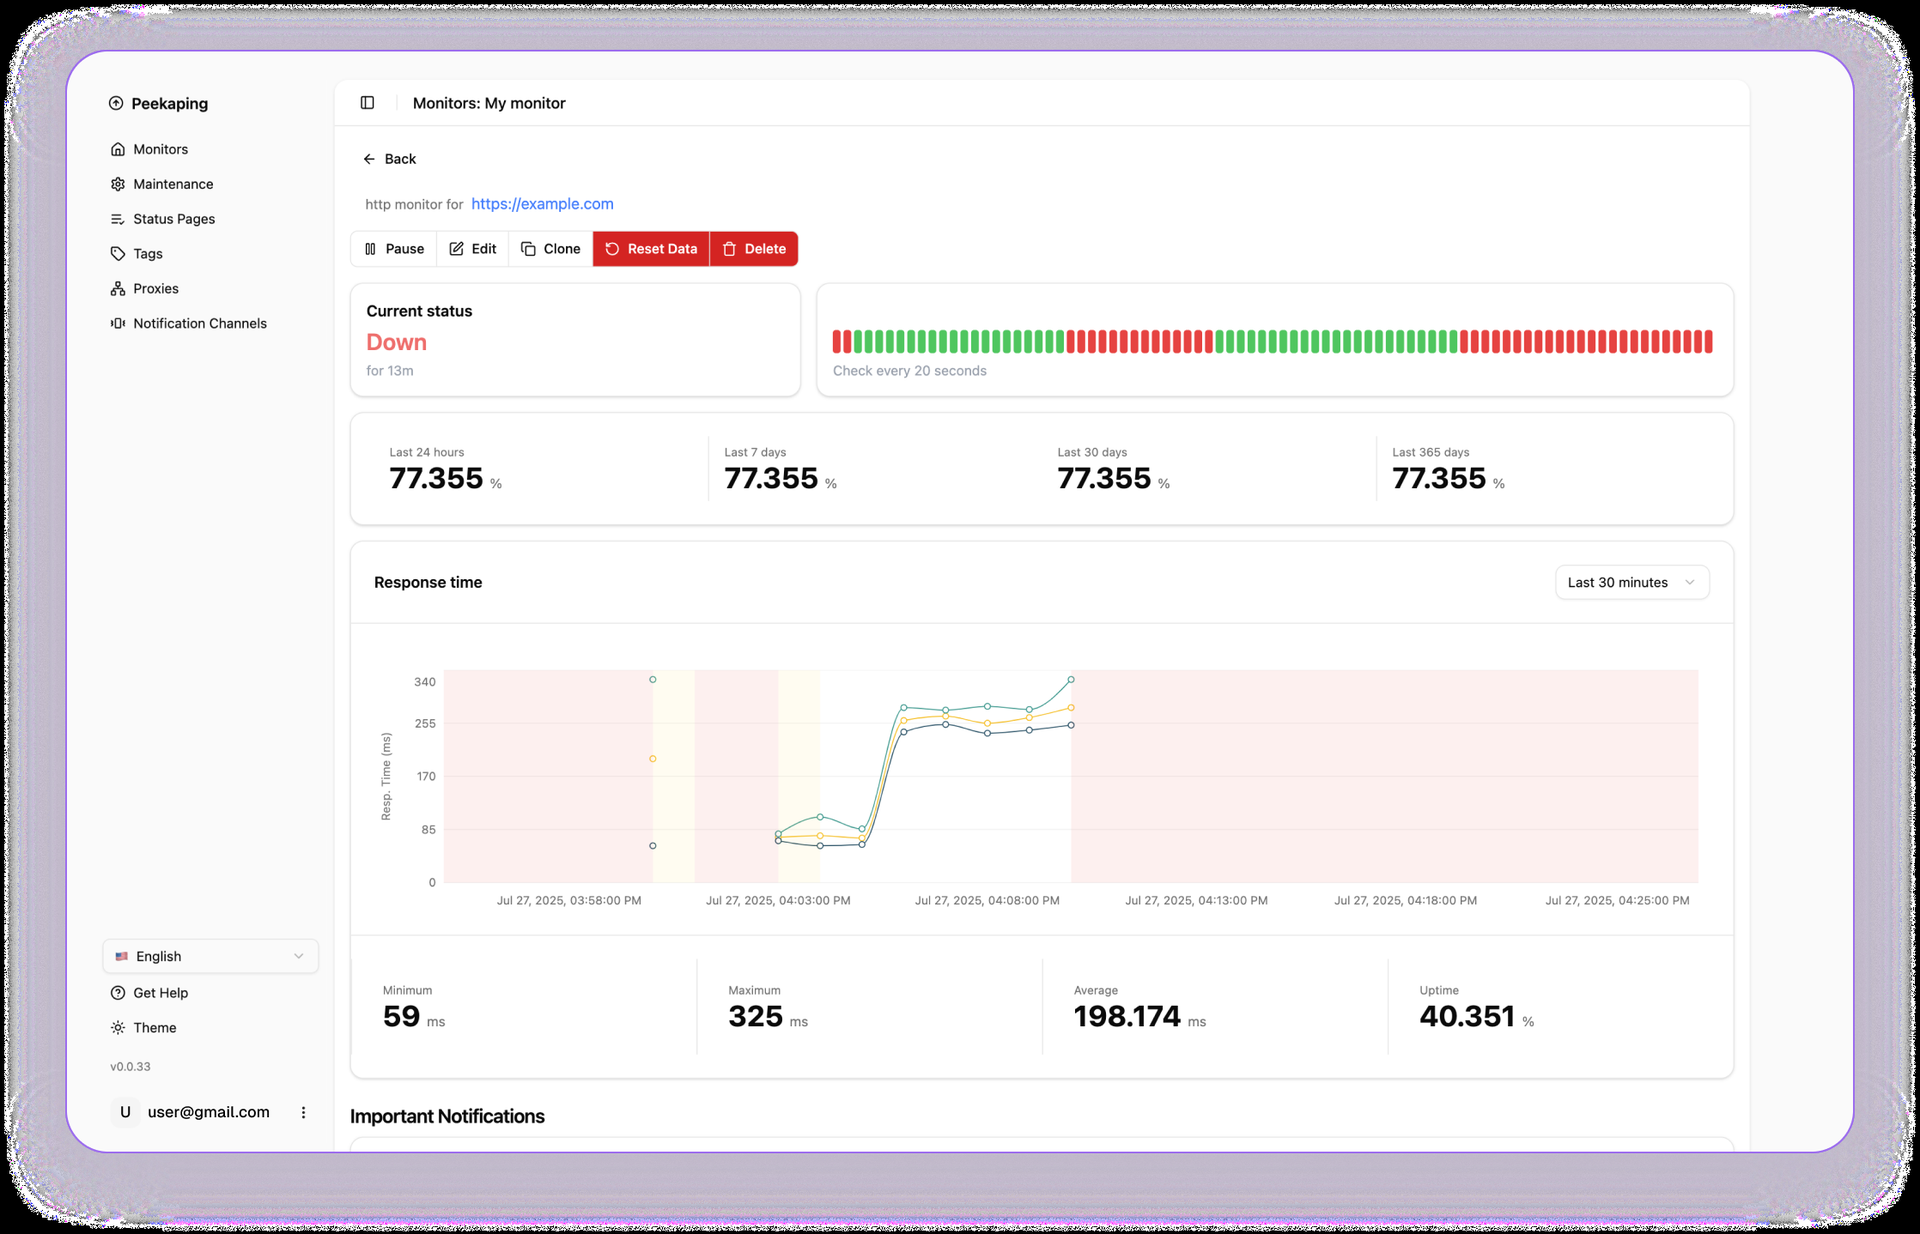
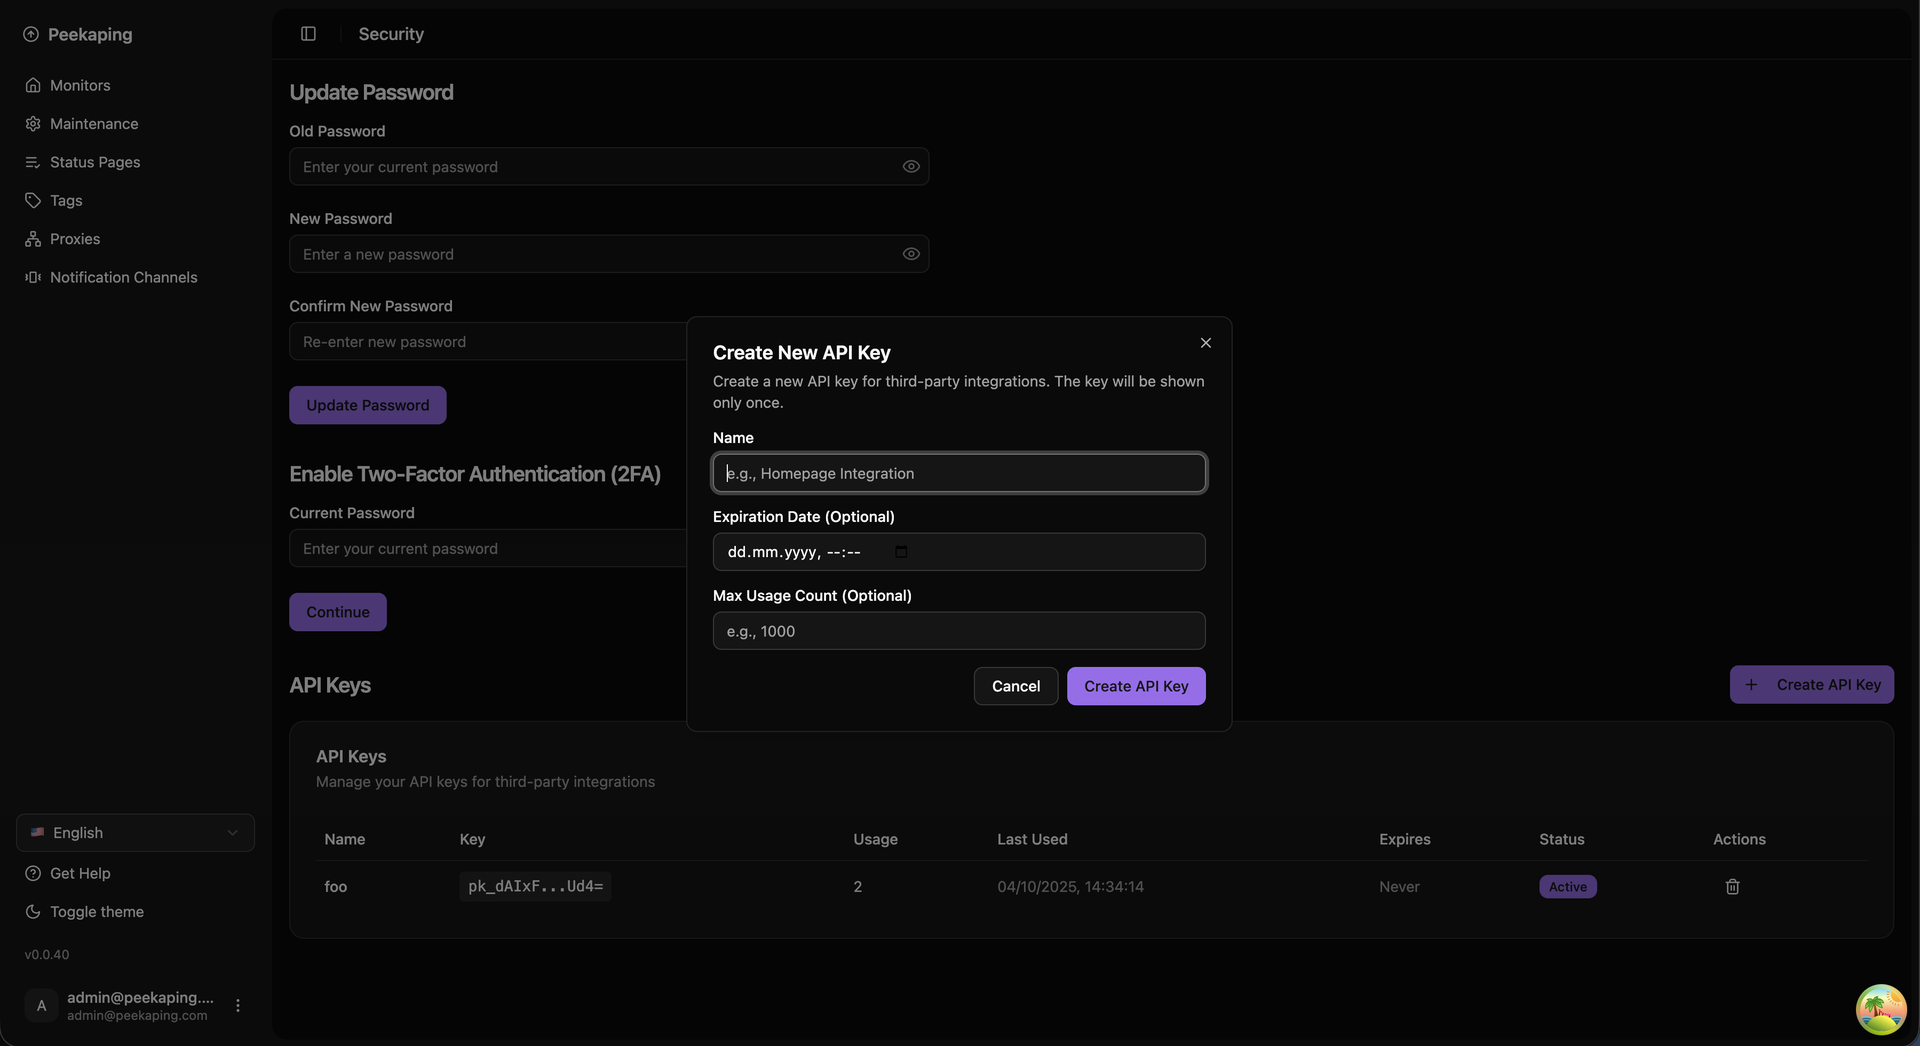
Keep users ahead of outages by consolidating infrastructure monitoring into Peekaping, a unified uptime monitoring and incident communication platform that alerts engineering teams to network and application failures before customers experience disruptions. Users can configure automated synthetic checks across HTTP endpoints, database engines, message queues, and container runtimes to verify response latency, payload integrity, and SSL certificate expiration. When performance thresholds degrade or connections drop, the platform broadcasts structured incident notices across twenty-two notification channels including Slack, Discord, Telegram, PagerDuty, and custom webhooks. Visual dashboards display live heartbeat timelines, historical latency percentiles, and rolling availability scores for each monitored endpoint. System administrators can assemble custom public status pages with custom domains, branded color schemes, and component grouping to inform external stakeholders during planned maintenance or unforeseen service degradations. Teams can schedule recurring maintenance windows to pause alert notifications during routine deployments and generate API tokens to automate monitor creation directly from CI/CD deployment pipelines. Running on a dedicated VPS on RepoCloud with guaranteed CPU, RAM, and SSD, full root SSH access, and a browser serial console. MIT licensed.
Benefits
- Comprehensive Multi-Protocol Synthetic Probing
- Execute continuous availability checks across HTTP, ICMP ping, DNS records, gRPC endpoints, and Docker containers with sub-second frequency to identify network degradations and service interruptions before end users report them.
- Automated Multi-Channel Incident Alerting
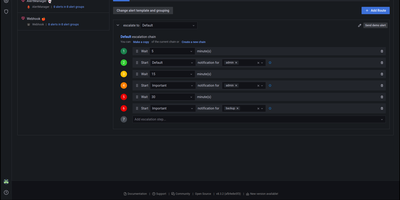
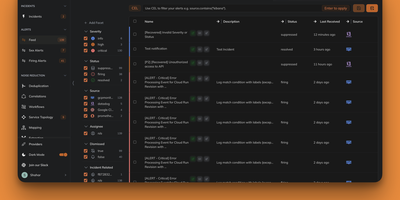
- Dispatch urgent downtime alerts across twenty-two notification integrations including Slack, Telegram, PagerDuty, and webhooks with configurable retry thresholds and alert deduplication to prevent notification fatigue during transient network blips.
- Branded Public Status Pages
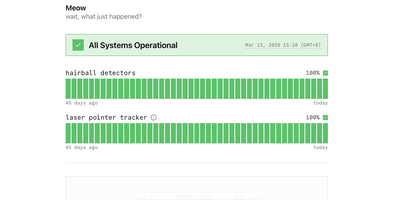
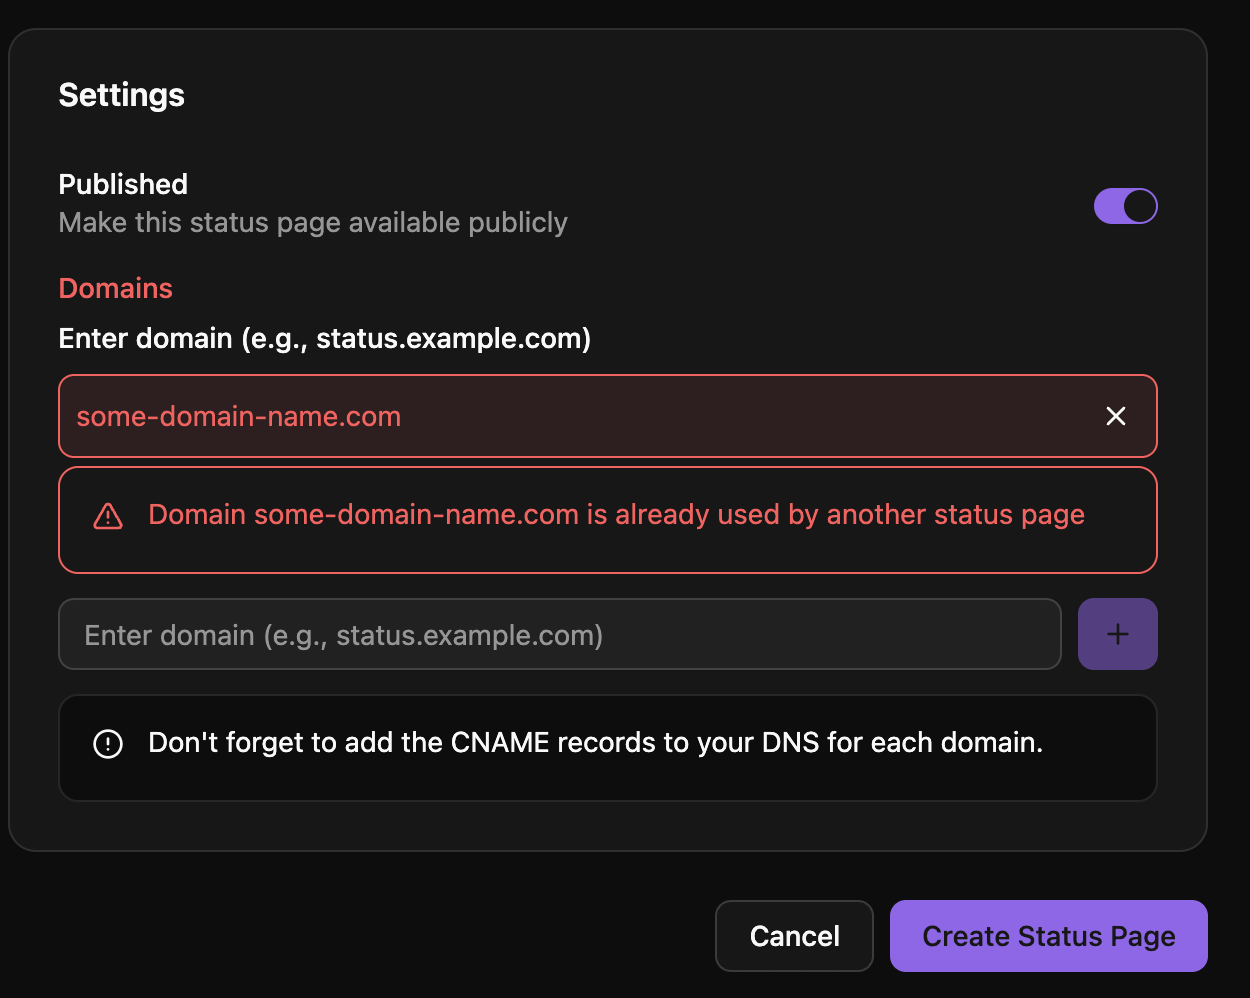
- Publish real-time service health dashboards featuring custom domain routing, maintenance announcements, and uptime percentages to maintain transparent communication with external users and internal stakeholders during outages.
- Granular TLS Certificate Tracking
- Continuously inspect SSL and TLS certificates across all monitored endpoints to track expiration dates, certificate authority chains, and renewal failures well before security warnings reach production web traffic.
Features
- Synthetic Protocol Probing
- Probe target endpoints using HTTP method validation, TCP port handshakes, ICMP packet exchanges, DNS resolution queries, and gRPC remote procedure calls.
- Database and Queue Checks
- Execute native connectivity probes against PostgreSQL, MySQL, Redis, MongoDB, RabbitMQ, Kafka, and MQTT brokers to verify backend operational health.
- Push Heartbeat Webhooks
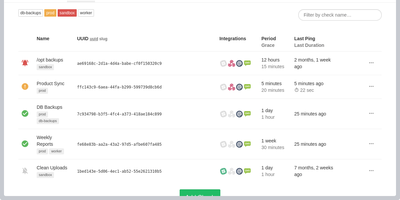
- Receive periodic inbound heartbeat signals from external cron jobs, backup daemons, and background workers with automated alerting upon missed reporting intervals.
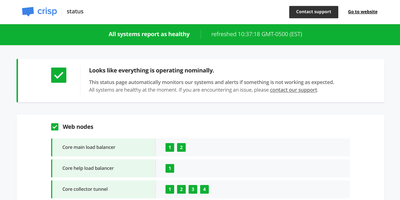
- Public Status Portals
- Deploy branded public or private status dashboards with custom styling, service component groups, maintenance schedules, and incident postmortem timelines.
- Incident Notification Integrations
- Broadcast instant status updates across Slack, Discord, Telegram, Matrix, PagerDuty, Opsgenie, Gotify, Ntfy, and custom webhooks with HMAC-SHA256 signatures.
- Role-Based Access and 2FA
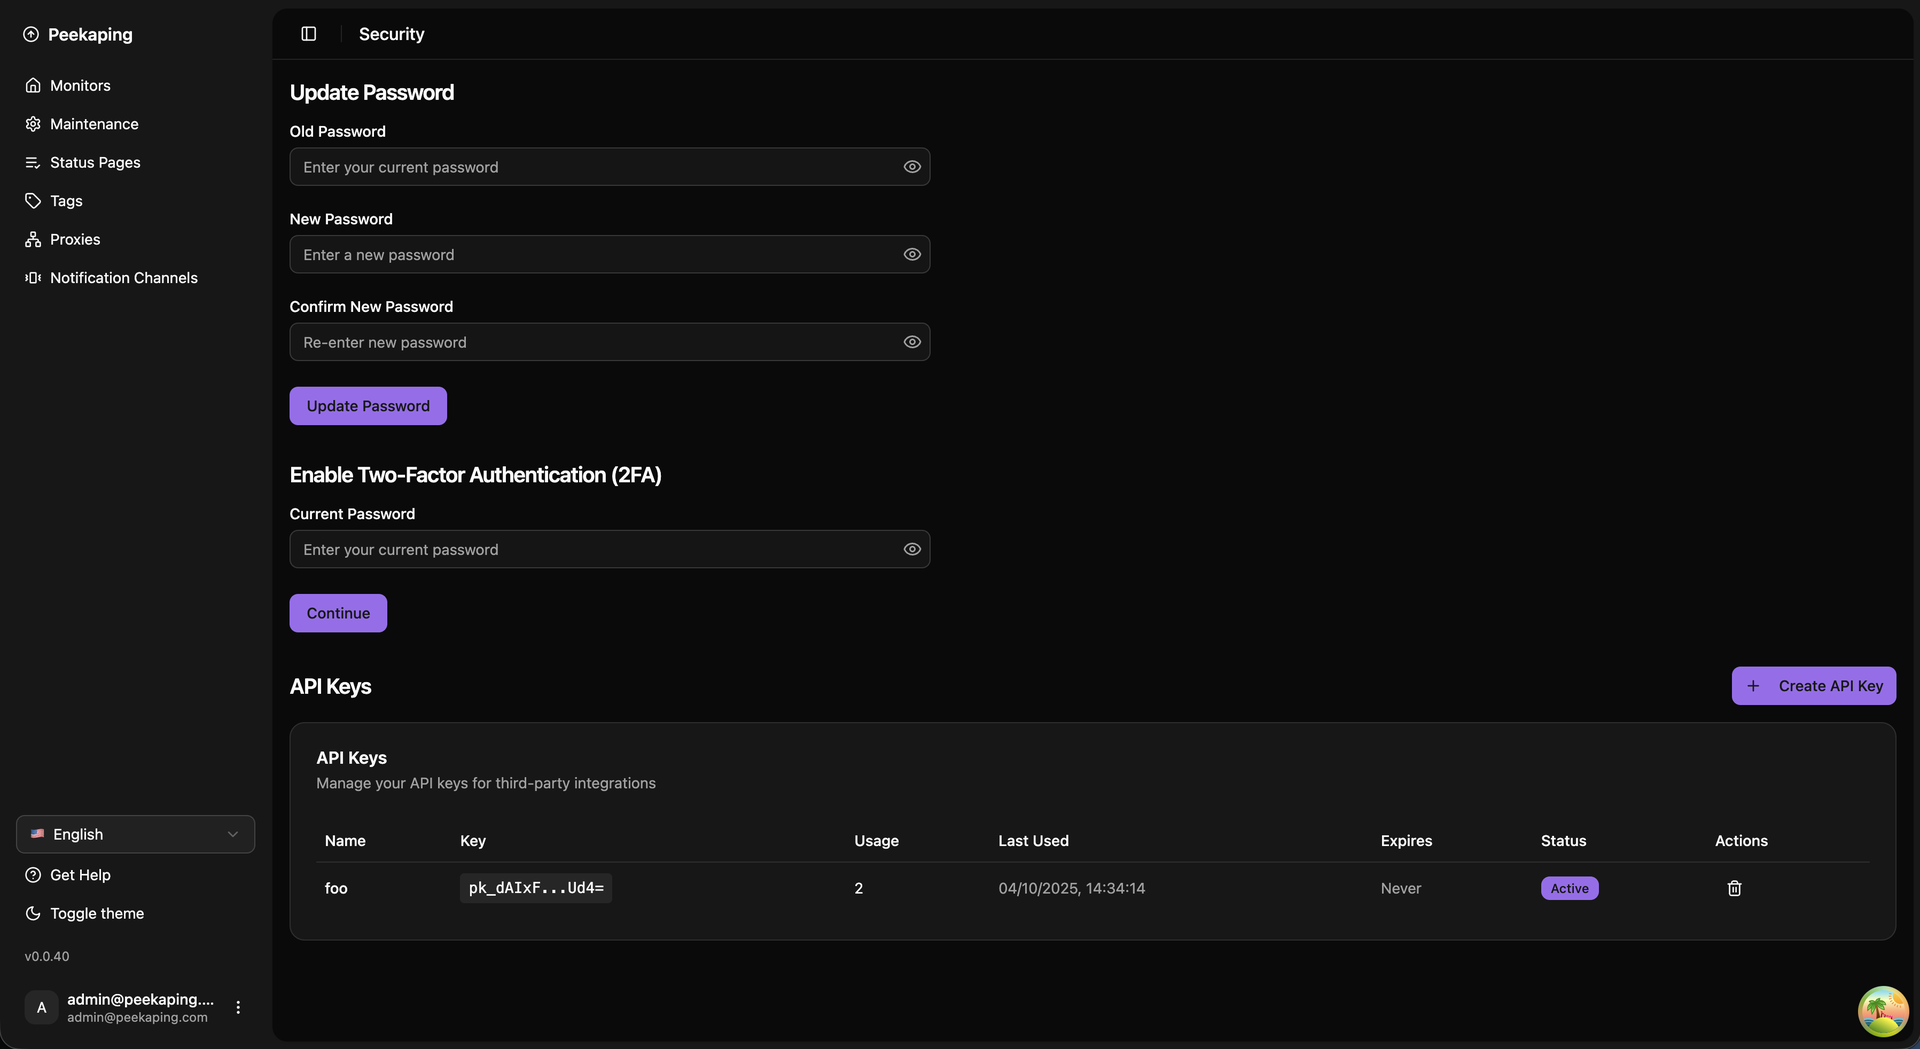
- Enforce multi-factor authentication, brute-force login defenses, scoped REST API keys, and role-based permissions for multi-tenant engineering environments.