Stars
Forks
Watchers
Developer links
Grafana
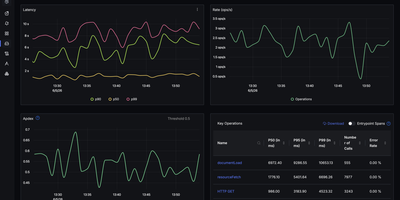
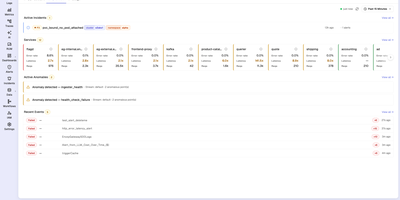
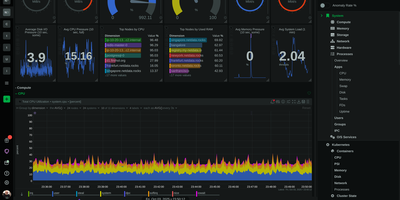
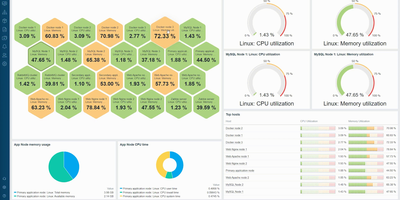
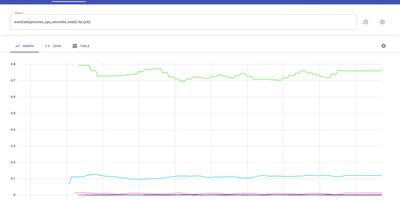
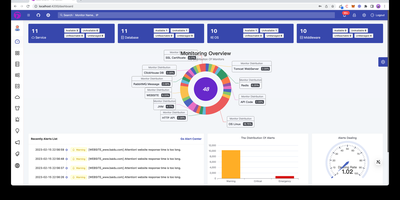
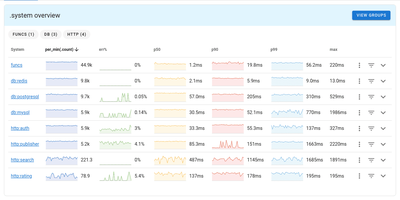
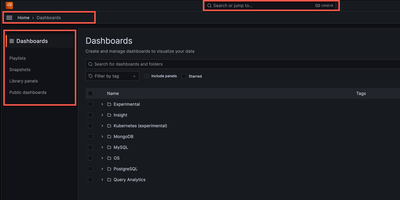
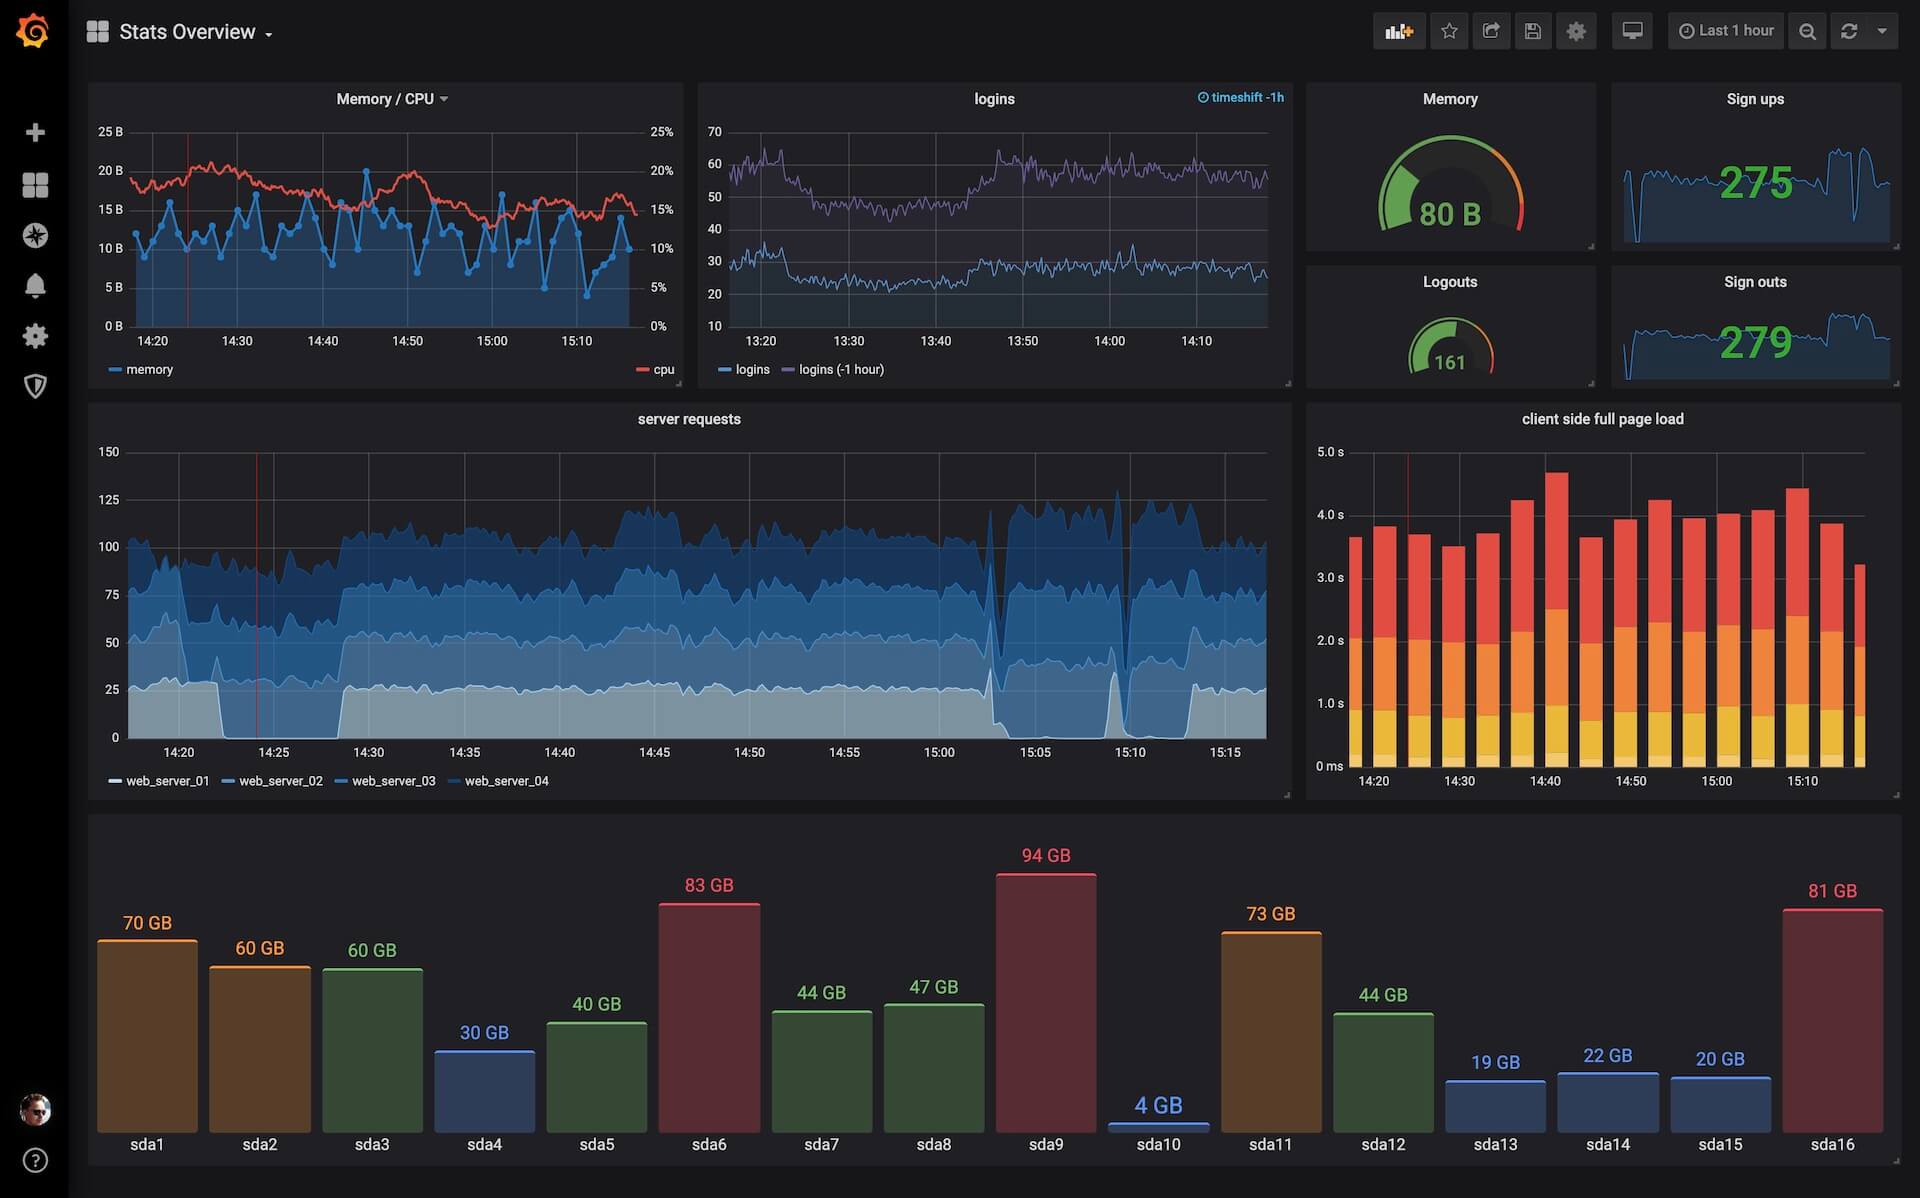
The de facto dashboard of observability: Grafana is the open-source frontend that turns the data stores you already run into interactive graphs. It does not store metrics itself; it connects to the data stores you already run and turns their contents into interactive dashboards. Supported sources number over 150 via plugins: Prometheus, Loki, Tempo, InfluxDB, Elasticsearch, MySQL, PostgreSQL, Microsoft SQL Server, AWS CloudWatch, Azure Monitor, Google Cloud Monitoring, and many more. Dashboards are built from a large library of panel types (time series, heatmaps, tables, gauges, logs) with template variables for reusable, parameterized views. Unified alerting evaluates rules against any connected data source, not just Prometheus, and routes notifications to Slack, PagerDuty, email, and other channels with grouping and silencing - unlike Prometheus Alertmanager, a single rule can combine a Loki log pattern, a PostgreSQL query result, and a CloudWatch metric. Dashboards serialize to JSON and data sources configure via provisioning files, so the entire observability setup can live in Git and deploy repeatably across environments. Explore mode adds ad-hoc querying outside dashboards, with split view for correlating a metric spike against the matching log lines, and access control spans organizations, teams, folder permissions, and OAuth, LDAP, and SAML integration. Written in Go and TypeScript, AGPL-licensed. Self-hosting gives you unlimited users, dashboards, and queries at flat hosting cost, without Grafana Cloud's usage-based pricing.
Benefits
- One Frontend for the Whole Stack
- Instead of separate UIs for metrics, logs, traces, and business data, Grafana queries all of them through data source plugins and presents them side by side on the same dashboard.
- Alerting Across Any Data Source
- Unlike Prometheus Alertmanager, which only fires on Prometheus metrics, Grafana alert rules can evaluate a Loki log pattern, a PostgreSQL query result, or a CloudWatch metric, and combine conditions across sources in one rule.
- Dashboards as Code
- Dashboards serialize to JSON and data sources configure via provisioning files, so your entire observability setup can live in Git and deploy repeatably across environments.
- No Usage-Based Billing
- Hosted observability platforms bill by data volume, users, or host count. A self-hosted Grafana instance has unlimited users, dashboards, and queries at flat hosting cost.
Features
- 150+ Data Source Plugins
- Prometheus, Loki, Tempo, Mimir, InfluxDB, Elasticsearch, OpenSearch, MySQL, PostgreSQL, MSSQL, CloudWatch, Azure Monitor, Google Cloud Monitoring, and more, each queried in its native language.
- Rich Panel Library
- Time series, bar and heatmap charts, tables, gauges, stat panels, log viewers, and node graphs, with thresholds, transformations, and per-panel overrides.
- Unified Alerting
- Grafana-managed alert rules with multi-source conditions, notification policies, grouping, silences, and delivery to Slack, PagerDuty, Opsgenie, webhooks, and email.
- Template Variables
- Dropdown variables make one dashboard serve many hosts, services, or environments, populated dynamically from data source queries.
- Explore Mode
- Ad-hoc querying of metrics and logs outside dashboards, with split view for correlating a metric spike against the matching log lines.
- Auth and Team Management
- Organizations, teams, folder-level permissions, and integration with OAuth, LDAP, and SAML providers for controlled multi-user access.