Postiz
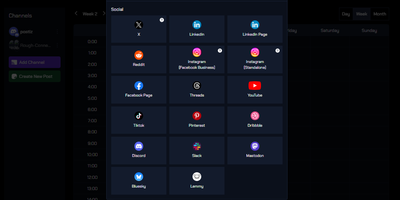
Powering over $145K monthly recurring revenue as a one-person company and holding 34,000+ GitHub stars, Postiz has emerged as the most widely adopted open-source alternative to Buffer, Hootsuite, and Hypefury — combining social media scheduling with AI-driven content creation and agentic automation in a single self-hosted platform. The Next.js 14 frontend with React 18 and Tailwind CSS delivers a visual calendar and Canva-like design editor, while the NestJS backend orchestrates publishing across 30+ social networks including X, LinkedIn, Instagram, TikTok, YouTube, Reddit, Pinterest, Threads, Dribbble, Discord, Bluesky, Mastodon, and Facebook. Temporal handles durable workflow execution for reliable scheduled posting, retry logic, and background job processing. The built-in AI assistant generates post ideas, captions, hashtags, images, and short videos from natural language prompts — all within a single chat interface. An agentic layer exposes a CLI and MCP server that allow AI agents like OpenClaw, Claude, and ChatGPT to autonomously plan, draft, and schedule posts programmatically. Team collaboration includes role-based permissions, approval workflows, multi-workspace management for agencies, and commenting on scheduled content. A full REST API with a NodeJS SDK, N8N custom nodes, and Make.com integration enables automation pipelines. Analytics track engagement, reach, and growth across all connected accounts from a unified dashboard. The self-hosted stack deploys via Docker Compose with PostgreSQL, Redis, and Temporal pre-wired — no feature limitations compared to the cloud version. Running on a dedicated VPS on RepoCloud with guaranteed CPU, RAM, and SSD, full root SSH access, and a browser serial console. AGPL-3.0 licensed.
PostgreSQL
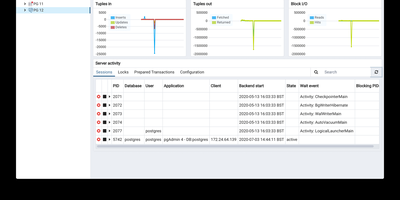
Consistently ranked the most loved and most wanted database in developer surveys, PostgreSQL powers mission-critical workloads at Apple, Instagram, Spotify, and the U.S. Federal Aviation Administration with an architecture refined over nearly four decades since its origins at UC Berkeley. Its native JSONB type stores JSON in an indexed binary format with GIN and GiST index support, enabling document-store capabilities that eliminate the need for a separate NoSQL database in many architectures. The extension ecosystem exceeds 1,000 add-ons: PostGIS provides ISO-compliant geospatial queries, pgvector enables AI embedding similarity search, TimescaleDB adds time-series hypertable compression, and Citus distributes tables across nodes for horizontal scaling. PostgreSQL supports declarative partitioning by range, list, or hash, parallel query execution across multiple CPU cores, and four transaction isolation levels including full Serializable. Streaming replication provides physical standby servers with synchronous or asynchronous modes, while logical replication enables selective table-level change data capture through the Write-Ahead Log. Stored procedures run in PL/pgSQL, PL/Python, PL/Perl, and PL/V8 JavaScript, and advanced indexing includes B-tree, GIN, GiST, SP-GiST, BRIN, and hash types. Full-text search is built in with tsvector and tsquery, and row-level security policies enforce fine-grained access control. Running on a dedicated VPS on RepoCloud with guaranteed CPU, RAM, and SSD, full root SSH access, and a browser serial console. PostgreSQL License (MIT-like permissive) licensed.
OpenPanel
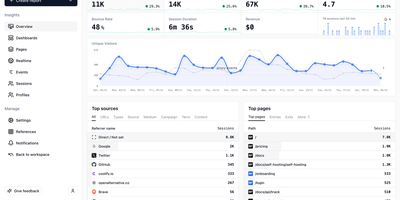
Known as the open-source Mixpanel alternative that respects user privacy, OpenPanel delivers a unified web and product analytics platform combining Mixpanel's behavioral analysis with the simplicity of Plausible and full data ownership through self-hosting. Cookieless tracking eliminates consent banners entirely while still capturing events, page views, sessions, user journeys, funnels, retention cohorts, and custom properties with full GDPR compliance by design. The 2.3 KB async script loads without blocking page rendering, and 16 official SDKs cover Next.js, React, Vue, Astro, Remix, Nuxt, Angular, Svelte, React Native, Swift, Kotlin, Python, PHP, Laravel, Express, and REST API for custom integrations. Real-time dashboards display live visitor counts, active sessions, and event streams as they happen. Custom chart builders create tailored visualizations from any tracked event with breakdowns by property, time period, and user segment. Session replay reconstructs individual user journeys showing every page visited, event triggered, and interaction recorded. Funnel analysis identifies conversion drop-offs with step-by-step breakdown and property filtering. Retention analysis measures how often users return with customizable time windows and cohort comparisons. A/B testing and variant tracking enable experiment measurement directly within the platform. Event notifications alert when specific events occur or thresholds are crossed. The self-hosted deployment uses Docker Compose with ClickHouse for high-speed analytical queries, PostgreSQL for metadata, and Redis for real-time processing — deployable on any VPS or Kubernetes cluster. Running on a dedicated VPS on RepoCloud with guaranteed CPU, RAM, and SSD, full root SSH access, and a browser serial console. AGPL-3.0 licensed.
Open SEO
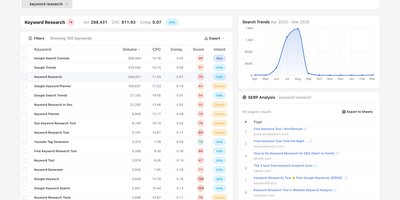
OpenSEO provides an alternative to the $100+/month SEO suite monopoly by connecting directly to DataForSEO APIs on a pay-as-you-go basis — you bring your own API key and pay only for the queries you actually make. The platform delivers focused workflows for keyword research with volume, difficulty, CPC, intent, and live SERP inspection; rank tracking with historical position monitoring; backlink analysis with referring domain quality scoring; technical site audits that crawl pages and surface issues; competitor insights comparing SERP positions across keyword sets; and AI visibility monitoring that tracks brand mentions, citations, and prompts across AI models. The integrated MCP server exposes all tools to AI coding agents including Claude Code, OpenClaw, Hermes, and Cursor, while Agent Skills provide reusable SKILL.md workflows that guide agents through complex SEO research tasks. Google Search Console integration reads first-party performance data including clicks, impressions, CTR, and position metrics with URL-level index status inspection. The Prompt Explorer compares how different AI models respond to SEO-relevant queries. Self-host via Docker for personal use or deploy to Cloudflare for team access with automatic database backups. The hosted version at openseo.so adds a 28% markup on DataForSEO requests. Running on a dedicated VPS on RepoCloud with guaranteed CPU, RAM, and SSD, full root SSH access, and a browser serial console. MIT licensed.
TeslaMate
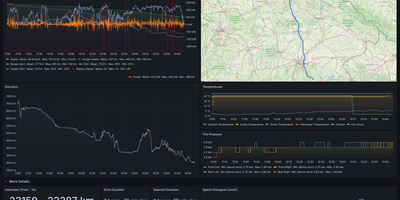
Logging every drive, charge, and idle stretch of a Tesla to a database you own, TeslaMate shows where the battery went, including degradation, vampire drain, and charging cost. Battery health comes first: the dashboard estimates usable capacity, range lost, and degradation against mileage. Idle losses come next, with Vampire Drain listing how much charge disappears during every idle period and a States view recording every online, asleep, and offline stretch. The car is left alone to fall asleep, so logging adds no extra vampire drain. Charging sessions show curves, energy added and used, efficiency, and cost, using per-location prices attached to geo-fences drawn on a map. Each drive records second-by-second speed, power, elevation, and temperature, plotted on a route map beside tire pressure and consumption charts. Trip, Drives, Efficiency, Drive Stats, Mileage, Updates, Statistics, and a lifetime driving map fill in the rest. Live vehicle data goes out over MQTT to Home Assistant, Node-RED, and Telegram, and old history imports from TeslaFi or tesla-apiscraper. Several vehicles on one Tesla account work together, addresses are looked up automatically, and the web interface offers light, dark, or system themes in 19 languages. Sign-in uses Tesla access and refresh tokens that TeslaMate encrypts with a key you set. It works best on an always-on server. Running on a dedicated VPS on RepoCloud with guaranteed CPU, RAM, and SSD, full root SSH access, and a browser serial console. AGPL-3.0 licensed.
World Monitor
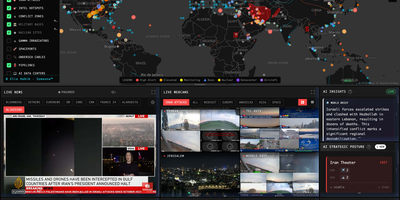
World Monitor replaces twenty or more browser tabs by fusing geopolitical, military, financial, and infrastructure signals onto a single interactive canvas built with TypeScript, Vite, globe.gl with Three.js for the 3D globe, and deck.gl with MapLibre GL for the flat map. World Monitor ingests live data from 530 upstream sources including ACLED and UCDP for conflict events, OpenSky Network for military and civilian aircraft, AISStream for vessel positions, NASA FIRMS for satellite fire detection, USGS for earthquakes, and FRED, IMF, BIS, and Finnhub for macroeconomic and market data. The Country Instability Index v8 computes real-time stress scores across 31 Tier-1 nations, while the finance radar tracks 29 stock exchanges, commodities, and cryptocurrency with a 7-signal market composite. Six specialized dashboard variants — World, Tech, Finance, Commodity, Energy, and Happy — deploy from a single codebase. AI summarization runs locally through Ollama and LM Studio integration or optionally via Groq and OpenRouter cloud providers, with Transformers.js powering browser-side inference. The platform supports 26 languages with native-language feeds and RTL layout, and provides MCP server integration for AI agent connectivity. Running on a dedicated VPS on RepoCloud with guaranteed CPU, RAM, and SSD, full root SSH access, and a browser serial console. AGPL-3.0 licensed.
Tianji
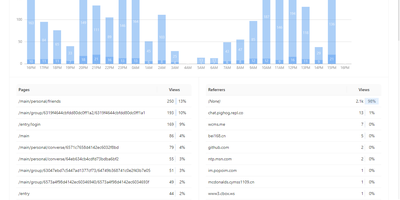
Website analytics, uptime monitoring, and server status - three tools most teams run separately - combined in Tianji, an open-source observability platform. The analytics layer tracks page views, unique visitors, referrers, and UTM parameters with a lightweight cookie-less script, which keeps collection GDPR and CCPA friendly. The uptime monitor checks availability and latency on configurable intervals, accepts passively reported results, and publishes public status pages for incident communication. Server status agents report CPU, memory, disk, and network metrics with threshold-based alerts, and notifications route through webhooks, Slack, Telegram, and other channels with noise control. It also includes anonymous telemetry for tracking deployments of your own open-source projects, surveys, waitlists, team collaboration, and an OpenAPI interface for integrations and exports. The consolidation is the point: traffic analytics, uptime checks, and server metrics share one interface and one alerting layer, so diagnosing an incident does not mean hopping between Google Analytics, Uptime Kuma, and Prometheus - and the built-in public status pages replace a separate paid Statuspage-style subscription. Because collection uses no cookies with IP truncation and aggregation by default, basic traffic measurement requires no consent banner. Built in TypeScript under the Apache 2.0 license and inspired by Umami and Uptime Kuma, it is deliberately right-sized for independent developers and small SaaS teams whose monitoring needs are real but lightweight.
LightDash
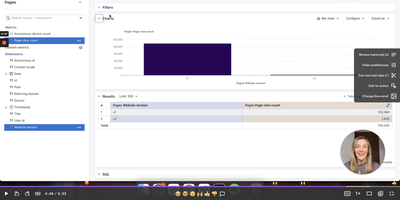
With 5,600+ GitHub stars and deep dbt integration, Lightdash is the open-source Agentic BI platform that treats analytics like software — defining metrics, dimensions, joins, permissions, and caching in a governed context layer that powers dashboards, AI agents, data apps, embedded analytics, and MCP server endpoints simultaneously. The dbt Write-Back feature lets business users create custom metrics and models in the UI, then automatically generates pull requests in GitHub or GitLab so every change flows through code review and CI validation before reaching production. Context-specific AI analysts automatically select relevant models and metrics, build queries, and present insights in plain English, while row-level security, user attributes, and customer-facing permissions ensure data governance at every layer. The platform connects to BigQuery, Snowflake, Redshift, Databricks, PostgreSQL, Trino, and ClickHouse through warehouse adapters, with the TypeScript monorepo built on React, Mantine, Vite, and TanStack Query on the frontend plus Node.js, Express, Knex, and PostgreSQL on the backend. Data teams build analytics with coding agents, preview changes from the CLI, validate in CI pipelines, and review charts and dashboards in pull requests — making the entire analytics lifecycle version-controlled and reproducible. Running on a dedicated VPS on RepoCloud with guaranteed CPU, RAM, and SSD, full root SSH access, and a browser serial console. MIT licensed.
Temps
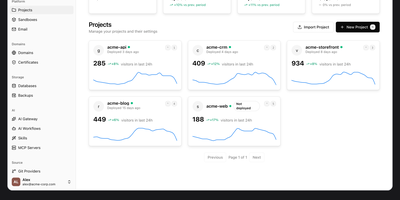
Consolidate application hosting, web analytics, error tracking, and performance monitoring into Temps, an open-source developer platform that replaces disparate SaaS subscriptions with a single compiled Rust binary. Engineering teams deploy full-stack web applications, background daemons, and microservices directly from Git repositories with automated TLS certificate provisioning powered by an embedded Cloudflare Pingora reverse proxy. The centralized web console unifies real-time visitor analytics, conversion funnels, and rrweb-powered session replay recordings without third-party tracking scripts. Integrated error monitoring ingests runtime exceptions with full stack traces and source map resolution, while continuous health checks evaluate container CPU utilization, memory thresholds, and network throughput across custom alerting rules. Developers manage infrastructure through an extensive command line interface containing over 440 operations across 69 command groups, or deploy drop-in skill files that allow AI coding assistants like Claude Code and Codex to provision preview environments autonomously. The platform also provides serverless key-value storage, S3-compatible blob buckets, and native transactional email routing with custom DKIM validation. Running on a dedicated VPS on RepoCloud with guaranteed CPU, RAM, and SSD, full root SSH access, and a browser serial console. Apache 2.0 licensed.
Netdata
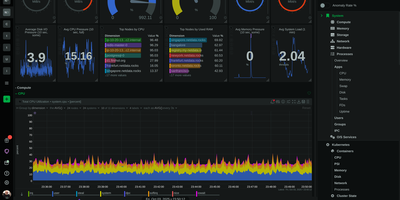
Trusted by millions of engineers and deployed on over 80,000 GitHub stars worth of community confidence, Netdata delivers true real-time monitoring at per-second granularity — 10-60x faster than Prometheus, Datadog, or any conventional monitoring stack that averages away the transient anomalies lasting 2-10 seconds where most production incidents originate. A single installation command deploys the agent with zero configuration, automatically discovering every running process, container, systemd service, network connection, disk, and application on the host within seconds. Unsupervised machine learning trains multiple models per metric directly at the edge, detecting anomalies without thresholds, baselines, or manual tuning. The distributed Parent-Child architecture scales horizontally from a single Raspberry Pi to fleets exceeding 100,000 nodes while maintaining sub-2-second visualization latency and storing metrics at approximately 0.5 bytes per sample through tiered compression. Native network monitoring provides live topology maps, NetFlow and sFlow analytics, SNMP device polling across 200+ profiles, and trap handling — capabilities that typically require a separate NPM product. Hundreds of pre-configured alerts cover systems and applications out of the box, with AI-powered root cause analysis surfacing correlated metrics through natural language via MCP-compatible AI assistants. The agent supports Linux, macOS, FreeBSD, Kubernetes, and Docker with eBPF-based kernel observability requiring no application instrumentation. Running on a dedicated VPS on RepoCloud with guaranteed CPU, RAM, and SSD, full root SSH access, and a browser serial console. GPL v3+ licensed.
SerpBear
Unlimited domains, unlimited keywords, daily Google position checks with stored history and trend charts: SerpBear is an open-source search engine rank tracker. Retrieval works through your choice of third-party SERP APIs - ScrapingAnt, ScrapingRobot, SerpApi, SearchApi, HasData - or your own proxy IP pool, and a flexible scrape-strategy system (Basic, Custom, or Smart, set globally or per domain) works around Google's removal of the 100-results-per-page parameter by choosing how many pages to check per keyword. Google Search Console integration adds real visit counts, impressions, and click-through rates per tracked keyword and surfaces top-performing pages and countries; Google Ads integration supplies monthly search volumes and auto-generates keyword ideas from your site's content. Email notifications report position changes daily, weekly, or monthly, a built-in REST API feeds dashboards and reporting tools, and data exports to CSV. Built with Next.js on SQLite, deployed via Docker, installable as a PWA on mobile - with no per-keyword or monthly SaaS fees.
OpenReplay
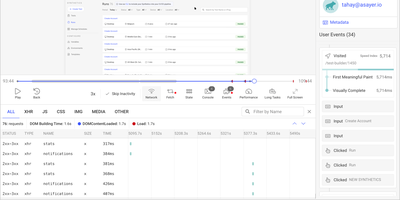
Backed by 12,400+ GitHub stars and positioned as the self-hosted alternative to FullStory and Hotjar, OpenReplay delivers the open-source session replay platform that keeps every byte of user behavior data on your own infrastructure. The JavaScript tracker captures pixel-perfect recordings of clicks, scrolls, form inputs, and navigation with automatic sensitive data masking, while simultaneously logging network requests, console errors, JavaScript exceptions, and Redux, VueX, MobX, NgRx, Pinia, and Zustand store state changes for complete technical context. DevTools mode reconstructs each session with full stack traces, GraphQL queries from Apollo and Relay, Fetch and Axios request payloads, CPU and memory metrics, and page speed waterfall charts — effectively giving developers a browser inspector tied to any user session. Product analytics surfaces conversion funnels, user journeys, click heatmaps, web vitals trends, and retention cohorts without requiring custom instrumentation. Co-browsing connects support agents to live user sessions with cursor control and WebRTC audio, enabling real-time assistance without third-party screen-sharing software. Integrations push session context into Sentry, Datadog, CloudWatch, Stackdriver, and Elastic for front-to-back debugging. Feature flags enable gradual rollouts with session-level targeting. The platform deploys to any cloud via Docker and Kubernetes with auto-scaling ingestion handling up to 50,000 sessions per month on the open-source edition. Running on a dedicated VPS on RepoCloud with guaranteed CPU, RAM, and SSD, full root SSH access, and a browser serial console. AGPLv3 licensed.
Frappe Insights
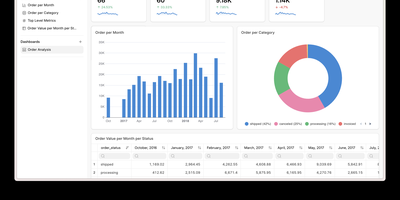
Frappe Insights delivers a self-hosted business intelligence platform where non-technical users build complex analytical queries without writing SQL. The visual query builder uses Ibis under the hood to compose optimized SQL from drag-and-drop column selections, filters, aggregations, and group-by operations — translating point-and-click interactions into performant database queries across MySQL, PostgreSQL, DuckDB, and BigQuery. The join editor provides a graphical interface for defining multi-table relationships, letting analysts connect data across schemas without understanding foreign keys or join types. The chart builder renders interactive visualizations using Apache eCharts with support for bar, line, area, pie, scatter, funnel, and pivot table chart types — each configurable with axes, colors, legends, and formatting options. Dashboards combine multiple charts into shareable views with layout customization, auto-refresh intervals, and filter propagation across widgets. Data source management handles connection pooling across multiple databases simultaneously, enabling cross-database analysis in single queries. Server scripts extend query capabilities with custom Python transformations for complex business logic that visual tools cannot express. Built on the Frappe Framework's full-stack architecture, deployment uses Docker via the official easy-install script that provisions the complete stack including MariaDB, Redis, and Nginx. Running on a dedicated VPS on RepoCloud with guaranteed CPU, RAM, and SSD, full root SSH access, and a browser serial console. AGPL-3.0 licensed.

Grafana
The de facto dashboard of observability: Grafana is the open-source frontend that turns the data stores you already run into interactive graphs. It does not store metrics itself; it connects to the data stores you already run and turns their contents into interactive dashboards. Supported sources number over 150 via plugins: Prometheus, Loki, Tempo, InfluxDB, Elasticsearch, MySQL, PostgreSQL, Microsoft SQL Server, AWS CloudWatch, Azure Monitor, Google Cloud Monitoring, and many more. Dashboards are built from a large library of panel types (time series, heatmaps, tables, gauges, logs) with template variables for reusable, parameterized views. Unified alerting evaluates rules against any connected data source, not just Prometheus, and routes notifications to Slack, PagerDuty, email, and other channels with grouping and silencing - unlike Prometheus Alertmanager, a single rule can combine a Loki log pattern, a PostgreSQL query result, and a CloudWatch metric. Dashboards serialize to JSON and data sources configure via provisioning files, so the entire observability setup can live in Git and deploy repeatably across environments. Explore mode adds ad-hoc querying outside dashboards, with split view for correlating a metric spike against the matching log lines, and access control spans organizations, teams, folder permissions, and OAuth, LDAP, and SAML integration. Written in Go and TypeScript, AGPL-licensed. Self-hosting gives you unlimited users, dashboards, and queries at flat hosting cost, without Grafana Cloud's usage-based pricing.
Aptabase
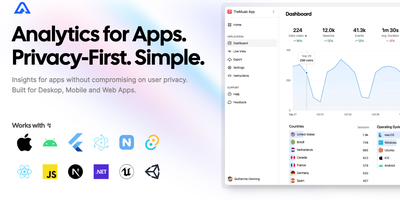
Web analytics tools ignore native mobile, desktop, and game apps; Aptabase was built for exactly those. If Firebase Analytics would force a privacy-policy footnote you don't want to write, this is the alternative - session-based metrics with no cookies, no IDFA or GAID, no device fingerprinting, and a daily-rotated salt that makes cross-day re-identification mathematically impossible. That design means GDPR, CCPA, and PECR compliance out of the box and "Data Not Collected" App Store privacy labels without ATT prompts. The SDK coverage is the widest in its category: eleven first-party libraries spanning Swift, Kotlin, Flutter, React Native, Tauri, Electron, .NET MAUI, NativeScript, Unity, Unreal Engine, and JavaScript for web - each MIT-licensed, following platform conventions, and accepting a custom host parameter that points at your instance. Integration is minutes: initialize with an app key, call trackEvent with optional properties, and the dashboard shows sessions, events, app versions, OS breakdowns, and country-level geography. The self-hosted stack is a .NET server over PostgreSQL for metadata and ClickHouse for high-volume event ingestion, giving cloud-parity features under an AGPL license. For indie iOS/Android apps, Electron and Tauri tools, and Unity or Unreal games, it replaces Firebase without the Google entanglement.
Formbricks
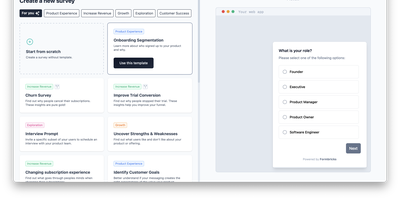
In-app, website, link, and email surveys feed one open-source experience management platform: Formbricks. Its distinguishing strength is targeted in-app research: a JavaScript SDK triggers surveys on user events and attributes, with segmentation rules like "power users who have not seen a survey in 10 days," so questions reach the right cohort at the right moment instead of a mass email blast. The no-code editor offers 20+ question types including NPS, CSAT, CES, matrix, ranking, and file upload, with skip logic, conditional branching, best-practice templates, and full brand theming. Responses feed built-in analytics with summaries and CSV/JSON export, and integrations push data to Slack, Notion, Google Sheets, Airtable, Zapier, and n8n, with webhooks and an open API on every tier. Because self-hosted surveys load from your own domain rather than a blacklisted third-party script host, ad blockers do not suppress them - in-app surveys reach users that Hotjar-style tools silently miss, which measurably raises response rates. Self-hosting also removes the third-party sub-processor from your privacy policy entirely: survey responses often contain PII, and keeping them on your own server matters for GDPR-sensitive and regulated industries. The Community Edition has no response caps or tier-gated features, so core functionality and your data stay accessible regardless of any subscription. Next.js on PostgreSQL, AGPLv3.

Tautulli
Plex's own dashboard shows current streams and forgets everything else - which is why every Plex server admin eventually installs Tautulli, the analytics layer. This Python web application (descended from PlexWatch and Headphones) logs complete watch history - what was watched, who watched it, when, where, from which device and IP, and whether it played directly or transcoded - and turns it into clean Highcharts graphs of daily plays, concurrent streams, bandwidth, and platform breakdowns. The home page surfaces top statistics over configurable windows: most-watched content, most active users, stream type ratios. For running a server shared with family and friends, this is operational truth: spot the user forcing 4K transcodes on a phone, see which libraries earn their disk space, and track sync activity across users. The notification engine triggers on server events - playback starts, transcode decision changes, recently added media, server down - through dozens of agents (Discord, Telegram, Slack, email, webhooks) with fully customizable text and conditions, plus arbitrary script execution. Scheduled newsletters email your users a styled digest of recently added content. A comprehensive API exposes every statistic for dashboards like Homarr, and an official mobile app monitors activity on the go. Themed to match Plex/Web. GPL-licensed.
GoatCounter
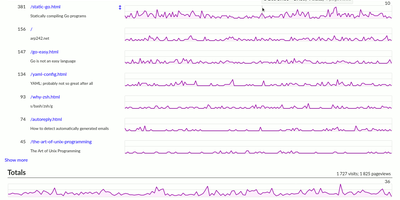
GoatCounter delivers meaningful web traffic insights — pageviews, referrers, browsers, screen sizes, country-level geolocation — without setting a single cookie, without collecting personal data, and without forcing GDPR consent banners on your visitors. Written entirely in Go and distributed as a single compiled binary consuming roughly 25MB of RAM, it adds just 3.5KB to your pages via the tracking script, with a JavaScript-free tracking pixel alternative for sites that avoid scripts entirely, plus backend middleware integration and log file import for server-side collection. The dashboard displays pageview counts per path with hourly resolution, referrer sources grouped by domain with full URL on hover, browser and OS version breakdowns, screen size distributions, and country-level location data derived from IP addresses that are immediately discarded after geolocation. Campaign tracking supports UTM parameters and custom data attributes. A public stats option exposes your dashboard at a shareable URL for build-in-public transparency. SQLite serves as the default database requiring zero administration, while PostgreSQL handles higher-traffic deployments with multi-site setups. Built-in ACME and TLS certificate management eliminates reverse proxy requirements for HTTPS — no Nginx or Caddy needed. The REST API provides programmatic access to all analytics data. Deploy as a single binary, via Docker with the official arp242/goatcounter image, or through native packages. Running on a dedicated VPS on RepoCloud with guaranteed CPU, RAM, and SSD, full root SSH access, and a browser serial console. EUPL-1.2 licensed.