Archestra
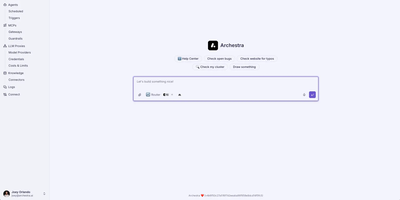
Archestra delivers the enterprise AI infrastructure layer that organizations need when managing multiple LLM providers, MCP servers, and AI agents across teams becomes unmanageable. The LLM gateway routes requests across Anthropic, OpenAI, Azure, Bedrock, and DeepSeek with virtual API keys, per-team cost limits, and dynamic model routing — giving every developer one token for Claude Code, Cursor, or Codex while finance tracks spend per department. The MCP gateway authenticates tool calls with OAuth 2.1 and On-Behalf-Of tokens so each tool executes as the calling user, not a shared service account, eliminating credential sprawl. The private MCP registry lets teams publish custom tool servers with approval flows promoting servers from dev through staging to production, each environment maintaining its own credentials and network egress policies. The Kubernetes operator manages MCP server lifecycle — deploying containers, scaling, health-checking, and routing gateway traffic to local servers automatically. The agent runtime supports scheduled triggers, email and webhook invocations, sub-agent delegation, reusable skills, and sandboxed code execution with a K8s-native filesystem. Deterministic guardrails including Dual-LLM verification and Lethal Trifecta protections prevent dangerous tool calls before execution. Built-in OpenTelemetry traces and Prometheus metrics provide full observability without additional tooling. Docker deployment exposes the Admin UI on port 3000 and API on port 9000 with a single command. Running on a dedicated VPS on RepoCloud with guaranteed CPU, RAM, and SSD, full root SSH access, and a browser serial console. AGPL-3.0 licensed.
Mattermost
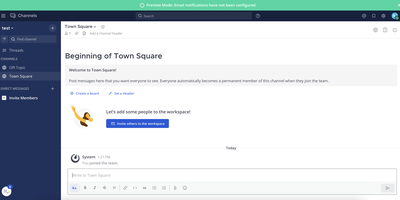
Teams that cannot send messages through someone else's cloud run Mattermost - the open-core, self-hosted alternative to Slack. It provides public and private channels, threaded discussions, unlimited search history, file sharing with previews, one-to-one audio calls, and screen sharing, with desktop clients for Windows, macOS, and Linux plus iOS and Android apps. Messages support full Markdown, which suits engineering conversations with code blocks and logs. Playbooks turn repeatable processes such as incident response and release management into checklist-driven workflows with automated triggers and retrospectives. Integration is a core strength: prebuilt connectors for GitHub, GitLab, Jira, ServiceNow, and PagerDuty, plus webhooks, slash commands, bots, a REST API, and a plugin marketplace with 700+ entries - together making it a working surface for ChatOps rather than just a chat room. Playbooks add keyword and event triggers, task assignment, status broadcasting, and post-incident retrospectives, so operational knowledge is not trapped in individuals' heads. The server is a single Go binary backed by PostgreSQL, with React clients, released monthly under MIT license and deployable fully air-gapped - which is why governments and defense organizations run it inside closed networks, and why the same control applies to any team with confidentiality requirements. The compiled Team Edition is free for unlimited users with no message history cutoff, so costs stay flat as the team grows.
Openship
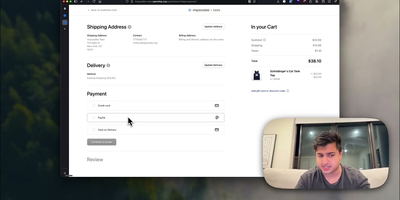
Point Openship at a GitHub repo, local folder, or prebuilt artifact and it detects your stack, builds a Docker container, provisions databases, configures domains with automatic Let's Encrypt TLS, and routes traffic through an OpenResty edge layer on ports 80 and 443. Already past 10,000 stars since launching in March 2026, it turns any Linux VPS into a managed application host. Language support covers Node.js, Python, Go, Rust, PHP, Ruby, Java, .NET, Docker, and monorepo projects with push-to-deploy CI/CD, pull request preview environments on unique subdomains, staging/production flows, and one-click rollbacks. Integrated backend services include managed Postgres, MySQL, MongoDB, Redis, persistent volumes, WebSocket proxying, object storage, and worker processes, all provisioned from the dashboard without compose files. A built-in SMTP server handles transactional email with automatic DKIM, SPF, and DMARC configuration, eliminating external email services. The edge layer serves HTTP/3 with Brotli compression, configurable cache rules, and instant purging. Real-time monitoring streams build logs, container metrics, visitor geography, and per-status-code analytics at 1.4 microsecond overhead with zero database writes. Scheduled backups cover databases and volumes with one-click restore and export. Three interfaces (web dashboard, desktop app for macOS/Windows/Linux, and the openship CLI) drive the same API, plus a Model Context Protocol endpoint for AI integration. Running on a dedicated VPS on RepoCloud with guaranteed CPU, RAM, and SSD, full root SSH access, and a browser serial console. Apache 2.0 licensed.
Coolify VPS
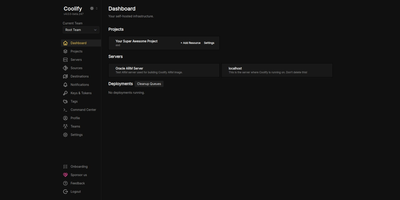
The open-source PaaS with 55,000+ GitHub stars and the largest one-click service catalog in its class — Coolify gives you the Vercel push-to-deploy workflow on a dedicated server you control. Connect a GitHub, GitLab, Bitbucket, or Gitea repository and every push builds and deploys automatically via Nixpacks, a Dockerfile, or Docker Compose, with Traefik or Caddy reverse proxying, automatic Let's Encrypt certificates, and per-branch preview deployments with their own URLs. Databases — PostgreSQL, MySQL, MariaDB, MongoDB, Redis — provision in a few clicks, and a catalog of 280+ one-click service templates covers WordPress, n8n, Grafana, MinIO, Plausible, Ollama, and more. One dashboard manages the entire server, with Docker Swarm available for clustering multiple nodes. Backups go to any S3-compatible storage with one-click restore, and a full API supports CI/CD integration. All configuration lives on your own server, so resources keep running even if you stop using Coolify — no vendor lock-in by design. Running on a dedicated VPS with guaranteed CPU, RAM, and SSD, full root access via SSH and browser console. Apache 2.0 licensed.
DeepSeek Harness
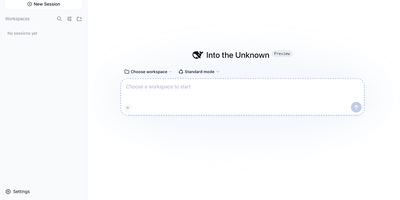
DeepSeek Harness gained over 60,000 GitHub stars within hours of its August 2026 launch, establishing itself as the first fully modular open-source agent runtime where literally every component is a swappable plugin. Built on the Cordis framework—a programming paradigm for spatiotemporal composability—dsh decomposes the entire agent stack into independently replaceable pieces: model adapters for DeepSeek, Anthropic, OpenAI, AWS Bedrock, Azure, and Google Gemini; tool registries covering bash execution, file system operations, web search, subagent delegation, and todo management; plus session stores, sandboxes, approval policies, orchestration loops, and the user interface itself. Four operating modes serve different workflows: Standard provides the full toolset, Code mode uses model-generated code to compose multi-round tool calls, Minimal strips down to a shell and editor for benchmarking, and Creator mode lets developers inspect the running runtime and test Cordis plugins in memory. The kernel handles plugin mounting, unmounting, and dependency resolution while typed events and services coordinate between components. Profiles and bundles allow the same codebase to produce entirely different products—a terminal coding agent, a browser-based workspace, a headless automation service, or an ACP/JSON-RPC endpoint—by swapping YAML configuration layers. Session history is stored as an append-only event stream for full trajectory replay, and project-level hooks on agent lifecycle events enable fine-grained behavioral customization. MCP client integration connects to external tool servers, while Agent Client Protocol enables programmatic orchestration. Running on a dedicated VPS on RepoCloud with guaranteed CPU, RAM, and SSD, full root SSH access, and a browser serial console. MIT licensed.
OpenHands
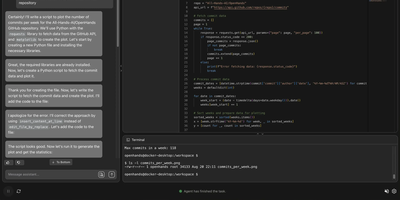
With 83,000+ GitHub stars and $18.8M in Series A funding, OpenHands delivers the leading open-source platform for AI coding agents that scored 68.4% on SWE-bench Verified with Claude Opus 4.6, outperforming Devin 2.0's publicly reported 45.8%. The Agent Canvas web UI organizes work into persistent conversations where agents edit files, run shell commands, browse the web, and execute multi-step development tasks inside isolated Docker sandbox containers. The observe-plan-act loop drives agent behavior: the Python controller manages LLM abstraction via LiteLLM routing to 100+ providers including OpenAI, Anthropic, Google, DeepSeek, Qwen, Llama, and local Ollama models. Built-in skills for code review, Docker management, PRD generation, repo-rules enforcement, release notes, and test running attach to conversations automatically via auto-discovery or trigger-based activation. The Automations system schedules recurring agent tasks with configurable templates for CI workflows, dependency updates, and documentation generation. MCP server integration enables agents to access external tools and data sources. The REST API powers an OpenAI-compatible endpoint for connecting agents to chat UIs, IDEs, and voice platforms. GitHub, GitLab, Slack, and Jira integrations enable pull request reviews, issue resolution, and team notifications. The SDK provides Python and REST APIs for embedding agents in custom tools with local or cloud execution, custom agent behaviors, and Kubernetes deployment. On RepoCloud, deploy OpenHands on a dedicated VPS with Docker socket access, persistent project storage, root SSH access, and complete control over your AI development infrastructure, all under the MIT license.
Dokploy VPS
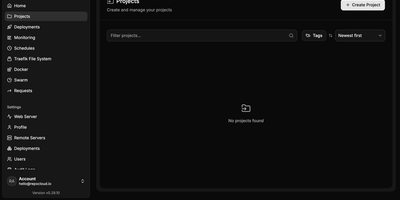
Your own Heroku or Vercel on a dedicated server — Dokploy is the open-source PaaS that replaces cloud platform subscriptions with a single dashboard you control. Point it at a Git repository or a Docker image, and it builds and deploys the application using Dockerfiles, Nixpacks, or Heroku/Paketo buildpacks. Traefik handles reverse proxying, routing, load balancing, automatic Let's Encrypt SSL, and HTTP/3. Databases — MySQL, PostgreSQL, MongoDB, MariaDB, libsql, and Redis — provision from the UI with automated backups to any S3-compatible destination. Complex multi-service applications deploy through native Docker Compose support, and multi-node scaling uses Docker Swarm. The web dashboard covers environment variables, volumes, resource limits, real-time CPU/memory/network monitoring, and deployment logs, with a CLI and REST API for automation. Deploy notifications go to Slack, Discord, Telegram, or email. One-click templates install common open-source tools, and a single control plane can manage deployments across multiple remote servers. Because everything is standard Docker, there is no lock-in: Dockerfiles, Compose files, and data volumes work anywhere else Docker runs. The push-to-deploy workflow of a $20/seat cloud PaaS, running on a dedicated VPS with guaranteed CPU, RAM, SSD, and full root access — no per-app, per-environment, or per-seat fees regardless of how many applications you deploy. 26,000+ GitHub stars.

Grafana
The de facto dashboard of observability: Grafana is the open-source frontend that turns the data stores you already run into interactive graphs. It does not store metrics itself; it connects to the data stores you already run and turns their contents into interactive dashboards. Supported sources number over 150 via plugins: Prometheus, Loki, Tempo, InfluxDB, Elasticsearch, MySQL, PostgreSQL, Microsoft SQL Server, AWS CloudWatch, Azure Monitor, Google Cloud Monitoring, and many more. Dashboards are built from a large library of panel types (time series, heatmaps, tables, gauges, logs) with template variables for reusable, parameterized views. Unified alerting evaluates rules against any connected data source, not just Prometheus, and routes notifications to Slack, PagerDuty, email, and other channels with grouping and silencing - unlike Prometheus Alertmanager, a single rule can combine a Loki log pattern, a PostgreSQL query result, and a CloudWatch metric. Dashboards serialize to JSON and data sources configure via provisioning files, so the entire observability setup can live in Git and deploy repeatably across environments. Explore mode adds ad-hoc querying outside dashboards, with split view for correlating a metric spike against the matching log lines, and access control spans organizations, teams, folder permissions, and OAuth, LDAP, and SAML integration. Written in Go and TypeScript, AGPL-licensed. Self-hosting gives you unlimited users, dashboards, and queries at flat hosting cost, without Grafana Cloud's usage-based pricing.
Verdaccio
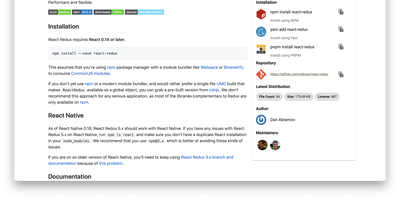
Private npm packages without shipping code to the public registry or paying for npm Enterprise: Verdaccio is the standard lightweight, zero-config private registry and caching proxy. It runs as a single Node.js process with its own tiny embedded database; no external database is required to start. Point npm, yarn, or pnpm at it and everything behaves as expected: install, publish, unpublish, dist-tags, and deprecation all work against the standard npm endpoints. The uplink system is where it earns its keep: packages not found locally are fetched from configured upstreams (npmjs.org, yarn, JFrog, Nexus, or another Verdaccio), cached as tarballs, and served locally thereafter - cutting CI latency and surviving registry outages. Multiple uplinks chain for failover, and per-package glob patterns in config.yaml route scopes to specific upstreams while controlling access, publish, and unpublish rights per group. You can even override a public package by publishing a patched version under the same name locally. A plugin architecture swaps in auth backends (htpasswd default, LDAP and others available), storage drivers (S3, Google Cloud Storage), middleware routes, and metadata filters. With official Docker images and a Kubernetes Helm chart, it slots into any pipeline in minutes.
Agent Gateway
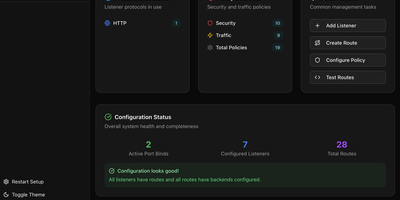
Backed by the Linux Foundation with contributions from AWS, Cisco, IBM, Microsoft, Red Hat, and Shell, Agentgateway is the first data plane built from the ground up for AI agent workloads — providing a unified Rust-based proxy that handles conventional HTTP and gRPC traffic alongside MCP tool servers, A2A agent communication, and LLM inference endpoints through a single deployment. The LLM gateway routes requests to OpenAI, Anthropic, Gemini, AWS Bedrock, and other providers through an OpenAI-compatible unified API with per-tenant budget controls, spend tracking, prompt enrichment, load balancing across multiple model endpoints, and automatic failover when providers experience outages. The MCP gateway federates multiple tool servers behind one endpoint, supporting stdio, HTTP/SSE, and Streamable HTTP transports with built-in OAuth authentication compliant with the MCP auth specification, integrating Auth0 and Keycloak out of the box. OpenAPI integration exposes existing REST APIs as MCP-native tools without code changes, enabling legacy services to participate in agent workflows. Policy-based RBAC controls which agents access which tools, while OpenTelemetry integration provides distributed tracing across agent communication chains. Deploy as a standalone binary with flat YAML configuration or on Kubernetes using the built-in controller with Gateway API support for declarative infrastructure-as-code management. Running on a dedicated VPS on RepoCloud with guaranteed CPU, RAM, and SSD, full root SSH access, and a browser serial console. Apache 2.0 licensed.
UptimeKuma
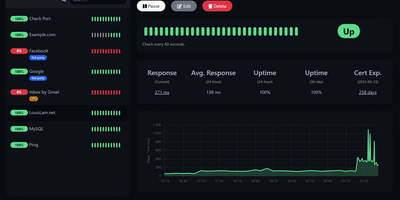
Sixty-thousand-plus GitHub stars make Uptime Kuma the most popular self-hosted monitoring tool - MIT-licensed, Node.js, and the standard replacement for UptimeRobot, Pingdom, and Freshping. It watches a dozen monitor types: HTTP(S) endpoints with keyword and JSON-query content validation, TCP ports, ICMP ping, DNS records, WebSockets, Docker containers via the socket, Steam game servers, MQTT brokers, gRPC services, and push-based heartbeats for cron jobs and internal workers. Checks run at intervals as tight as 20 seconds - versus UptimeRobot's 5-minute free tier - with unlimited monitors and unlimited data retention. When something fails, alerts fan out through 90+ notification channels: Slack, Discord, Telegram, email with LiquidJS templating, PagerDuty, OpsGenie, ntfy, Gotify, Matrix, and dozens more via native providers plus the Apprise library. Unlimited public or password-protected status pages - mappable to specific domains and organized into monitor groups - communicate health to customers, with maintenance windows that suppress alerts during planned work. The reactive dashboard graphs response times, tracks SSL certificate expiry with advance warnings, supports proxies and 2FA, and ships in dozens of languages. One Docker container with a SQLite volume covers an entire infrastructure.
Omnigent
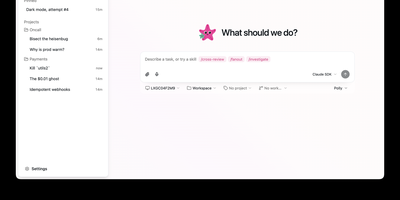
Open-sourced by the Databricks AI team under Apache 2.0 and reaching over 8,500 GitHub stars within two months of launch, Omnigent introduces the meta-harness concept: a common orchestration layer that sits above existing AI coding agents and makes them interoperable parts of a governed, collaborative system. The platform wraps Claude Code, Codex, Cursor, OpenCode, Hermes, Pi, and any custom agent defined in a simple YAML configuration file into sandboxed sessions with a uniform API, then exposes each session through the terminal, a web UI, a native desktop application, mobile interfaces, and a REST API. Built-in multi-agent workflows include Polly, a coding orchestrator that delegates tasks to parallel sub-agents in separate git worktrees and routes each diff to a reviewer from a different vendor, and Deep Research, which plans sub-queries, searches the live web through MCP servers, reads full pages, and cross-checks claims across independent sources. Contextual security policies go beyond static allow/deny rules by maintaining per-session state to enforce spend caps, model routing, approval gates for destructive actions, PII blocking, and repository-scoped write restrictions across server-wide, per-agent, and per-session levels. The OS sandbox restricts filesystem and network access while intercepting egress requests to inject credentials only on approved calls. Cloud sandbox providers including Modal, Daytona, E2B, CoreWeave, Kubernetes, and Databricks launch disposable execution environments per session. Running on a dedicated VPS on RepoCloud with guaranteed CPU, RAM, and SSD, full root SSH access, and a browser serial console. Apache 2.0 licensed.
Gotify
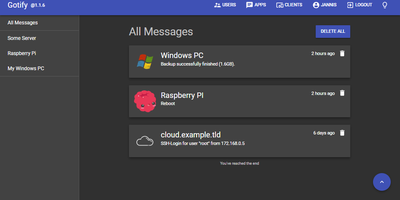
Real-time alerts from your own infrastructure to your phone, with no Firebase, Pushover, or third-party push service in the path: Gotify is a simple, self-hosted notification server written in Go. The model is deliberately minimal: senders push messages with a single HTTP POST to the REST API, receivers subscribe over a WebSocket stream, and a clean React web UI manages the pieces. Senders are namespaced as "applications," each with its own token, so your backup script, Uptime Kuma, CI pipeline, and cron jobs each get an identity, an icon, and independently revocable credentials - centralized alerting from many services with per-source management. Messages carry a title, body, and priority level that maps to notification importance on the client. The official Android app (on both F-Droid and Google Play, notable for working entirely without Google Play Services) shows push notifications for new messages; the web UI itself supports Web Push in the browser; and gotify/cli pushes messages from shell scripts with one command. A server-side plugin system adds custom behavior, and the whole thing runs as a single small binary with SQLite by default - near-zero resource footprint. Because dozens of tools (and Apprise) speak Gotify natively, it slots in as the notification hub for an entire homelab or ops stack.
Backstage
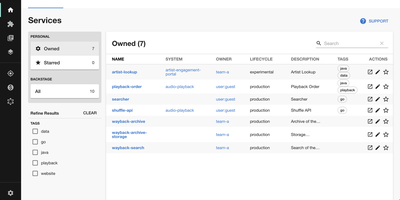
Adopted by over 3,400 companies and backed by 34,000 GitHub stars, Backstage is the open-source developer portal framework created by Spotify and now hosted by the Cloud Native Computing Foundation. The centralized Software Catalog registers every service, library, data pipeline, website, and ML model in your organization using YAML metadata files stored alongside code in GitHub, GitHub Enterprise, or GitLab, tracking ownership, lifecycle status, and dependency relationships across your entire ecosystem. Software Templates provide self-service infrastructure provisioning where developers fill out a form and Backstage automatically scaffolds new repositories, CI/CD pipelines, and cloud resources following your organization's standardized best practices. TechDocs renders Markdown documentation directly alongside the services it describes using a docs-like-code approach powered by MkDocs, with the TechDocs Addon Framework for extending the reading experience. The Search Platform indexes content across the catalog, TechDocs, Confluence, and Stack Overflow through configurable search backends. Kubernetes monitoring built specifically for service owners rather than cluster admins displays pod health, logs, and deployment status across any cloud provider or managed Kubernetes service. The plugin ecosystem includes over 230 open-source integrations covering CI/CD systems like GitHub Actions and GitLab Pipelines, monitoring platforms like Datadog and Grafana, cloud providers including AWS and Azure, plus specialized plugins for security scanning, cost management, API documentation, PagerDuty incident management, and Lighthouse website auditing. Running on a dedicated VPS on RepoCloud with guaranteed CPU, RAM, and SSD, full root SSH access, and a browser serial console. Apache-2.0 licensed.
Graylog
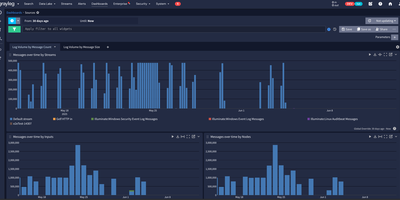
Trusted by over 60,000 organizations worldwide with more than 8,100 GitHub stars since 2010, Graylog has established itself as one of the fastest paths from raw log data to operational visibility, delivering centralized log management, security analytics, and compliance auditing through a purpose-built web interface with sub-second search at scale. The platform ingests logs from virtually any source via syslog, GELF, Beats, raw TCP/UDP, HTTP, CEF, IPFIX, and Netflow protocols, processing each message through configurable pipelines that parse fields, apply transformations, enrich events with GeoIP data from MaxMind or IPinfo lookup tables, and route messages to appropriate streams based on content rules. OpenSearch handles full-text indexing and storage with dynamic shard sizing that automatically calculates appropriate sizes from available node memory, while MongoDB stores configuration metadata including user accounts, roles, dashboards, alert rules, and pipeline definitions. The alerting system integrates with Slack, PagerDuty, and email with customizable notification templates and Replay Search links for immediate investigation context. Version 7.0 introduced MCP server integration for connecting preferred LLMs to perform AI-assisted log analysis and automation, while version 7.1 added Sigma detection rule import from private GitHub, GitLab, and Bitbucket repositories for detection-as-code workflows. The Sidecar agent management system centrally configures and deploys Filebeat, Winlogbeat, and nxlog collectors across infrastructure from the Graylog web interface. Running on a dedicated VPS on RepoCloud with guaranteed CPU, RAM, and SSD, full root SSH access, and a browser serial console. SSPL licensed.
Yopass
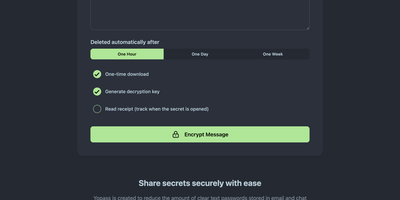
With nearly 3,000 GitHub stars and active development since 2014 through version 14.2.0, Yopass eliminates the universal bad habit of sharing passwords and API keys through Slack messages, email threads, and ticket systems by encrypting secrets entirely in the browser using OpenPGP before anything reaches the server. The Go backend stores only ciphertext — it never sees plaintext — while the React frontend handles all encryption and decryption client-side, generating one-time URLs that self-destruct after a single viewing or when the configured expiration of one hour, one day, or one week passes. File upload support streams encrypted files with configurable size limits, and optional custom password protection adds a second encryption layer beyond the URL-embedded key. The server supports Redis or Memcached as storage backends with automatic key expiration, deploying via Docker Compose in under five minutes or as Kubernetes manifests for production environments. Built-in TLS support works alongside reverse proxy configurations for Nginx, Caddy, and Traefik with automatic Let's Encrypt certificate provisioning. Prometheus metrics expose HTTP request counts, latency histograms, and secret lifecycle counters for Grafana dashboard integration and alerting. Read-only mode enables split-instance deployments separating secret creation from retrieval across different network zones. Multi-language support localizes the interface for international teams. The open-source core under Apache 2.0 provides full self-hosted functionality with no account management required. Running on a dedicated VPS on RepoCloud with guaranteed CPU, RAM, and SSD, full root SSH access, and a browser serial console. Apache-2.0 licensed.
Opengeni
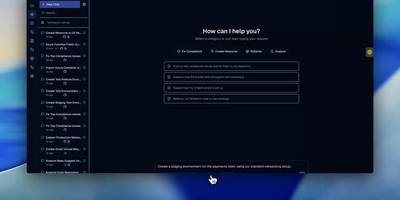
Enterprises requiring production-grade governance for long-running autonomous AI operations can rely on OpenGeni, a self-hosted orchestration platform with human-in-the-loop approvals, Connected Machine execution, and comprehensive audit replays. Operators can configure durable multi-turn workflows that execute continuously toward specified goals without premature termination, automatically pausing when human verification, structured multiple-choice decisions, or critical credential approvals are required. Teams can assign execution workloads across ephemeral cloud sandboxes or route them straight to enrolled Connected Machines to run commands directly against local code repositories without exposing inbound network ports. The integrated web console lets developers inspect live Server-Sent Event activity streams, replay complete turn histories from audit logs, inspect generated artifacts, and cancel or steer in-flight agent tasks on demand. Platform administrators can enforce fine-grained access policies through GitHub App repository bindings, broker temporary role-scoped secrets, and maintain a shared organizational knowledge base where agents propose findings for human review before vector indexing. Running on a dedicated VPS on RepoCloud with guaranteed CPU, RAM, and SSD, full root SSH access, and a browser serial console. Apache-2.0 licensed.
Checkcle
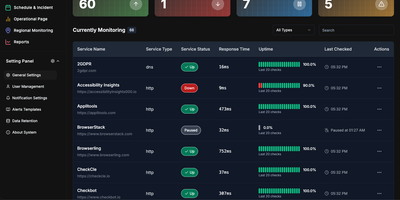
CheckCle provides a complete uptime monitoring and infrastructure observability platform that deploys with a single Docker container and stores all data in embedded SQLite via PocketBase. The Go backend runs three microservices — a service operation engine handling HTTP, HTTPS, DNS, Ping, and TCP checks at configurable intervals, a distributed regional check agent for multi-location network testing, and a server monitoring agent collecting CPU, RAM, disk usage, and network metrics via gRPC. The React frontend built with Vite, TypeScript, Tailwind CSS, and shadcn-ui subscribes to PocketBase WebSocket endpoints for real-time dashboard updates without polling. SSL and domain monitoring tracks certificate issuers, expiration dates, days remaining, and validation status. The incident management system records UP, DOWN, WARNING, and PAUSE states with full history, while scheduled maintenance windows prevent false alerts during planned downtime. Public status pages provide external stakeholders with live service health information. Health heatmaps visualize uptime performance and outage patterns over time. Notification channels include email, Telegram, Discord, and Slack, with multiple alert targets per monitored service. The one-click agent installation script supports Debian, Ubuntu, CentOS, Red Hat, Alpine, and Windows in beta. Docker deployment runs on port 8090 with a single persistent volume at /mnt/pb_data, requiring minimum 1 vCPU and 500MB RAM. On RepoCloud, deploy CheckCle on a dedicated VPS with root SSH access, persistent storage for your monitoring database, and complete control over agent endpoints and notification configurations, all under the MIT license.