Stars
Forks
Watchers
Developer links
MySpeed
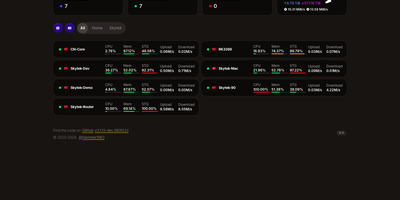
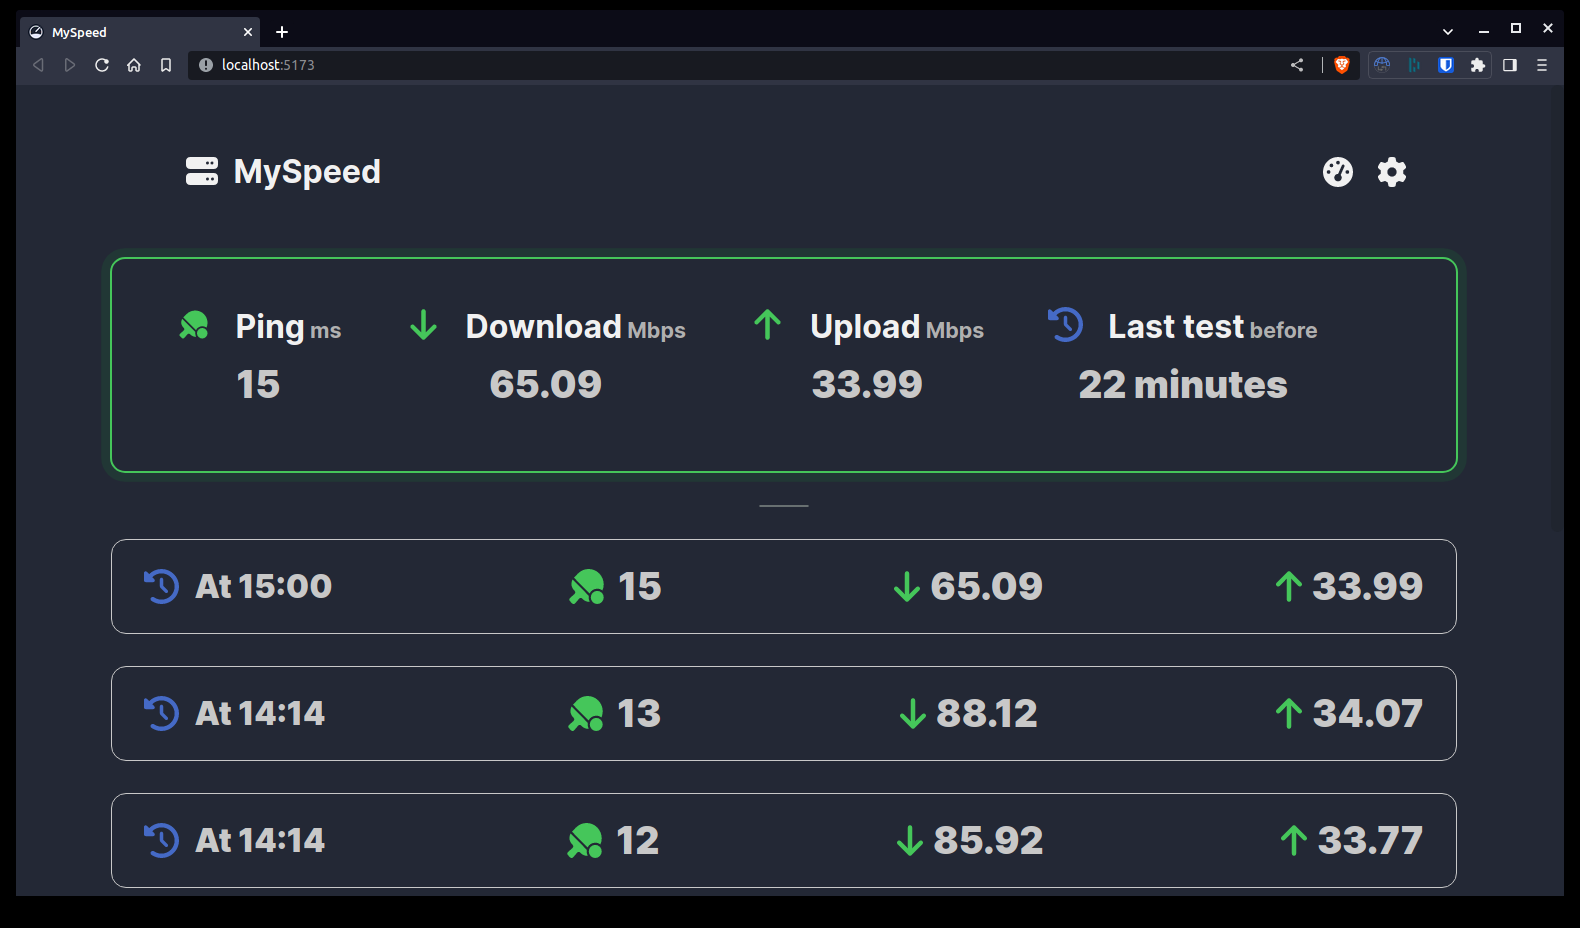
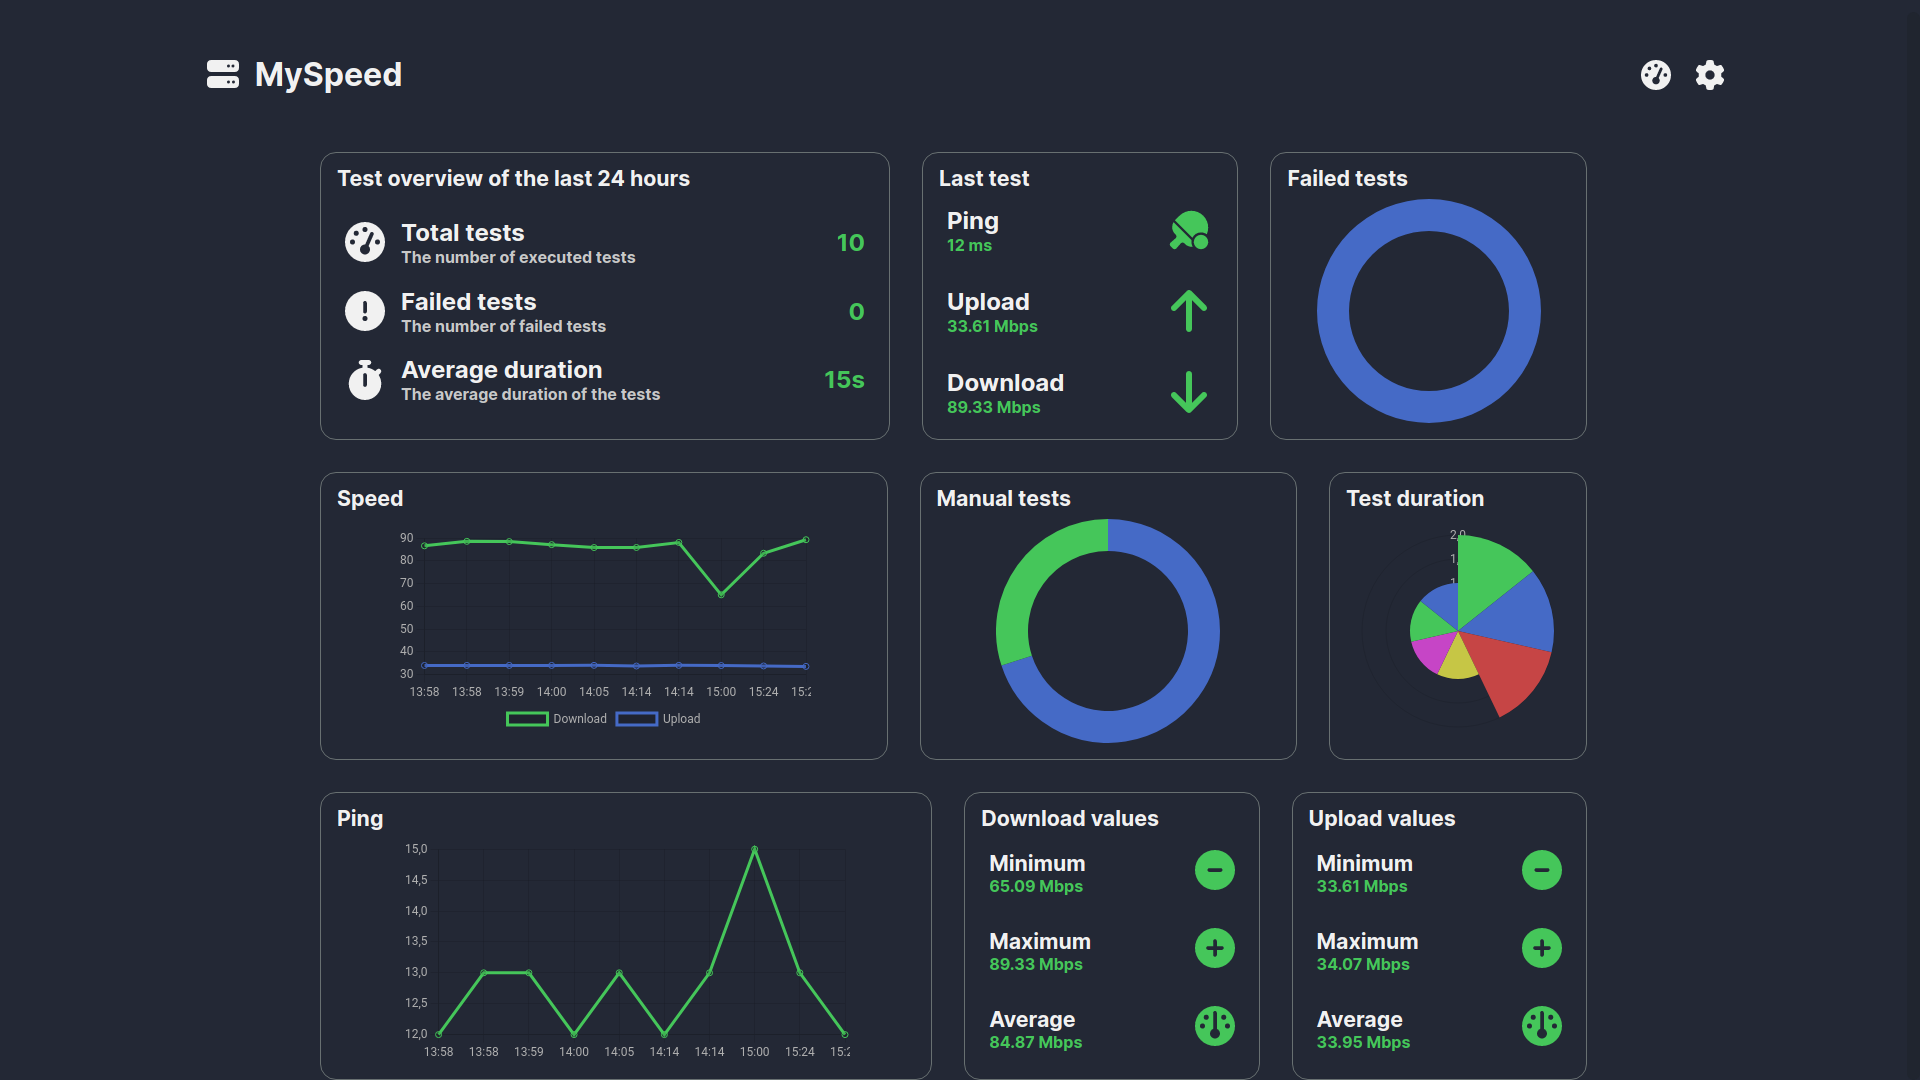
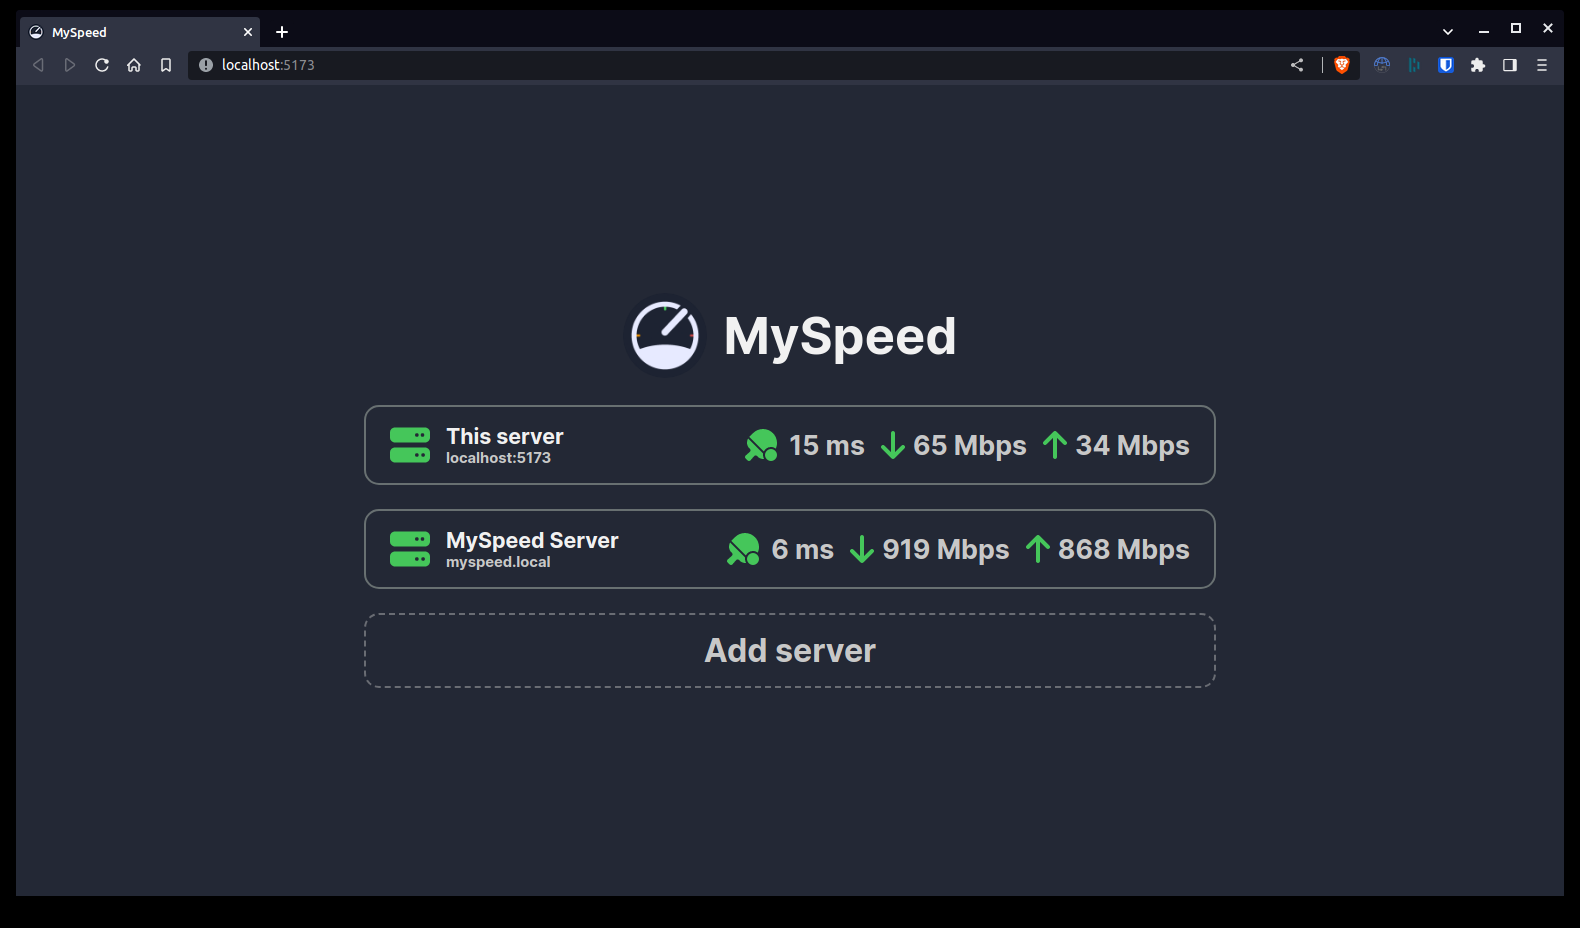
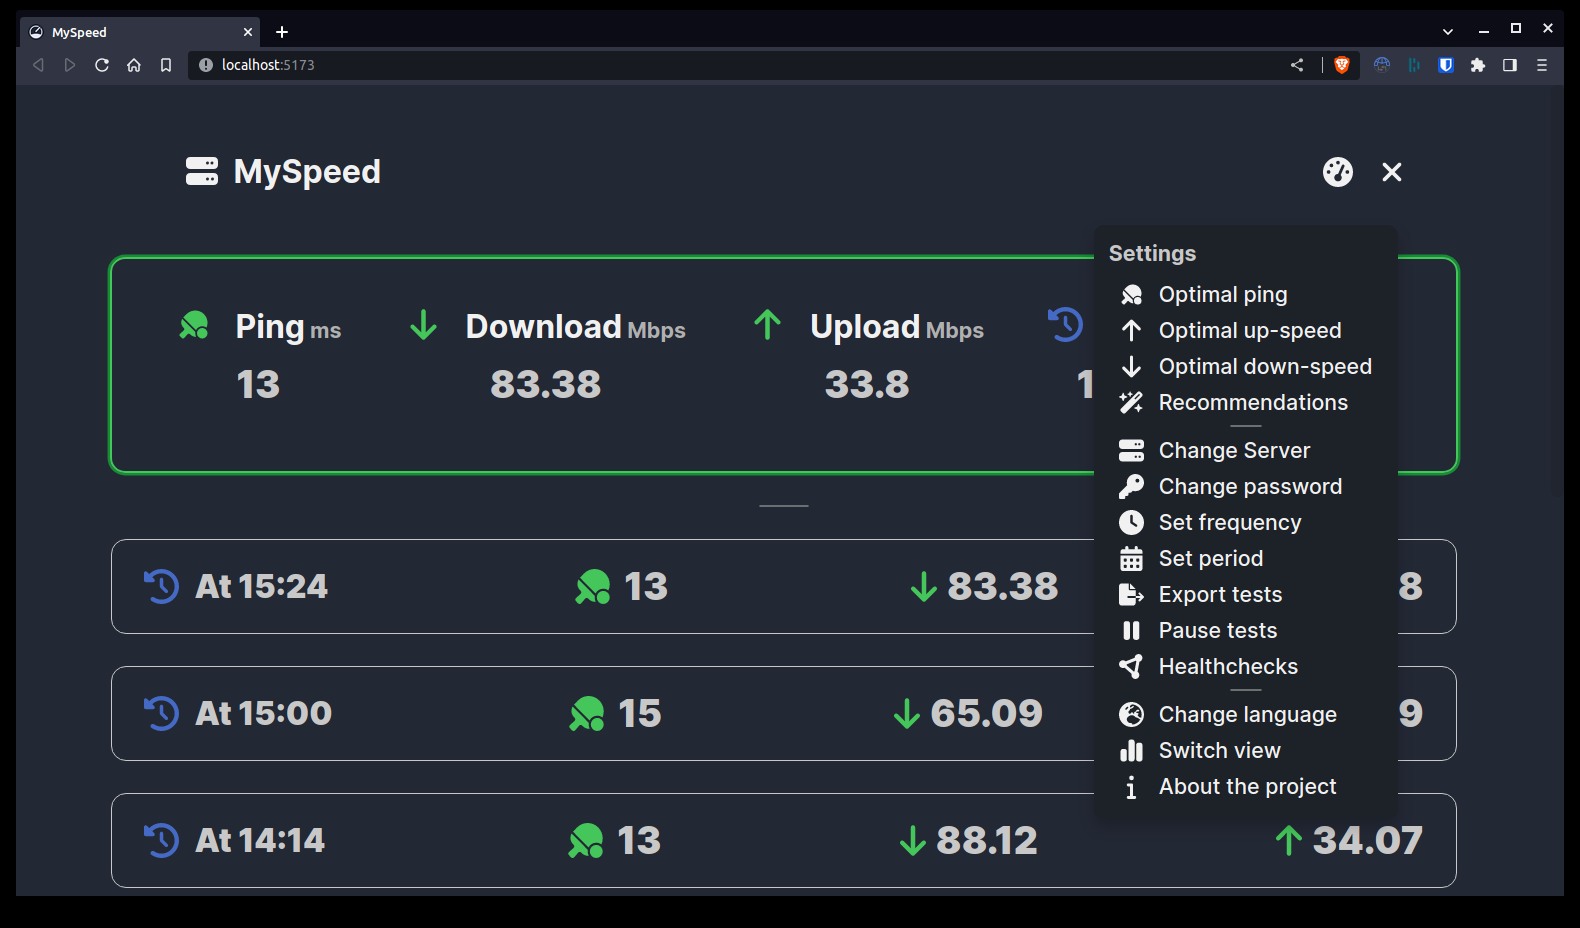
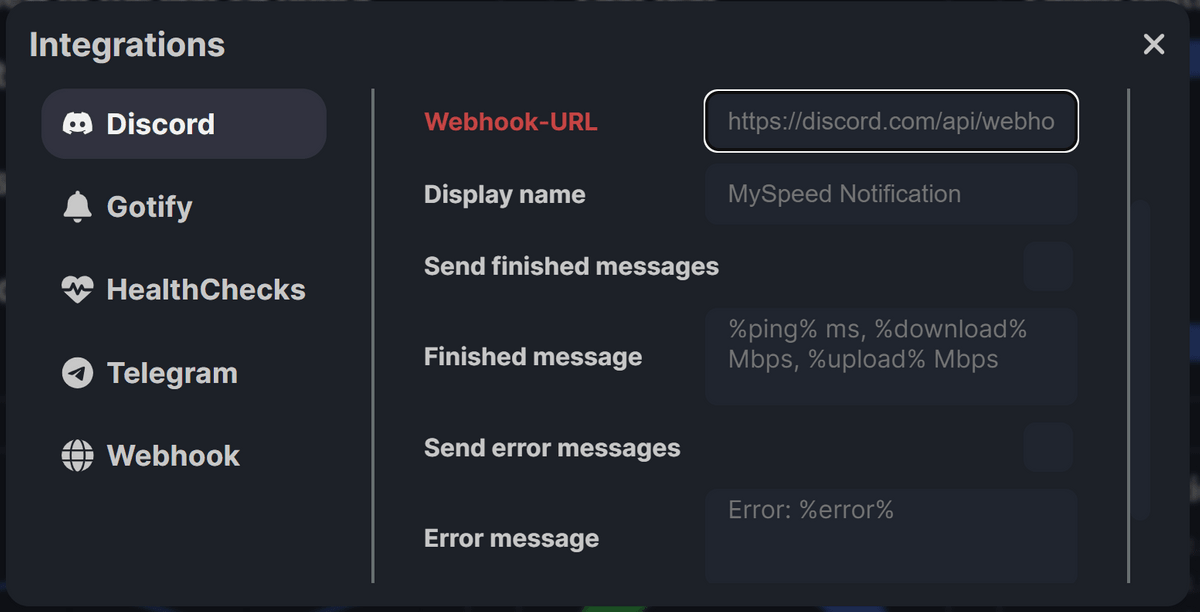
Holding internet service providers accountable for promised bandwidth requires continuous, automated measurement, and MySpeed turns any server into an always-on connection performance analyzer that tracks download speeds, upload throughput, ping latency, and jitter around the clock. Instead of running manual browser tests only when video calls stutter, you can schedule recurring speed checks using custom Cron expressions and switch freely between Ookla, LibreSpeed, and Cloudflare testing servers to verify routing performance across different upstream networks. Interactive statistics views render gradient speed timelines, ping and jitter graphs, hourly performance breakdowns that expose peak-hour congestion, and standard deviation consistency charts, using smart 300-bucket downsampling so multi-month histories load instantaneously. Failed tests are flagged with visual markers on the timeline, while built-in health checks dispatch instant alerts to Discord, Telegram, Signal, WhatsApp, Gotify, email, or custom webhooks whenever bandwidth drops below your target thresholds or outages occur. Administrators can link multiple remote MySpeed instances into a single dashboard to compare bandwidth across branch offices, pause scheduled runs during heavy file transfers, export historical logs, and scrape real-time telemetry into Prometheus and Grafana. Running on a dedicated VPS on RepoCloud with guaranteed CPU, RAM, and SSD, full root SSH access, and a browser serial console. MIT licensed.
Benefits
- Multi-Provider Automated Bandwidth Testing
- Schedule unattended speed measurements via standard Cron expressions across Ookla, LibreSpeed, and Cloudflare test servers, eliminating manual testing while capturing accurate download, upload, ping, and jitter baselines.
- Smart Downsampling for Multi-Month Charts
- Analyze connection stability over 7, 30, 180, or 365 days with 300-bucket time averaging that preserves failed-test markers and peak-hour trends without slowing down browser chart rendering.
- Proactive Downtime and Threshold Alerts
- Trigger automated health-check notifications through Telegram, Discord, Signal, WhatsApp, Gotify, SMTP email, or HTTP webhooks the moment your connection experiences packet loss, failed tests, or degraded throughput.
- Native Prometheus and Multi-Node Monitoring
- Connect multiple remote MySpeed agents into one unified interface and expose a built-in Prometheus metrics endpoint on port 5216 for custom Grafana ISP SLA dashboards.
Features
- Three Speedtest Engines
- Execute bandwidth and latency diagnostics against Ookla Speedtest CLI, LibreSpeed, or Cloudflare test nodes with manual or automatic closest-server selection.
- Cron Test Scheduler
- Configure custom Cron intervals for automated background testing and temporarily pause test execution from the web header during bandwidth-sensitive transfers.
- Hourly Consistency Analytics
- Visualize download, upload, ping, and jitter histories alongside time-of-day hourly averages and standard deviation charts to pinpoint recurring ISP throttling windows.
- Prometheus Metrics Exporter
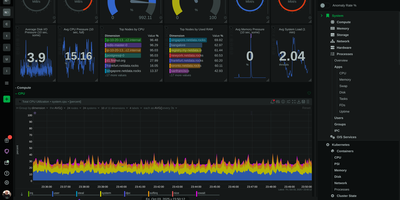
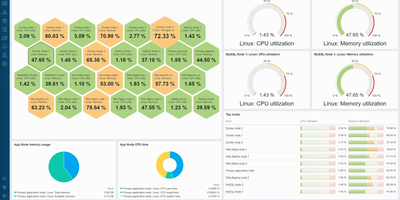
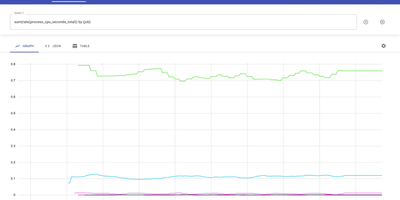
- Scrape real-time speedtest telemetry, latency gauges, and failure counters directly into Prometheus and Grafana for centralized infrastructure observability.
- Configurable Data Retention
- Store historical test records for 7, 30, 90, 180, or 365 days, define custom day limits, or retain records indefinitely with one-click CSV export.