Categories
Self-Hosted DevOps Observability Full-Text Search Log Management OpenTelemetry Distributed TracingStars
Forks
Watchers
Developer links
Rootprint
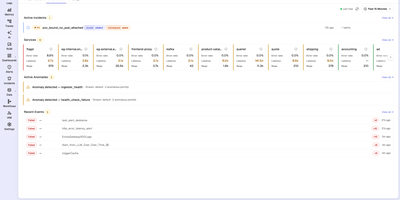
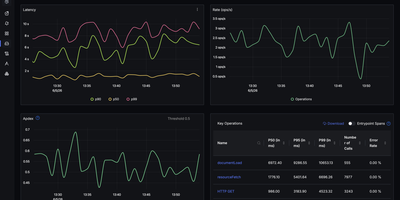
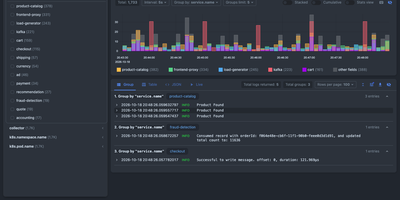
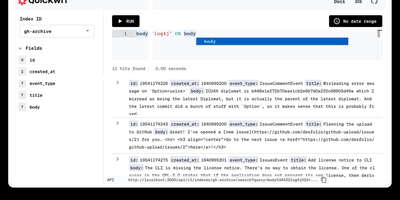
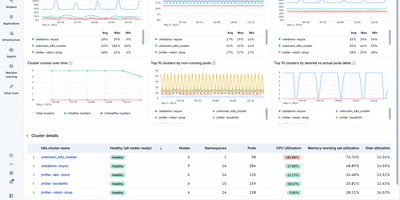
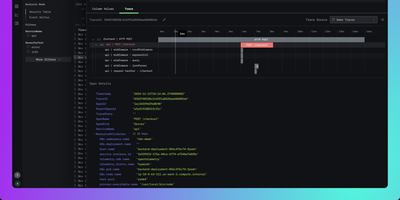
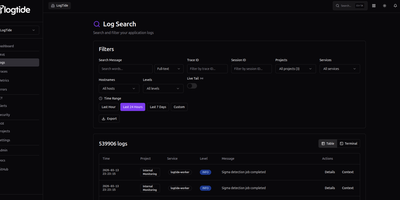
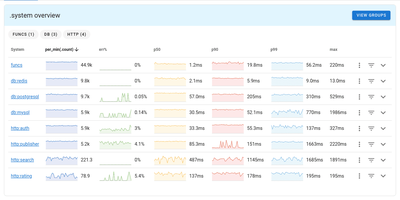
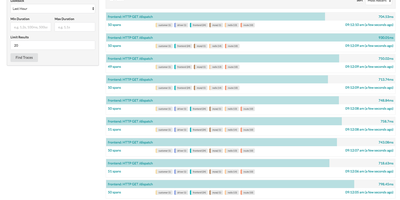
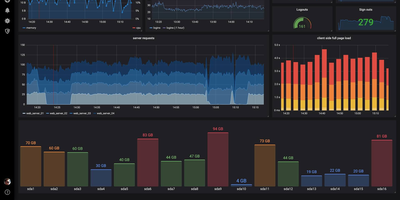
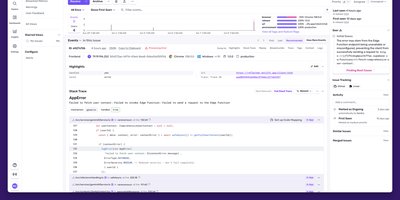
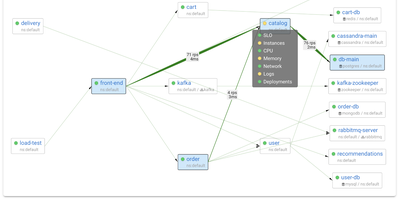
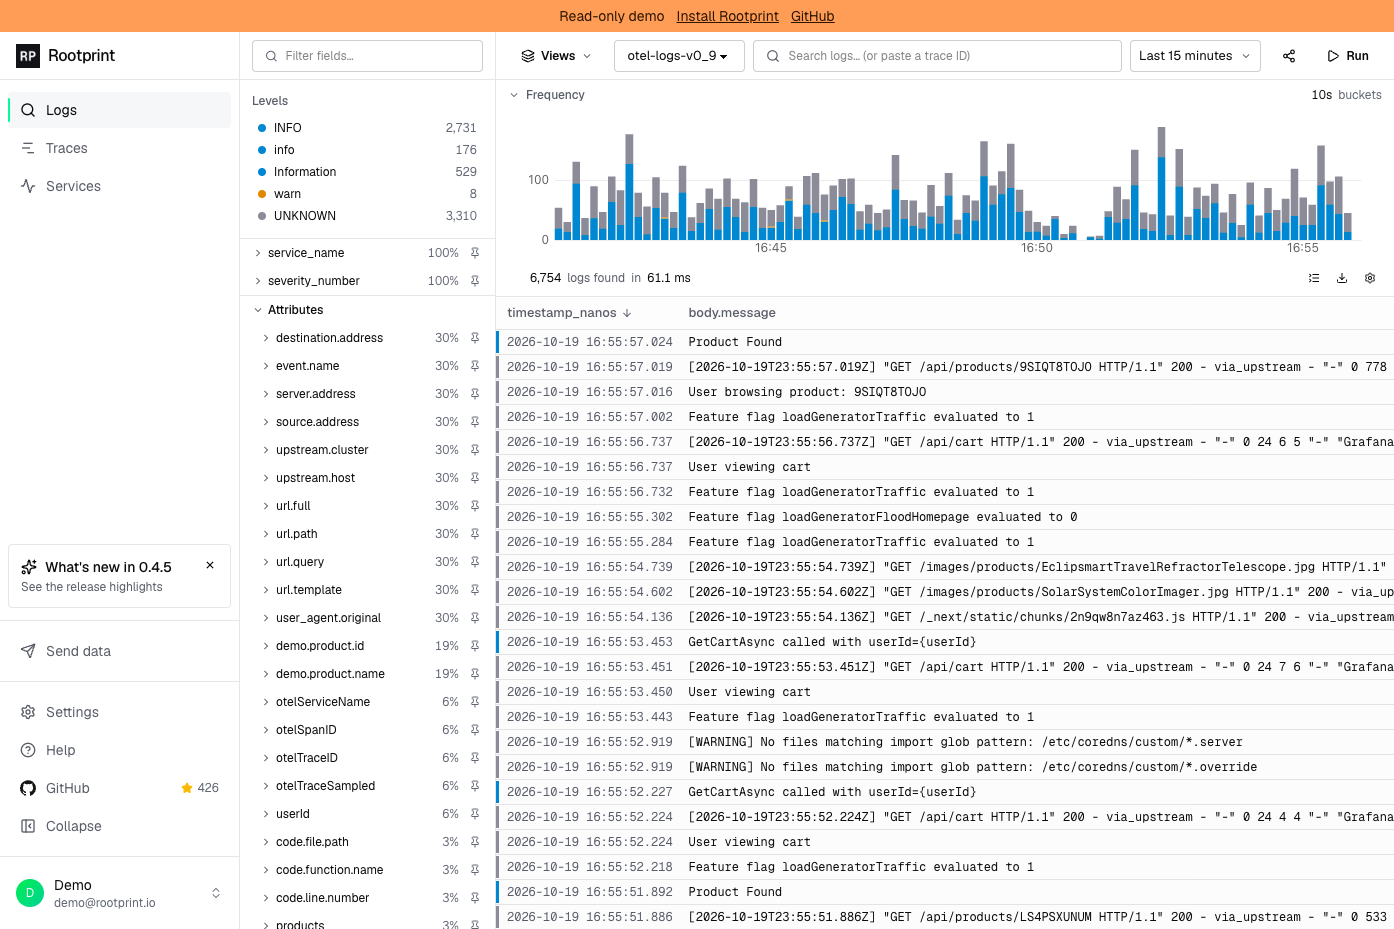
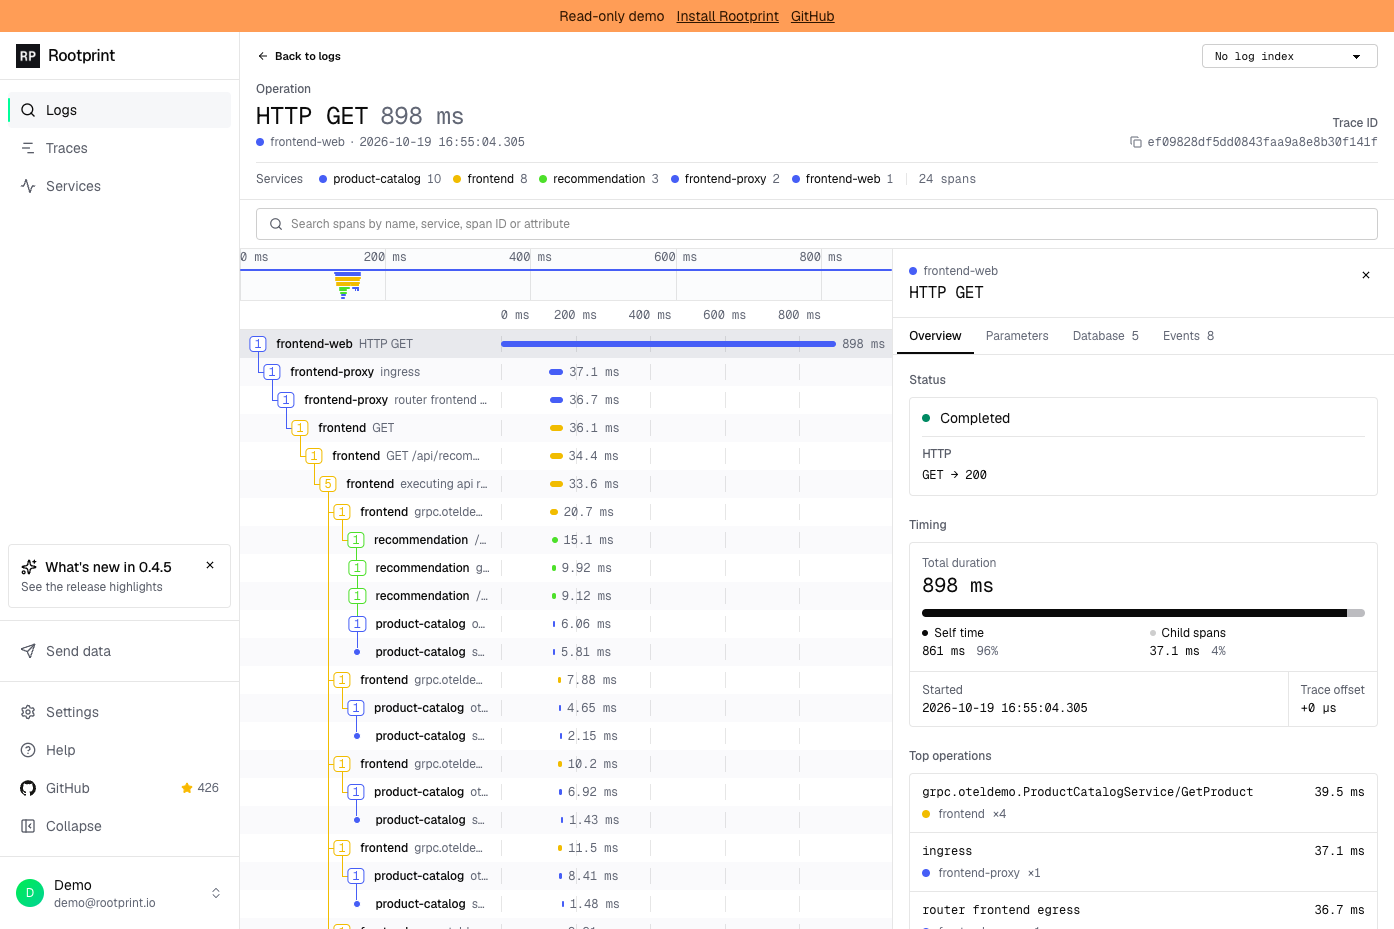
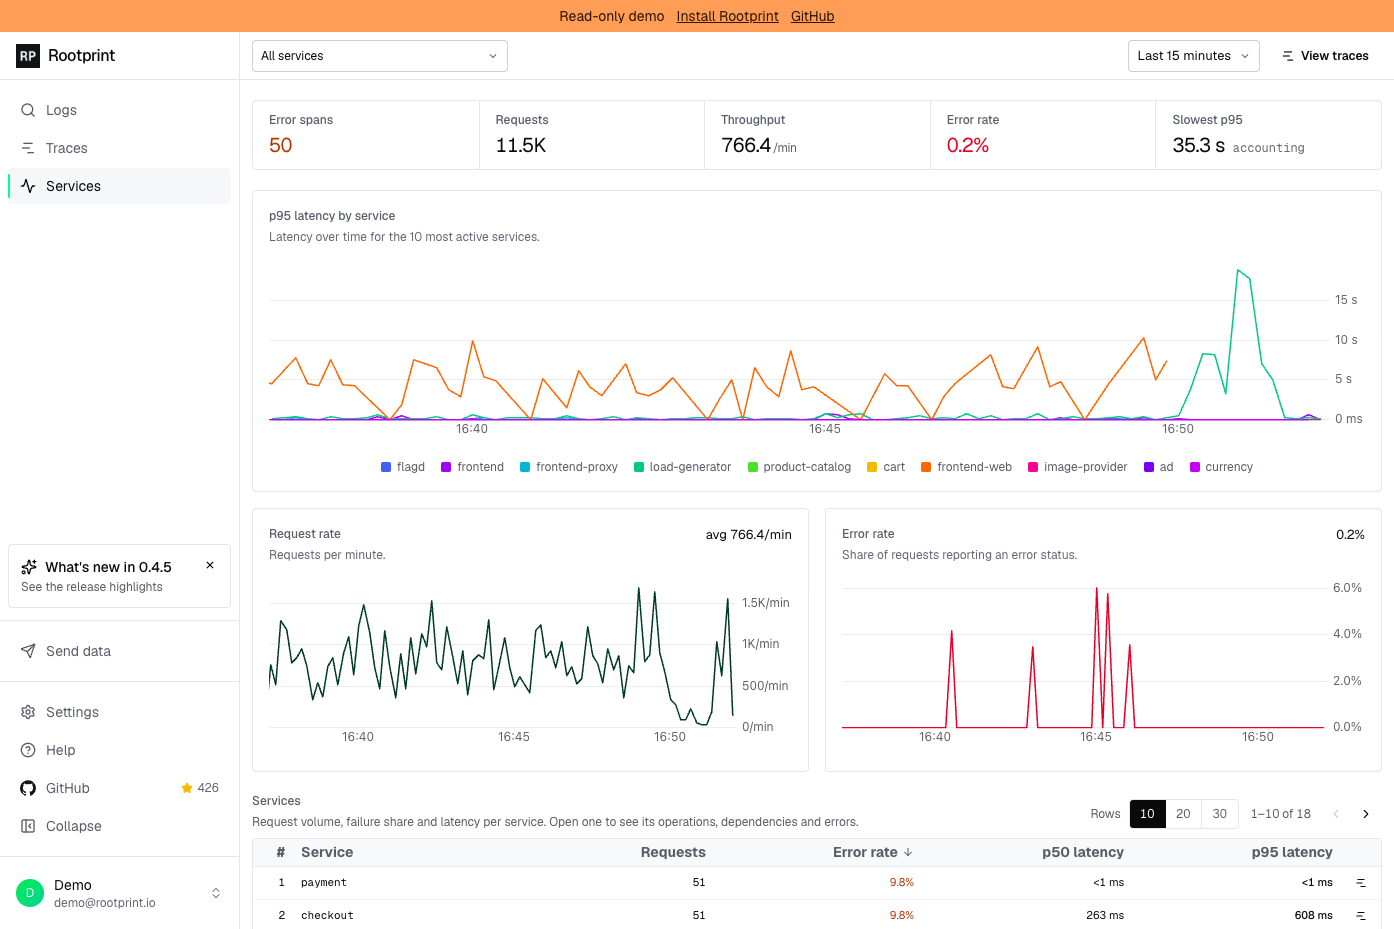
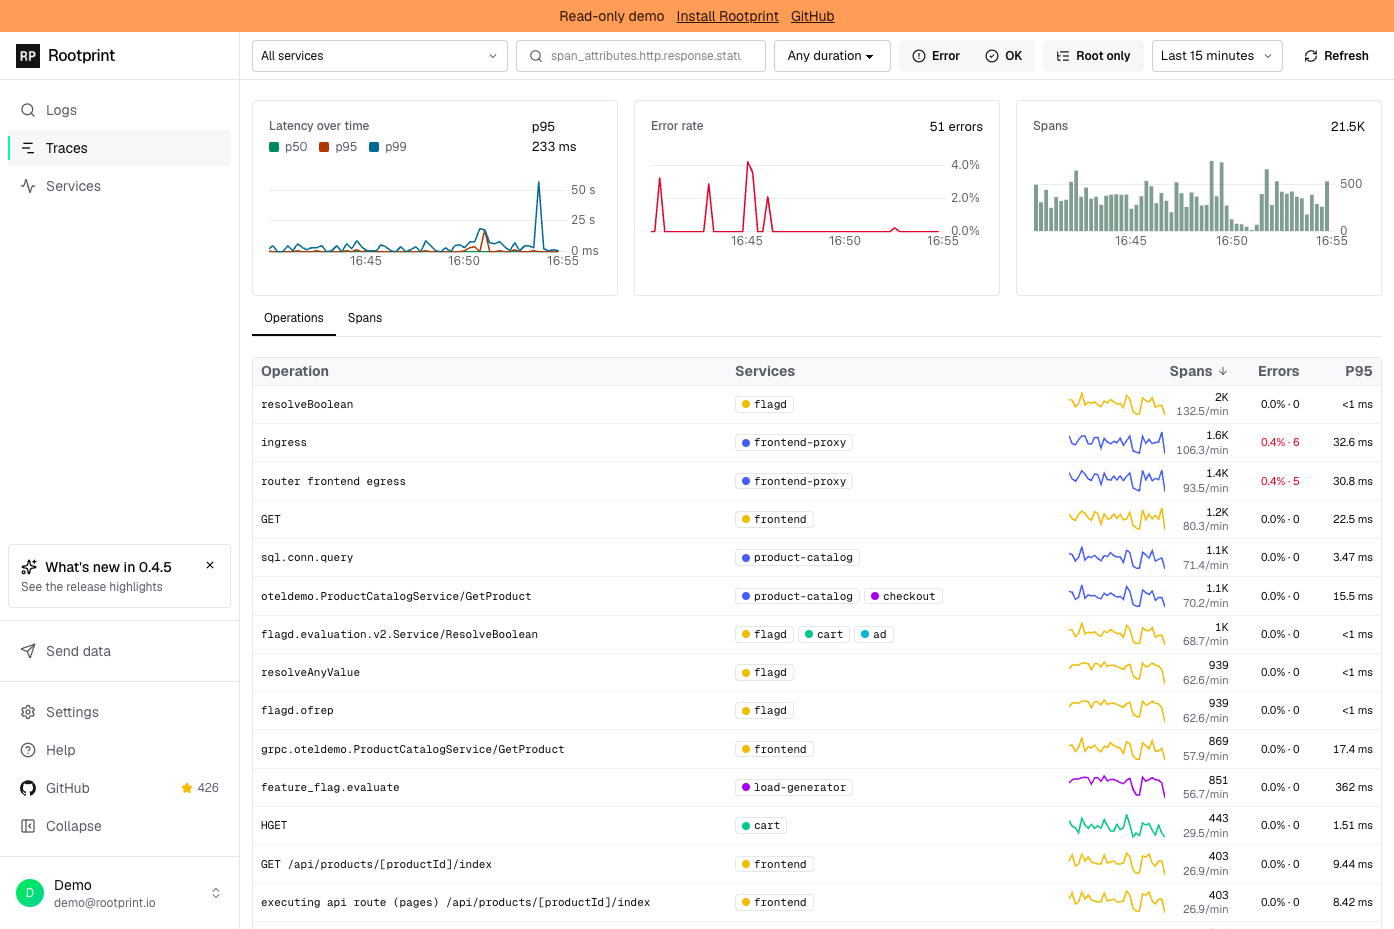
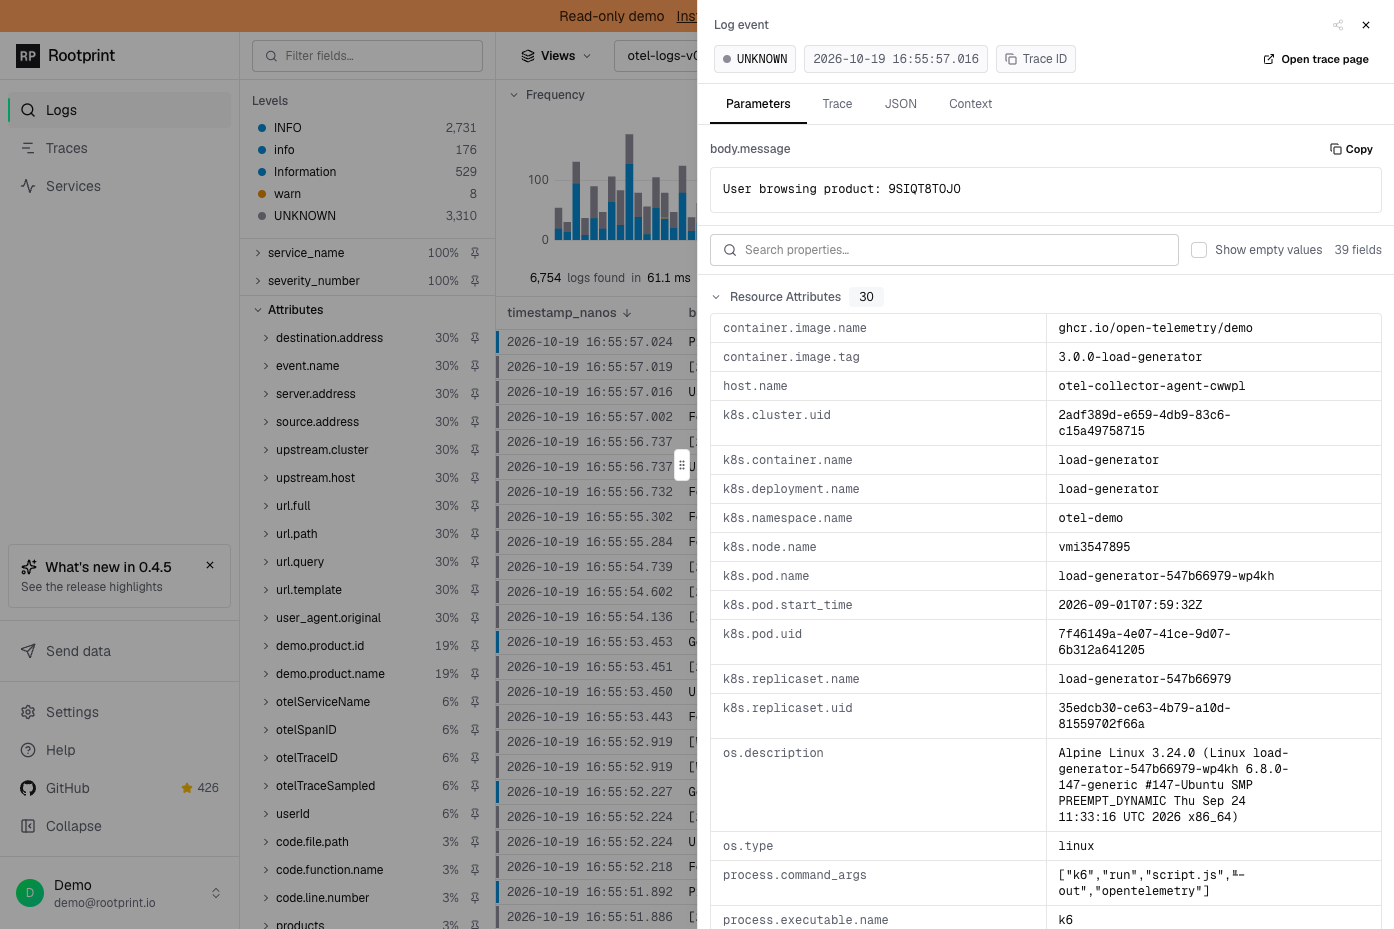
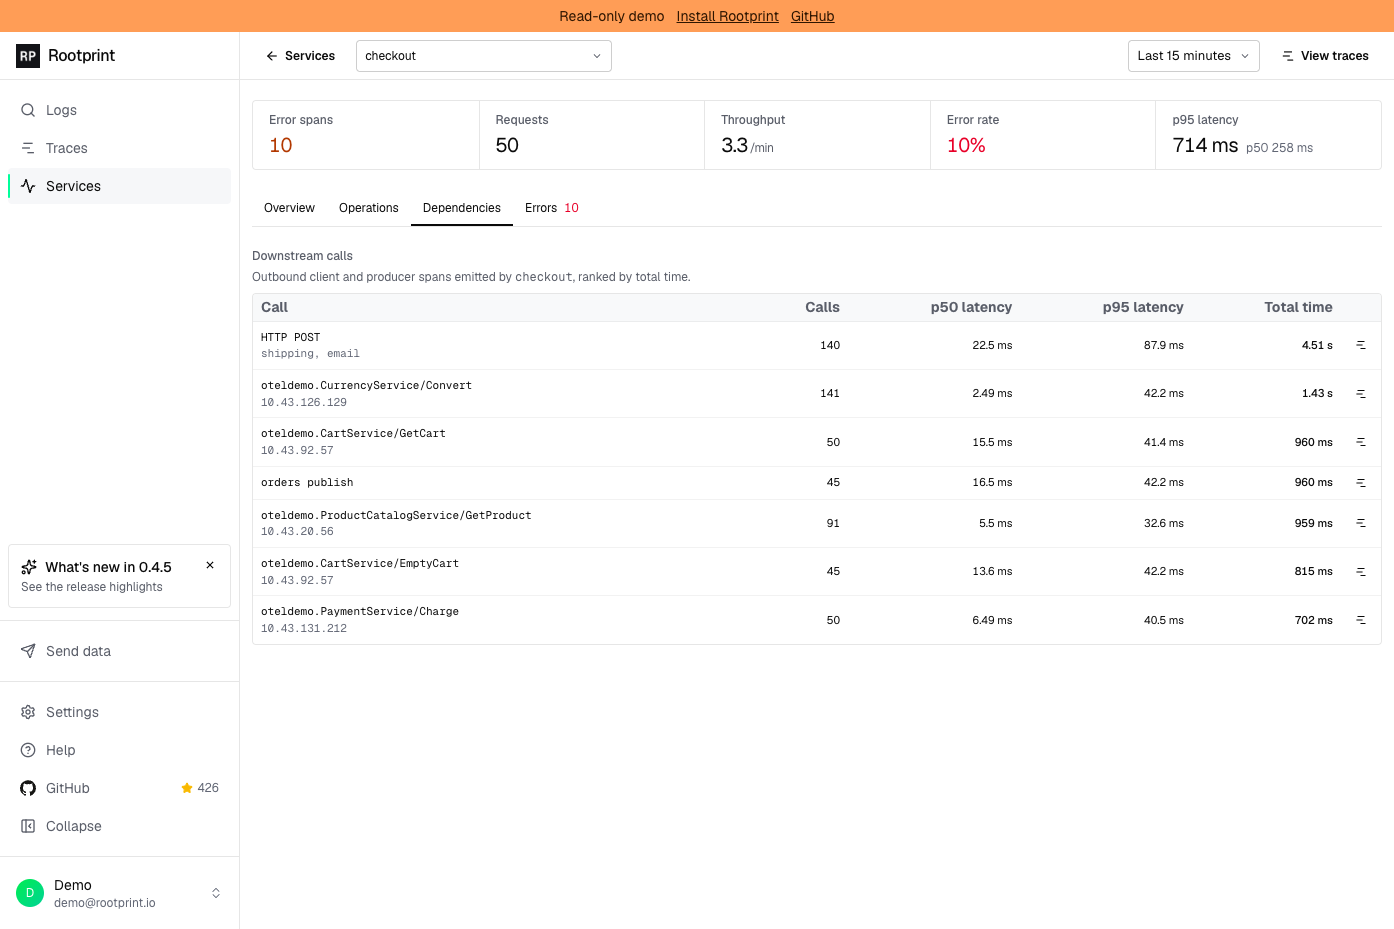
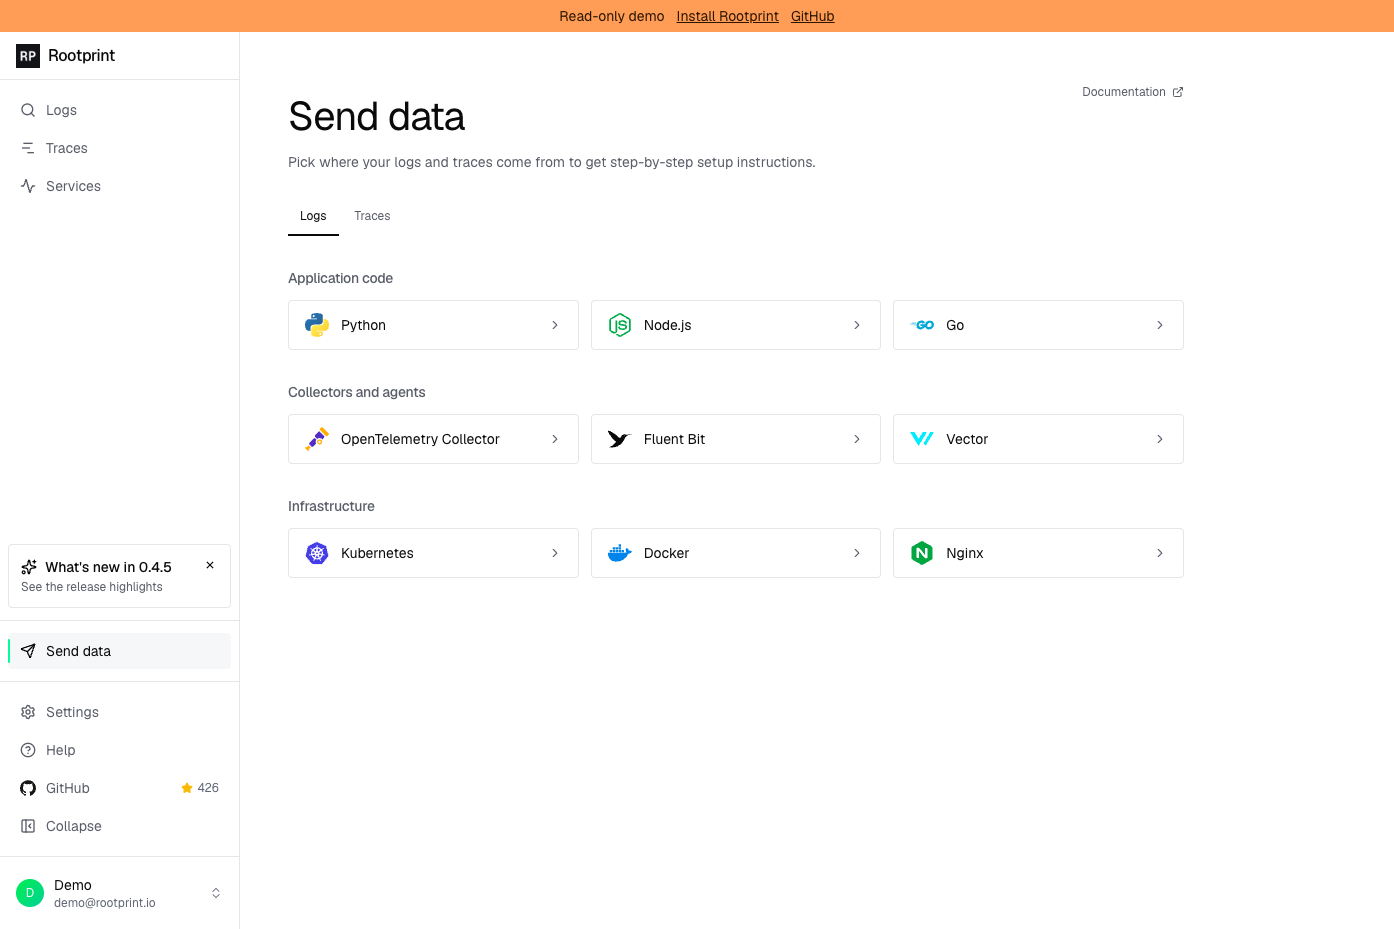
A year of searchable logs and traces no longer needs a metered logging service, because Rootprint keeps the whole index in a storage bucket you already own. A search matches any word on any line, since every log is indexed in full and no service name, stream, or label is needed first. A frequency histogram, one-click field filters, and saved views narrow the results, a fold mode collapses repeated lines, and exports arrive as NDJSON, CSV, or plain text, or as a share link. Open a trace from the log that emitted it, or paste a trace ID, and a waterfall shows per-span timing, attributes, events, and database calls grouped by query, with each span linking back to its logs. The trace explorer charts span volume, error rate, and p50, p95, and p99 latency, ranks the busiest operations, and filters spans by service, duration, and status. Every service gets its own page with request rate, error rate, operations, dependencies, and errors. Data arrives over OpenTelemetry from the Collector, Vector, or Fluent Bit, through a plain HTTP gateway, or by pulling from Kafka, Kinesis, or SQS, with guided setup for nine integrations. Indexes can live in S3, Google Cloud Storage, R2, MinIO, or Azure Blob. Teammates sign in with Google, GitHub, or any OpenID Connect provider, and scoped API keys serve scripts. Running on a dedicated VPS on RepoCloud with guaranteed CPU, RAM, and SSD, full root SSH access, and a browser serial console. Apache-2.0 licensed.
Benefits
- Retention costs only storage
- Indexes live in your own S3, Google Cloud Storage, R2, MinIO, or Azure Blob bucket, so a year of retention costs a year of storage, with no per-gigabyte ingest fees.
- Find any line without labels
- Every word of every log is indexed, so a search works without knowing the service, stream, or label first, and filters, histograms, and saved views narrow the results.
- Jump from a log to its trace
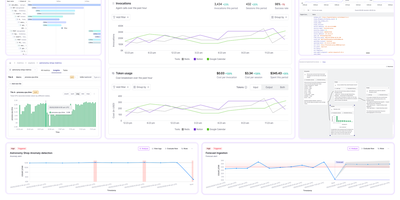
- Open a trace from any log that carries its ID, or paste an ID into search, and a waterfall shows spans, database calls, events, and links back to the logs.
- Self-hosted with team access
- Runs inside your own network with nothing phoning home, deploys as three containers, and adds roles, sign-in through Google, GitHub, or OpenID Connect, and scoped API keys.
Features
- Full-Text Log Search
- Quickwit indexes the full text of every log, with a frequency histogram, one-click field filters with counts, saved views, share links, and NDJSON, CSV, or text export.
- OpenTelemetry Ingestion
- OTLP carries logs and traces from the Collector, Vector, or Fluent Bit, a plain HTTP NDJSON endpoint takes logs, and Kafka, Kinesis, and SQS sources are pulled.
- Trace Explorer and Waterfall
- Chart span volume, error rate, and p50, p95, and p99 latency, then open any trace as a waterfall with per-span attributes, events, and database calls grouped by query.
- Service Health Pages
- Each service gets Overview, Operations, Dependencies, and Errors tabs showing request rate, error rate, and p95 latency, with every row linking to the matching traces.
- Object Storage Backends
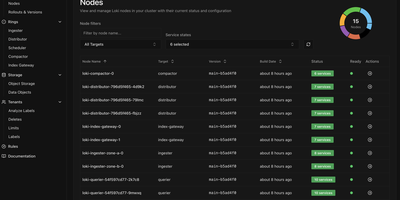
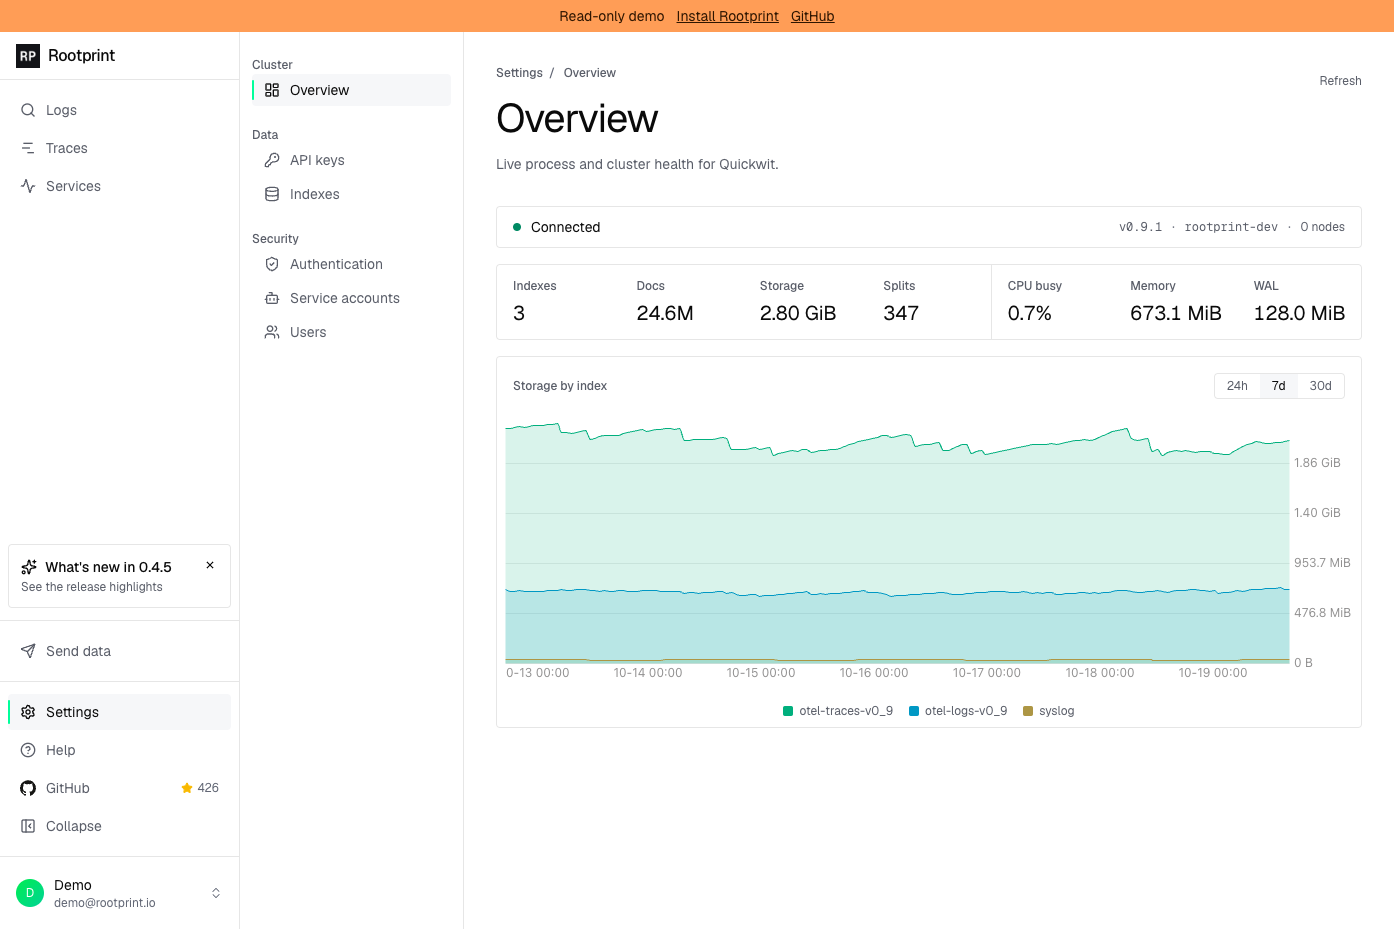
- Indexes live in S3, Google Cloud Storage, Cloudflare R2, MinIO, Ceph, or Azure Blob, and stateless search nodes can be added or removed as load changes.
- Team Access and API Keys
- Invite-based roles, sign-in through Google, GitHub, or OpenID Connect, ingest keys scoped per index, and personal or service-account API keys for read-only log queries.