Glance
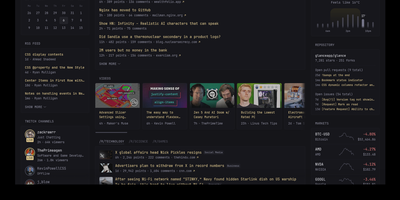
With over 35,000 GitHub stars in just two years, Glance has become the most popular self-hosted dashboard project on GitHub, outpacing established alternatives like Homarr and Homepage. Built as a single Go binary under 20MB with minimal JavaScript and zero external dependencies, Glance delivers a blazing-fast personal information dashboard that consolidates your entire digital morning routine into one beautiful page. Configure everything through clean YAML files that support modular includes and environment variable interpolation, with automatic hot-reload that applies changes without restarting the server. The widget ecosystem covers RSS and Atom feeds, Reddit and Hacker News frontpages, YouTube channel subscriptions, GitHub release timelines, weather forecasts from Open-Meteo, stock market quotes, Docker container status, Twitch live streams, calendar events via iCal, site monitor uptime checks, and custom HTML or iframe embeds. A community widgets repository extends functionality even further with user-contributed integrations. The theming system provides light, dark, and custom color schemes with multiple layout options including slim and wide column configurations. Authentication support added in 2025 secures access with username and password protection. Preconfigured page templates let you get started in seconds with curated layouts for development, homelab monitoring, news reading, and entertainment tracking. Deploy via Docker Compose or as a standalone binary on Linux, macOS, or Windows across AMD64 and ARM64 architectures. Running on a dedicated VPS on RepoCloud with guaranteed CPU, RAM, and SSD, full root SSH access, and a browser serial console. AGPL-3.0 licensed.
HyperDX
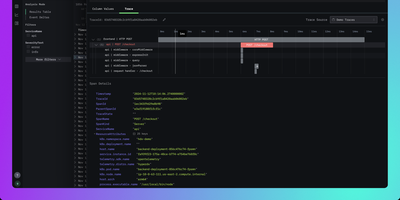
HyperDX correlates logs, metrics, traces, session replays, and errors in a single interface so engineers can resolve production incidents in minutes instead of hours. Nearly 10,000 GitHub stars reflect its role as the integrated UI layer for the ClickStack blueprint endorsed by ClickHouse. The platform connects to any ClickHouse cluster as its storage backend, working with existing table structures without requiring data migration or proprietary ingestion formats. An intuitive Lucene-like search syntax supports full-text queries and property filtering like level:err or service.name:api without needing SQL, while native JSON string querying and event delta analysis surface anomalies in high-cardinality datasets. One-click cross-signal correlation lets you jump from a log line to its distributed trace, from a slow span to associated logs, or from a frontend session replay to the backend errors it triggered. The OpenTelemetry Collector accepts telemetry via OTLP on gRPC port 4317 and HTTP port 4318, supporting automatic instrumentation for Node.js, Python, Java, Go, Ruby, and browser applications. APM tracks HTTP request latency, database query duration, and external service calls with trace waterfall visualizations. Configurable alerts trigger via webhook, Slack, PagerDuty, or email when thresholds are breached. Deploys via Docker Compose with ClickHouse, MongoDB, Redis, and the OpenTelemetry Collector. Running on a dedicated VPS on RepoCloud with guaranteed CPU, RAM, and SSD, full root SSH access, and a browser serial console. MIT licensed.
InfluxDB
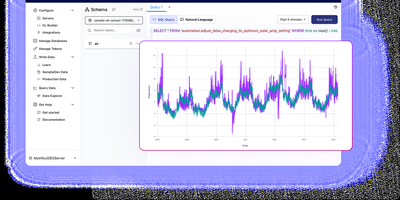
With over 31,600 GitHub stars and thousands of production deployments, InfluxDB 3 Core is the open-source time series database rebuilt in Rust on the FDAP stack — Apache Flight for high-throughput data transfer, DataFusion for vectorized SQL query execution, Arrow for columnar in-memory representation, and Parquet for compressed columnar storage. The engine delivers sub-10ms query response times on recent data and handles millions of writes per second through line protocol ingestion over HTTP, with unlimited tag cardinality eliminating the high-cardinality limitations that plagued earlier InfluxDB versions. The diskless architecture persists data as compressed Parquet files to S3-compatible object storage, Azure Blob, Google Cloud Storage, or local disk with configurable partitioning strategies, while the write-ahead log and in-memory buffer serve real-time queries against recent data before compaction. Native SQL support through DataFusion includes window functions, CTEs, subqueries, and joins, while InfluxQL maintains backward compatibility with existing InfluxDB 1.x and 2.x applications through the same query API. The embedded Python VM enables processing engine plugins and triggers that execute custom logic on write events, perform cross-database queries, and transform data in real time without external tooling. Flight SQL clients provide high-performance query access from Python, Go, Java, and Rust, and the HTTP API supports writes in line protocol format compatible with Telegraf's 300+ input plugins. Running on a dedicated VPS on RepoCloud with guaranteed CPU, RAM, and SSD, full root SSH access, and a browser serial console. MIT/Apache 2.0 dual-licensed.
Grafana Loki
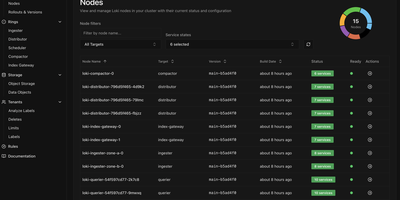
With over 28,600 GitHub stars and 450 contributors, Grafana Loki is the log aggregation system that takes the Prometheus approach to logging — indexing only metadata labels instead of full log content, making it dramatically cheaper and simpler to operate than traditional log management platforms. The label-based indexing strategy groups log streams using the same labels already applied to Prometheus metrics, enabling seamless switching between metrics and logs in Grafana dashboards without maintaining separate indexing infrastructure. Grafana Alloy, the telemetry collector replacing Promtail, scrapes and pushes logs with Prometheus-style service discovery, automatic Kubernetes Pod label extraction, and pipeline stages for parsing, filtering, and relabeling before ingestion. LogQL, the query language, combines label matchers for stream selection with regex line filters and aggregation functions, supporting rate calculations, pattern parsing, and metric generation from log data for alerting and dashboard panels. The storage architecture writes compressed log chunks and TSDB indexes to S3, GCS, Azure Blob Storage, or MinIO-compatible object stores, with configurable retention and compaction policies. Deployment modes scale from a single binary for development through monolithic high-availability mode with multiple replicas to full microservices decomposition with separate ingester, distributor, querier, query-frontend, compactor, and ruler components on Kubernetes via Helm charts. Multi-tenancy isolates data and query paths per tenant through header-based tenant ID assignment. Running on a dedicated VPS on RepoCloud with guaranteed CPU, RAM, and SSD, full root SSH access, and a browser serial console. AGPL-3.0 licensed.
Change Detection
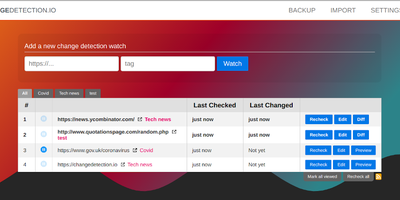
Price drops, restocks, job postings, government announcements, competitor edits - changedetection.io watches web pages and alerts you the moment anything changes, down to PDF text and checksums. Point it at a URL, set a check interval, and precise filters decide what counts as a change: a Visual Selector targets page elements by pointing and clicking, CSS selectors and XPath narrow scope, trigger-text and ignore-text rules (with regex support) cut noise, and JSONPath or jq handles API responses. A dedicated re-stock and price detection mode extracts product metadata and fires on thresholds - alert only when the price drops below your target or the percentage change exceeds a limit. JavaScript-heavy sites render through a real Chrome browser via Playwright, with the ability to execute JS steps first (log in, click, scroll) before extracting text. Notifications reach 85+ services through Apprise - Discord, Slack, Telegram, email, webhooks - optionally with a screenshot of the changed page, and AI-powered summaries (any OpenAI-compatible endpoint, including local Ollama) describe what changed. Per-watch proxies, custom headers, and POST/GET control cover hostile targets. Apache-2.0 licensed with local file-based storage: the URLs you monitor and why stay entirely your business.
Dashy
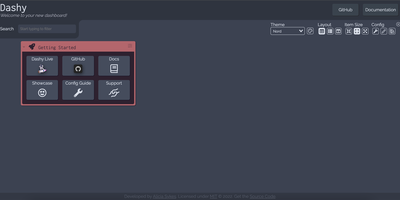
Every service you run, behind one polished start page: Dashy is the most customizable homelab dashboard, built as a Vue.js homepage. Configuration lives in a single YAML file, but you never have to hand-edit it: an integrated UI editor with real-time validation writes changes back to disk, so both config-as-code and point-and-click camps are served. Status indicators put a live health dot next to every app - HTTP checks or pings on custom intervals, with response time and status details on hover - giving you an at-a-glance uptime overview before anything breaks. Over 50 built-in widgets pull dynamic content from the services you already run: Pi-hole and AdGuard block stats, Proxmox lists, Nextcloud status, Netdata CPU/memory history, Prometheus data, plus weather, RSS, crypto prices, and generic iframe/API-response widgets for anything with an endpoint. Instant fuzzy search launches any app as you type, with customizable hotkeys and web-search fallthrough. Theming is deep: dozens of built-in themes, a UI color palette editor, and custom CSS over CSS variables. Alternate views include a fast-loading minimal startpage and a workspace view that embeds apps side-by-side without leaving the dashboard. Icons resolve from Font Awesome, homelab icon packs, emojis, or auto-fetched favicons. Built-in authentication, multi-page support, cloud backup/sync, and multi-language round out an MIT project with a massive community.
Beszel
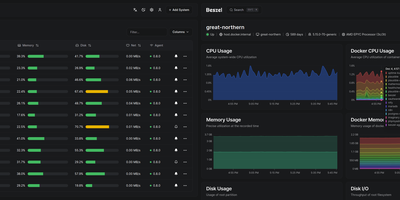
Reaching 24,000 GitHub stars within two years of its first commit in July 2024, Beszel delivers Netdata-grade monitoring dashboards from a single Docker container with no Prometheus stack, no external database, and no complex configuration — just a one-binary hub on PocketBase (SQLite embedded) and a sub-15 MB agent per host that auto-discovers Docker and Podman containers on contact. The agent connects outbound via WebSocket or SSH tunnel, requiring zero open ports on monitored servers and zero manual network configuration. Per-host metrics cover CPU usage, memory with swap and ZFS ARC breakdown, disk I/O across multiple partitions, network throughput, load average, sensor temperatures, battery charge, and GPU utilization with power draw for Nvidia, AMD, and Intel cards — features that competitors lock behind paid tiers. S.M.A.R.T. disk health including eMMC wear indicators and Linux mdraid array status surface hardware degradation before failures occur. Container statistics track CPU, memory, and network history per container with automatic discovery as new containers start. Configurable threshold alerts notify via email, Discord, Telegram, ntfy, Pushover, Gotify, Matrix, Mattermost, Signal, Slack, Microsoft Teams, and Twilio when metrics exceed defined limits. Multi-user accounts with OAuth/OIDC authentication let teams share monitored systems with role-based access, while automatic backups persist data to disk or S3-compatible storage. Running on a dedicated VPS on RepoCloud with guaranteed CPU, RAM, and SSD, full root SSH access, and a browser serial console. MIT licensed.
Headlamp
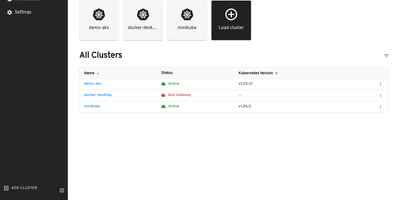
The Kubernetes project's own answer to cluster management UIs: maintained under SIG UI governance, Headlamp's roadmap tracks Kubernetes releases and its design philosophy reflects community needs rather than a vendor's product strategy. The React interface provides full read-write capabilities adapted to each user's RBAC permissions — delete, scale, edit, and restart buttons appear only when the authenticated user holds the corresponding cluster role, preventing accidental unauthorized actions. Multi-cluster support surfaces workloads across development, staging, and production from a single view without context switching. The plugin architecture drives extensibility through a curated catalog: an AI Assistant plugin answers natural-language cluster queries and performs operations via configurable LLM keys, Flux handles GitOps, Karpenter manages nodes. Integrated terminals provide browser-based exec access to running pods, live log streaming follows container output with filtering, and the YAML editor displays inline Kubernetes API documentation alongside resource definitions. Deployment creation forms let you configure containers, environment variables, volumes, and replicas without writing manifests. Side-by-side cluster comparison views surface differences in workload distribution. Works with any distribution: EKS, GKE, AKS, Minikube, Docker Desktop. Helm chart installation via the Headlamp repository with images on GitHub Container Registry. Running on a dedicated VPS on RepoCloud with guaranteed CPU, RAM, and SSD, full root SSH access, and a browser serial console. Apache-2.0 licensed.
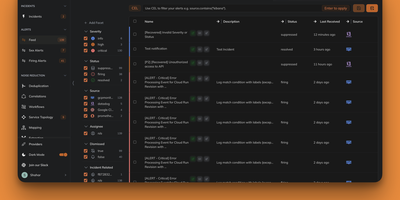
Keep
Keep is an open-source AIOps and alert management platform built with Python FastAPI and Next.js. It provides a single pane of glass for monitoring alerts from 110+ integrations, alert deduplication, correlation, enrichment, and filtering, YAML-based workflow automation similar to GitHub Actions, AI-powered correlation and summarization, and customizable dashboards for incident management. With 12,100+ GitHub stars, Y Combinator backing, and an Elastic partnership, Keep is the open-source AIOps platform that centralizes alert management across your entire monitoring stack into a single customizable dashboard. Alert deduplication identifies duplicate notifications across providers, correlation groups related alerts into incidents based on rules or AI-powered semantic analysis using pluggable LLM backends supporting OpenAI, Anthropic, and local models via Ollama, and enrichment adds context from external sources like CMDBs and databases. Workflow automation follows a GitHub Actions paradigm with declarative YAML files defining triggers, conditions, and actions that can query MySQL, update Jira tickets, send Slack messages, execute Python scripts, or call REST APIs. Authentication supports no-auth, database, Auth0, Keycloak, OAuth2 Proxy, Okta, and OneLogin. The Common Expression Language enables advanced alert querying, slicing, and rule-based grouping to reduce noise. On RepoCloud, deploy Keep on a dedicated VPS with Docker Compose, root SSH access, and complete control over your alert infrastructure, all under the MIT license.
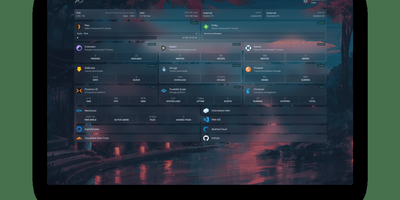
Homepage
With over 31,000 GitHub stars and 430 contributors, Homepage has become the definitive self-hosted dashboard for homelab enthusiasts and server administrators who want a single, elegant landing page for all their services. The dashboard renders as a fully static site at build time for instant page loads, while a Node.js backend securely proxies all API requests to prevent exposing service credentials to the browser. Docker integration automatically discovers running containers through label-based configuration, populating the dashboard with service status indicators, health checks, and real-time statistics without manual URL entry. Over 100 native service widgets display live data from popular applications including Plex, Jellyfin, Radarr, Sonarr, Home Assistant, Pi-hole, Portainer, Proxmox, Nextcloud, Gitea, and dozens more, each showing relevant metrics like active streams, download queues, or system health directly on the dashboard. Information widgets provide weather forecasts, system resource utilization, search bars, and date/time displays. The layout system supports multiple columns, tabs, and custom CSS for pixel-perfect arrangement of service groups and bookmarks. Built-in authentication options include OIDC integration and password protection. Quick search functionality enables instant access to bookmarks and services with keyboard shortcuts. Internationalization covers 40+ languages with community-maintained translations. Configuration lives entirely in YAML files for version-controlled, reproducible dashboard setups. Deploy on a dedicated VPS on RepoCloud with guaranteed CPU, RAM, and SSD, full root SSH access, and a browser serial console for complete control. GPL-3.0 licensed with an active community and bi-weekly releases.
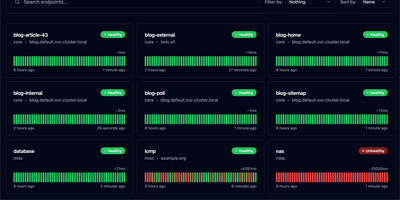
Gatus
With 11,400+ GitHub stars and active development since 2019, Gatus is the developer-oriented status page and health monitoring tool that ships as a single statically-linked Go binary in a scratch Docker image under 20 MB — deploying in seconds while monitoring your entire infrastructure across 12 protocols from a single YAML configuration file. Define health checks for HTTP, ICMP, TCP, DNS, gRPC, WebSocket, SSH, UDP, SCTP, STARTTLS, and TLS endpoints with conditions that go far beyond simple ping: evaluate response status codes, body content with JSONPath expressions, response time thresholds, certificate expiration days, DNS record values, and IP address ranges. Each endpoint supports independent alerting through Slack, Microsoft Teams, PagerDuty, Discord, Telegram, Twilio, Mattermost, Google Chat, email, Gotify, Pushover, and custom webhook providers with configurable failure thresholds and descriptions. The built-in status page displays uptime badges, response time graphs, and incident timelines with maintenance window support for planned downtime communication. External endpoints accept push-based health reports from services behind firewalls. Prometheus metrics export via the /metrics endpoint enables integration with existing observability stacks. OIDC and Basic Authentication protect the dashboard. PostgreSQL persistence stores historical uptime data. The official Helm chart supports Kubernetes deployment with liveness probes and PVC storage, while a community sidecar auto-generates endpoint configurations from Kubernetes Ingress and HTTPRoute resources. Running on a dedicated VPS on RepoCloud with guaranteed CPU, RAM, and SSD, full root SSH access, and a browser serial console. Apache 2.0 licensed.
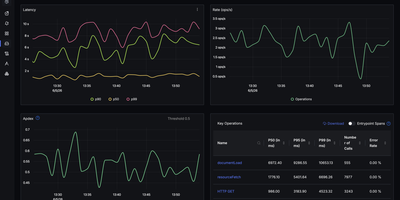
SigNoz
With over 31,000 GitHub stars and native OpenTelemetry support that eliminates vendor lock-in from day one, SigNoz delivers full-stack observability covering metrics, traces, and logs in a single pane of glass without the per-host pricing model of commercial APM platforms. The platform ingests telemetry data through the OpenTelemetry Collector, supporting auto-instrumentation for Java, Python, Node.js, Go, Ruby, PHP, and .NET applications with zero code changes required for basic tracing. ClickHouse serves as the columnar storage backend, providing fast aggregation queries over billions of spans and log lines with configurable retention policies and tiered storage. The distributed tracing view renders flame graphs and Gantt charts showing request flow across microservices with latency breakdowns, error rates, and p99 percentile calculations. Custom dashboards support PromQL and ClickHouse SQL queries with time-series charts, bar graphs, tables, and value widgets. The log management pipeline supports structured and unstructured logs with full-text search, log pipelines for parsing and enrichment, and correlation with traces via trace IDs. Alert rules can be configured on any metric or log query with notification channels including Slack, PagerDuty, OpsGenie, webhooks, and email. The exceptions monitoring module automatically groups and tracks application errors with stack traces, occurrence counts, and first-seen timestamps. Service maps visualize inter-service dependencies with real-time latency and error rate overlays. Running on a dedicated VPS on RepoCloud with guaranteed CPU, RAM, and SSD, full root SSH access, and a browser serial console. MIT licensed with an enterprise edition available.
Wazuh
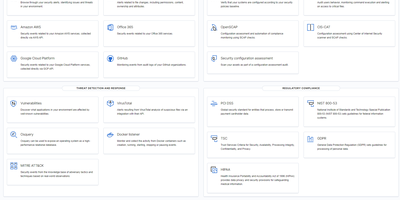
Protecting over 10,000 organizations worldwide with 16,000+ GitHub stars, Wazuh delivers enterprise-grade security operations through a fully open-source platform with zero feature gating. The unified XDR and SIEM solution deploys lightweight agents across Linux, Windows, macOS, Solaris, AIX, and HP-UX endpoints that stream security telemetry to a centralized cluster built on OpenSearch for indexing and the Wazuh Dashboard for visualization and management. Core capabilities include real-time file integrity monitoring with inotify-based detection and who-data attribution, automated vulnerability assessment that correlates software inventories against continuously updated CVE databases, Security Configuration Assessment against CIS benchmarks, rootkit detection, and log data analysis with a rules engine supporting over 3,000 built-in detection rules mapped to MITRE ATT&CK tactics and techniques. Wazuh monitors cloud infrastructure at the API level with native modules for AWS, Azure, and Google Cloud, detects container anomalies through Docker engine integration, and ingests third-party telemetry via syslog and REST APIs from sources like VirusTotal, TheHive, YARA, Suricata, and PagerDuty. Pre-built compliance dashboards and reports cover PCI DSS, HIPAA, NIST 800-53, GDPR, and TSC frameworks. Active response capabilities automatically trigger countermeasures including firewall rule updates, account lockouts, and endpoint isolation when threats are detected. The platform scales horizontally with multi-node clustering for high availability. Running on a dedicated VPS on RepoCloud with guaranteed CPU, RAM, and SSD, full root SSH access, and a browser serial console. GPL-2.0 licensed.
Sentry
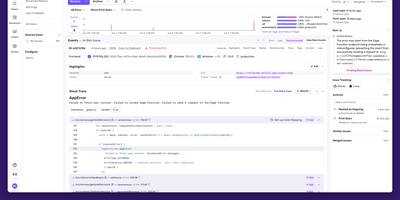
Backed by 44,000 GitHub stars and trusted by over four million developers, Sentry is the debugging platform that captures errors, traces, replays, profiles, and metrics from your applications and connects them all through distributed tracing. The error tracking engine captures full stack traces with source context, breadcrumbs, and automatic demangling for native crashes, while intelligent grouping consolidates duplicate events into actionable issues with regression detection and automatic assignment. Performance monitoring instruments your frameworks automatically, capturing every database query, API call, cache hit, and queue operation as spans within distributed traces that flow across frontend, backend, and mobile boundaries. Session Replay produces video-like recordings of real user sessions showing DOM interactions, network requests, console messages, and errors on a synchronized timeline, with AI-powered summaries that describe what happened without watching the full replay. Continuous profiling captures CPU execution data at the function and line level for Node.js, Python, iOS, and Android, linking slow spans directly to the exact code responsible. Cron monitoring tracks scheduled jobs for failures, missed runs, and duration anomalies. The alerting engine fires notifications through Slack, PagerDuty, Opsgenie, and webhooks on new issues, regressions, error spikes, or when latency and crash-free session rate thresholds are crossed. Self-hosted deployment runs as a Docker Compose stack with PostgreSQL, ClickHouse, Kafka, Redis, and Relay. Running on a dedicated VPS on RepoCloud with guaranteed CPU, RAM, and SSD, full root SSH access, and a browser serial console. FSL licensed.
QuestDB
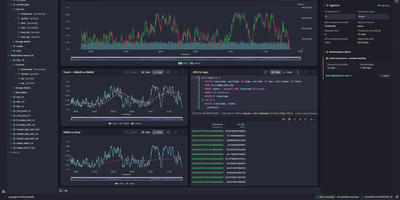
Powering trading floors at firms processing millions of market data events per second and trusted by organizations including Airbus, Yahoo, and Copenhagen Atomics, QuestDB has earned over 17,000 GitHub stars as the time-series database that refuses to make you choose between ingestion speed and query latency. The column-oriented, time-partitioned storage engine processes millions of rows per second on ingest through write-ahead logging with instant durability, while SIMD-accelerated parallel execution returns analytical queries over billions of rows in milliseconds. Time-series SQL extensions add ASOF JOIN for point-in-time lookups across tables with misaligned timestamps, SAMPLE BY for downsampling at arbitrary time intervals, LATEST ON for last-value queries, and WINDOW JOIN for sliding window aggregations — all through standard SQL syntax accessible via the PostgreSQL wire protocol, REST API, or the QuestDB Wire Protocol (QWP) that streams Apache Arrow at 220 million rows per second. Multi-tier storage automatically moves data from the WAL through native columnar format to Parquet files on S3-compatible object storage, keeping hot data fast and cold data portable without manual tiering. The built-in web console provides an interactive SQL editor with syntax highlighting, autocomplete, and charting for quick data exploration. Views, materialized views, and n-dimensional arrays support real-time analytics, while native Parquet export enables direct integration with Python, DuckDB, and AI/ML frameworks. Running on a dedicated VPS on RepoCloud with guaranteed CPU, RAM, and SSD, full root SSH access, and a browser serial console. Apache 2.0 licensed.
Zabbix
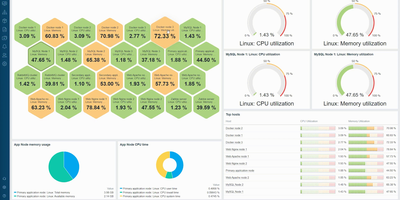
Monitoring everything from network switches to Kubernetes clusters since 2001 with over 6,200 GitHub stars and deployments exceeding 100,000 devices per installation, Zabbix has established itself as one of the most mature and feature-rich open-source monitoring platforms available, trusted by organizations including Dell, Salesforce, ICANN, and T-Mobile. The platform collects metrics from virtually any source using Zabbix Agent written in C, Zabbix Agent 2 written in Go with native plugin support, SNMP v1/v2c/v3 polling and trapping, IPMI for hardware health, JMX for Java applications, SSH and Telnet checks, HTTP/HTTPS polling, and ODBC database queries. Version 7.0 LTS introduced synthetic browser monitoring that executes user-defined JavaScript via WebDriver to simulate multi-step user interactions on websites, proxy load balancing with automatic host redistribution across proxy groups for high availability, in-memory proxy data buffering delivering up to 100x performance improvement, native multi-factor authentication with TOTP and Duo support, and just-in-time user provisioning from SAML and LDAP. Low-level discovery automatically detects file systems, network interfaces, SNMP OIDs, VMware resources, and Kubernetes pods, creating monitoring items and triggers dynamically. The alerting engine correlates events with configurable escalation chains, sending notifications through Slack, Microsoft Teams, PagerDuty, Jira, email, and SMS with customizable message templates. Over 1,000 official templates provide instant monitoring for Linux, Windows, VMware, AWS, Azure, Docker, PostgreSQL, MySQL, Apache, Nginx, and hundreds more. Running on a dedicated VPS on RepoCloud with guaranteed CPU, RAM, and SSD, full root SSH access, and a browser serial console. AGPL-3.0 licensed.
LogTide
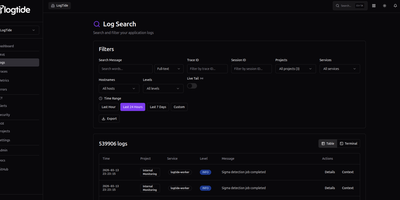
Every production incident starts the same way: someone asks "what do the logs say?" and the answer takes 45 minutes to find. LogTide collapses that search into seconds with a unified observability platform that indexes logs, traces, and metrics into a single queryable interface, backed by your choice of TimescaleDB, ClickHouse, or MongoDB. The log search interface supports full-text queries across millions of entries with filters for trace ID, session ID, project, service, hostname, and severity level, plus a live tail mode that streams new log lines as they arrive. Distributed traces render as waterfall timelines showing every span, its duration, and cross-service dependencies, while correlated logs for each trace are one click away. The metrics explorer visualizes OTLP gauge and counter data from your applications with system CPU, memory, disk, and network panels that update in near real-time. Where LogTide diverges from standard observability is its built-in SIEM engine: Sigma-compatible detection rules scan incoming logs for security threats like SQL injection, privilege escalation, lateral movement, and C2 communication, surfacing findings on a dedicated security dashboard with severity distribution, detection timelines, and affected service breakdowns. Alerting pushes notifications to Email, Slack, or Discord webhooks when thresholds trip or security rules fire. Native SDKs for Node.js, Python, Go, PHP, Kotlin, and Ruby ship logs with retry logic and circuit breakers, and the platform accepts OpenTelemetry data natively. Running on a dedicated VPS on RepoCloud with guaranteed CPU, RAM, and SSD, full root SSH access, and a browser serial console. AGPL-3.0 licensed.
CPA Manager Plus
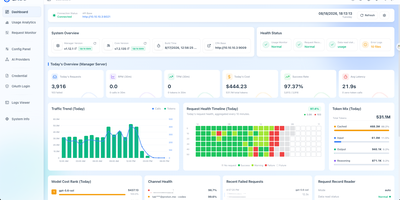
CPA Manager Plus is a self-hosted observability dashboard and management panel that tracks every AI request flowing through your CLI Proxy API gateway, breaking down failures, costs, and account health across providers like OpenAI, Anthropic, xAI, and Codex in one interface. When a request fails, drill into the persistent history to see status codes, affected models, latency, and redacted failure evidence without exposing raw response bodies. The cost analytics engine breaks down token consumption and estimated spend by model, provider, account, API key, project, channel, and time range while tracking input, output, reasoning, cache, and service-tier pricing semantics separately. Model prices sync automatically from models.dev with LiteLLM and OpenRouter fallbacks, and you can add local overrides for aliases or internal models. For teams running Codex or xAI accounts, the health inspector reads quota windows, reset evidence, credential state, and workspace status on a configurable schedule, routing credential failures into an action queue for review rather than letting them silently degrade throughput. Deploy the Lightweight Panel to replace your existing CPA management UI without adding another service, or run Full Mode as a single Docker container that adds the Manager Server with persistent SQLite storage for request history, historical analytics, and automated account inspections. Export or import request history as JSONL for external analysis, and back up the SQLite files alongside your encrypted management keys. Running on a dedicated VPS on RepoCloud with guaranteed CPU, RAM, and SSD, full root SSH access, and a browser serial console. MIT licensed.