Beszel
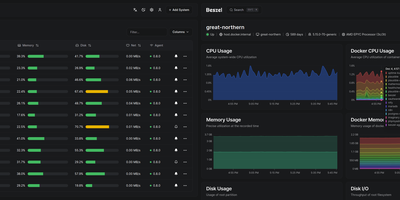
Reaching 24,000 GitHub stars within two years of its first commit in July 2024, Beszel delivers Netdata-grade monitoring dashboards from a single Docker container with no Prometheus stack, no external database, and no complex configuration — just a one-binary hub on PocketBase (SQLite embedded) and a sub-15 MB agent per host that auto-discovers Docker and Podman containers on contact. The agent connects outbound via WebSocket or SSH tunnel, requiring zero open ports on monitored servers and zero manual network configuration. Per-host metrics cover CPU usage, memory with swap and ZFS ARC breakdown, disk I/O across multiple partitions, network throughput, load average, sensor temperatures, battery charge, and GPU utilization with power draw for Nvidia, AMD, and Intel cards — features that competitors lock behind paid tiers. S.M.A.R.T. disk health including eMMC wear indicators and Linux mdraid array status surface hardware degradation before failures occur. Container statistics track CPU, memory, and network history per container with automatic discovery as new containers start. Configurable threshold alerts notify via email, Discord, Telegram, ntfy, Pushover, Gotify, Matrix, Mattermost, Signal, Slack, Microsoft Teams, and Twilio when metrics exceed defined limits. Multi-user accounts with OAuth/OIDC authentication let teams share monitored systems with role-based access, while automatic backups persist data to disk or S3-compatible storage. Running on a dedicated VPS on RepoCloud with guaranteed CPU, RAM, and SSD, full root SSH access, and a browser serial console. MIT licensed.
Dagster
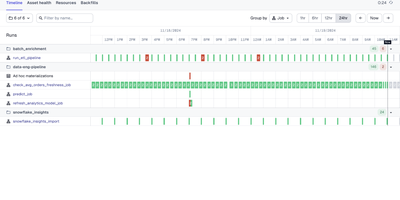
With nearly 16,000 GitHub stars, 5.7 million monthly PyPI downloads, and 400+ contributors, Dagster is the most widely adopted asset-centric data orchestration platform — replacing task-oriented schedulers like Apache Airflow with a declarative model where every pipeline is defined as Python functions producing data assets such as tables, datasets, machine learning models, and reports. The built-in asset graph provides automatic lineage tracking across your entire data platform, showing exactly how data flows from ingestion through transformation to downstream consumption in a single unified view. Declarative Automation goes beyond cron scheduling with event-driven conditions that intelligently trigger materializations based on upstream freshness, data quality signals, and dependency state. The integrated data catalog auto-generates documentation from asset metadata, ensuring it never drifts out of sync with production. Native first-class integrations connect dbt, Snowflake, BigQuery, Databricks, Fivetran, Airbyte, Spark, Great Expectations, Tableau, Power BI, AWS, GCP, and Azure without custom glue code. The web UI visualizes asset graphs, run history, schedules, sensors, and partitioned materializations with built-in alerting via Slack and PagerDuty. Dagster Pipes enables executing arbitrary code in external environments including Spark clusters, Kubernetes Jobs, and cloud functions. Deploy via Docker Compose on a single VM with separate containers for the webserver, daemon, and code locations, or use official Helm charts for production Kubernetes with K8sRunLauncher scaling each run as an independent Job. Running on a dedicated VPS on RepoCloud with guaranteed CPU, RAM, and SSD, full root SSH access, and a browser serial console. Apache-2.0 licensed.
SigNoz
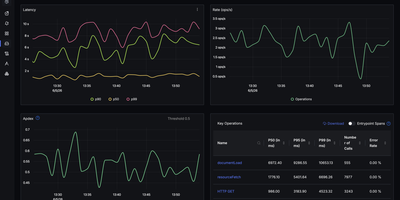
With over 31,000 GitHub stars and native OpenTelemetry support that eliminates vendor lock-in from day one, SigNoz delivers full-stack observability covering metrics, traces, and logs in a single pane of glass without the per-host pricing model of commercial APM platforms. The platform ingests telemetry data through the OpenTelemetry Collector, supporting auto-instrumentation for Java, Python, Node.js, Go, Ruby, PHP, and .NET applications with zero code changes required for basic tracing. ClickHouse serves as the columnar storage backend, providing fast aggregation queries over billions of spans and log lines with configurable retention policies and tiered storage. The distributed tracing view renders flame graphs and Gantt charts showing request flow across microservices with latency breakdowns, error rates, and p99 percentile calculations. Custom dashboards support PromQL and ClickHouse SQL queries with time-series charts, bar graphs, tables, and value widgets. The log management pipeline supports structured and unstructured logs with full-text search, log pipelines for parsing and enrichment, and correlation with traces via trace IDs. Alert rules can be configured on any metric or log query with notification channels including Slack, PagerDuty, OpsGenie, webhooks, and email. The exceptions monitoring module automatically groups and tracks application errors with stack traces, occurrence counts, and first-seen timestamps. Service maps visualize inter-service dependencies with real-time latency and error rate overlays. Running on a dedicated VPS on RepoCloud with guaranteed CPU, RAM, and SSD, full root SSH access, and a browser serial console. MIT licensed with an enterprise edition available.
Sentry
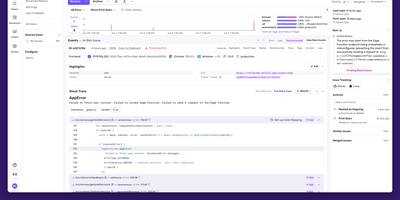
Backed by 44,000 GitHub stars and trusted by over four million developers, Sentry is the debugging platform that captures errors, traces, replays, profiles, and metrics from your applications and connects them all through distributed tracing. The error tracking engine captures full stack traces with source context, breadcrumbs, and automatic demangling for native crashes, while intelligent grouping consolidates duplicate events into actionable issues with regression detection and automatic assignment. Performance monitoring instruments your frameworks automatically, capturing every database query, API call, cache hit, and queue operation as spans within distributed traces that flow across frontend, backend, and mobile boundaries. Session Replay produces video-like recordings of real user sessions showing DOM interactions, network requests, console messages, and errors on a synchronized timeline, with AI-powered summaries that describe what happened without watching the full replay. Continuous profiling captures CPU execution data at the function and line level for Node.js, Python, iOS, and Android, linking slow spans directly to the exact code responsible. Cron monitoring tracks scheduled jobs for failures, missed runs, and duration anomalies. The alerting engine fires notifications through Slack, PagerDuty, Opsgenie, and webhooks on new issues, regressions, error spikes, or when latency and crash-free session rate thresholds are crossed. Self-hosted deployment runs as a Docker Compose stack with PostgreSQL, ClickHouse, Kafka, Redis, and Relay. Running on a dedicated VPS on RepoCloud with guaranteed CPU, RAM, and SSD, full root SSH access, and a browser serial console. FSL licensed.
Quickwit
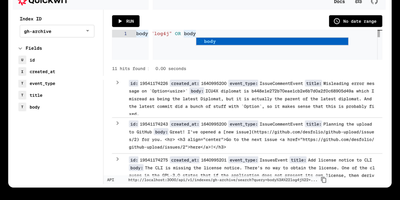
With over 11,000 GitHub stars and now backed by Datadog while remaining fully Apache 2.0 licensed, Quickwit delivers the search performance Elasticsearch users expect at a fraction of the infrastructure cost by moving the index to object storage instead of expensive local SSDs. The Rust-based engine, built on the Tantivy search library with SIMD-accelerated vectorized processing and zero garbage collection overhead, achieves sub-second search latency directly against Amazon S3, Azure Blob Storage, Google Cloud Storage, or any S3-compatible backend like MinIO and Ceph. The Elasticsearch-compatible REST API covers ingest, search, query DSL, and aggregations, enabling existing log shippers including Vector, Fluent Bit, and Syslog to migrate without rewriting configurations. Native OpenTelemetry Protocol endpoints accept logs and traces via gRPC, while Jaeger integration provides a drop-in distributed tracing backend. Ingestion from Apache Kafka, Amazon Kinesis, and Apache Pulsar supports streaming pipelines with multi-index partitioning, and the schemaless JSON indexing mode eliminates the need for upfront schema definitions. Stateless searchers and indexers scale horizontally on Kubernetes or bare metal, with a control plane that distributes indexing tasks and a janitor that manages retention policies and GDPR-compliant deletions. The built-in web UI displays search results and cluster state, while the official Grafana data source enables log exploration dashboards. Running on a dedicated VPS on RepoCloud with guaranteed CPU, RAM, and SSD, full root SSH access, and a browser serial console. Apache 2.0 licensed.
OpenStatus
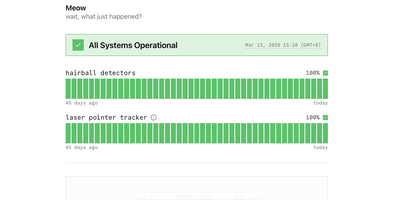
Trusted by Cal.com, WhiteBIT, and Documenso and backed by 8,800+ GitHub stars, OpenStatus delivers the open-source status page and uptime monitoring platform that replaces Atlassian Statuspage, Better Stack, and Instatus with a single self-hosted deployment. The monitoring engine runs Go-based probes across 28 global regions on three cloud providers checking HTTP, TCP, and DNS endpoints in parallel with configurable intervals and multi-region consensus to eliminate false-positive alerts. Status pages ship with custom domain support, password and email-domain access controls, maintenance windows, grouped monitor components, and subscriber notifications via email and RSS. Incident management provides structured status reports with investigating, identified, monitoring, and resolved timeline phases that publish automatically to affected status pages. The monitoring-as-code workflow supports YAML configuration synced through the CLI, a GitHub Actions integration for CI/CD pipelines, and a Terraform provider for infrastructure-as-code deployments. The typed ConnectRPC JSON-over-HTTP API exposes a published OpenAPI specification with a Node SDK for programmatic access, while an MCP server connects AI assistants like Claude, ChatGPT, and Cursor directly to workspace data. The tech stack combines Next.js with shadcn/ui for the dashboard, Hono for the API server, Drizzle ORM over Turso for application data, and Tinybird for analytics. Private monitoring locations deploy as a single 8.5MB Docker image behind firewalls to check internal services. Running on a dedicated VPS on RepoCloud with guaranteed CPU, RAM, and SSD, full root SSH access, and a browser serial console. AGPL-3.0 licensed.
OpenLIT
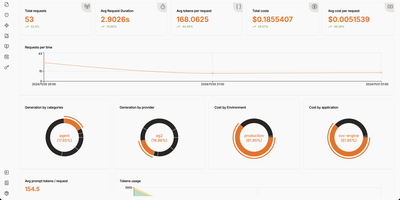
Your AI application is burning through API tokens faster than you can refresh the billing page, and you have no idea which prompt template is responsible. OpenLIT plugs that visibility gap with a self-hosted observability platform built specifically for LLM workloads. Add one line of code to instrument 90+ LLM providers, agent frameworks, and vector databases, then watch every request flow through a tracing dashboard that shows tokens consumed, latency measured, and dollars spent per call, per model, per environment. The requests view lists every LLM interaction with provider, model, cost, and token breakdown in a filterable table, while the trace detail panel lets you drill into individual spans to read the exact prompt sent and response received. Prompt Hub turns prompts into versioned artifacts you deploy, rollback, and A/B test without touching application code. OpenGround compares models side by side on the same input, so you can evaluate cost-versus-quality tradeoffs before committing to a provider. Automated evaluations run LLM-as-a-judge scoring on live production traces, flagging hallucinations, bias, and toxicity in real time. The Vault stores and rotates API keys centrally so secrets stay out of your codebase. Custom dashboards let you build drag-and-drop monitoring views with charts, stat cards, and tables backed by SQL queries against ClickHouse. GPU utilization, memory, temperature, and power metrics feed into the same platform for end-to-end infrastructure visibility. Running on a dedicated VPS on RepoCloud with guaranteed CPU, RAM, and SSD, full root SSH access, and a browser serial console. Apache 2.0 licensed.
Jaeger
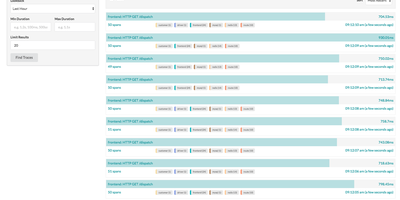
Created by Uber Technologies and graduated as the seventh CNCF top-level project in October 2019 with over 23,000 GitHub stars, Jaeger has become one of the most widely deployed open-source distributed tracing platforms, processing billions of spans per day in production environments at organizations including Uber, Red Hat, and Shopify. Version 2 rebuilt the platform on the OpenTelemetry Collector framework, inheriting its extensible pipeline architecture while implementing Jaeger-specific features as extensions and components, enabling seamless integration with the OpenTelemetry ecosystem through native OTLP protocol support. The platform stores traces in Cassandra 4.0+, Elasticsearch 7.x/8.x, OpenSearch 1.0+, ClickHouse, or the embedded Badger database for development setups. Three sampling strategies control trace volume: head-based sampling with constant, probabilistic, and rate-limiting modes, tail-based sampling using the OpenTelemetry Collector processor that evaluates complete traces before storage decisions, and adaptive sampling that dynamically adjusts probabilities based on observed traffic patterns. Service Performance Monitoring computes RED metrics directly from spans, displaying request rates, error rates, and latency percentiles in the Monitor tab with drill-down from aggregate service views to individual traces. The web UI provides trace search with multi-field filtering, trace detail views with span timeline visualization, trace comparison across services, and dependency graphs mapping service relationships from actual traffic. Deployment options range from a single all-in-one binary for development to distributed collector-ingester-query configurations with Kafka intermediate buffering for production scale. Running on a dedicated VPS on RepoCloud with guaranteed CPU, RAM, and SSD, full root SSH access, and a browser serial console. Apache 2.0 licensed.
OpenSearch
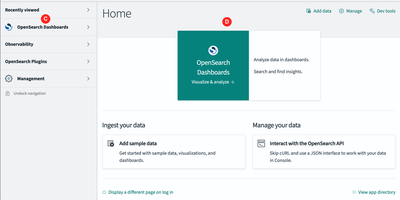
OpenSearch is a search and analytics platforms, powering full-text search, log analytics, observability, and AI-powered vector retrieval at petabyte scale. The distributed engine provides BM25 full-text search alongside k-NN vector search using NMSLIB, Faiss, and Lucene libraries, enabling semantic search, hybrid search combining keyword and vector scoring through normalization processors, neural sparse search, and retrieval-augmented generation workflows with built-in ML Commons for model hosting. OpenSearch Dashboards delivers interactive visualization with Discover for log exploration, custom dashboards, alerting, anomaly detection using Random Cut Forest algorithms, and Security Analytics with detection rules mapped to MITRE ATT&CK. Native Prometheus integration with full PromQL support unifies metrics alongside logs and traces in a single observability interface, while Data Prepper handles telemetry ingestion from OpenTelemetry collectors, Fluent Bit, and Logstash-compatible pipelines. SQL and Piped Processing Language queries with a visual PPL builder enable analysts to query data without learning the native DSL. Index State Management automates index lifecycle with rollover, shrink, and delete policies, while cross-cluster replication and searchable snapshots on S3-compatible storage provide disaster recovery. Scoped API keys, field-level security, document-level security, and audit logging deliver enterprise-grade access control. Docker Compose deploys multi-node clusters alongside the Kubernetes operator for orchestrated production environments. Running on a dedicated VPS on RepoCloud with guaranteed CPU, RAM, and SSD, full root SSH access, and a browser serial console. Apache 2.0 licensed.
Langfuse
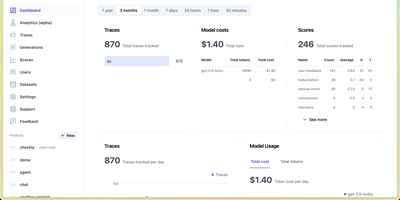
Backed by Y Combinator and trusted by over 2,300 companies processing billions of observations monthly, Langfuse is the most widely adopted open-source platform for building, monitoring, evaluating, and debugging LLM applications. The hierarchical tracing engine captures every LLM call, tool invocation, retrieval step, and agent action as nested spans based on OpenTelemetry, with automatic cost calculation, latency tracking, and token usage attribution across sessions and users. Prompt Management separates prompts from code with versioned artifacts, label-based deployments, one-click rollbacks, and runtime SDK fetching with server-side caching, while linking every generation back to its exact prompt version for attribution analytics. The evaluation system supports LLM-as-a-judge scoring, heuristic code evaluators, user feedback collection, and manual annotation workflows that run automatically on production traces or against curated datasets. The Playground enables interactive prompt testing on real production inputs with side-by-side model comparison across providers. Datasets and Experiments define test cases for systematic benchmarking with comparative result visualization. Native SDKs for Python and TypeScript provide decorator-based instrumentation, while 100+ integrations cover LangChain, LlamaIndex, OpenAI SDK, LiteLLM, Vercel AI SDK, and any OpenTelemetry-instrumented framework. The analytics dashboard surfaces cost breakdowns, quality scores, latency percentiles, and usage trends across models and prompt versions. Running on a dedicated VPS on RepoCloud with guaranteed CPU, RAM, and SSD, full root SSH access, and a browser serial console. MIT licensed.
OpenObserve
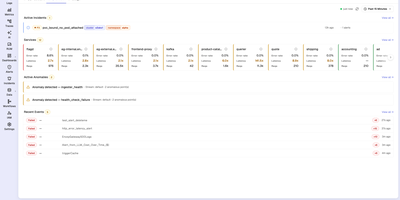
With 20,500+ GitHub stars and over 6,000 organizations running it in production — including a Fortune 100 company ingesting more than 4 PB per day — OpenObserve is the open-source observability platform that replaces your entire Datadog, Splunk, or ELK stack with a single Rust binary deploying in under two minutes. Apache Parquet columnar storage with zstd compression on S3-compatible object storage delivers 140x lower storage costs than Elasticsearch while providing better query performance on a quarter of the hardware. Ingest logs, metrics, and distributed traces via native OpenTelemetry OTLP endpoints with no vendor lock-in. Query logs and traces with standard SQL, metrics with SQL or PromQL — no proprietary query language to learn. The built-in dashboard builder offers 19 chart types including time-series graphs, heatmaps, gauges, tables, and top-K lists with drag-and-drop layout combining data from all signal types. Data pipelines process, enrich, redact, or normalize ingestion streams using Vector Remap Language for real-time transformations including PII redaction and logs-to-metrics conversion. Real User Monitoring captures frontend performance with session replay. The Service Catalog provides topology-based trace analysis with side-panel drill-downs into database queries and error details. Alerting supports real-time and scheduled rules with SQL and PromQL conditions. Native multi-tenancy isolates organizations and streams with complete data separation. Running on a dedicated VPS on RepoCloud with guaranteed CPU, RAM, and SSD, full root SSH access, and a browser serial console. AGPLv3 licensed.

Grafana
The de facto dashboard of observability: Grafana is the open-source frontend that turns the data stores you already run into interactive graphs. It does not store metrics itself; it connects to the data stores you already run and turns their contents into interactive dashboards. Supported sources number over 150 via plugins: Prometheus, Loki, Tempo, InfluxDB, Elasticsearch, MySQL, PostgreSQL, Microsoft SQL Server, AWS CloudWatch, Azure Monitor, Google Cloud Monitoring, and many more. Dashboards are built from a large library of panel types (time series, heatmaps, tables, gauges, logs) with template variables for reusable, parameterized views. Unified alerting evaluates rules against any connected data source, not just Prometheus, and routes notifications to Slack, PagerDuty, email, and other channels with grouping and silencing - unlike Prometheus Alertmanager, a single rule can combine a Loki log pattern, a PostgreSQL query result, and a CloudWatch metric. Dashboards serialize to JSON and data sources configure via provisioning files, so the entire observability setup can live in Git and deploy repeatably across environments. Explore mode adds ad-hoc querying outside dashboards, with split view for correlating a metric spike against the matching log lines, and access control spans organizations, teams, folder permissions, and OAuth, LDAP, and SAML integration. Written in Go and TypeScript, AGPL-licensed. Self-hosting gives you unlimited users, dashboards, and queries at flat hosting cost, without Grafana Cloud's usage-based pricing.
Tianji
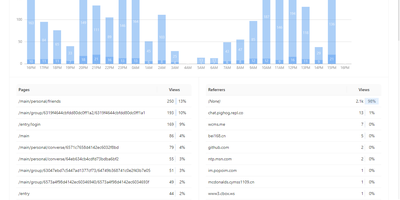
Website analytics, uptime monitoring, and server status - three tools most teams run separately - combined in Tianji, an open-source observability platform. The analytics layer tracks page views, unique visitors, referrers, and UTM parameters with a lightweight cookie-less script, which keeps collection GDPR and CCPA friendly. The uptime monitor checks availability and latency on configurable intervals, accepts passively reported results, and publishes public status pages for incident communication. Server status agents report CPU, memory, disk, and network metrics with threshold-based alerts, and notifications route through webhooks, Slack, Telegram, and other channels with noise control. It also includes anonymous telemetry for tracking deployments of your own open-source projects, surveys, waitlists, team collaboration, and an OpenAPI interface for integrations and exports. The consolidation is the point: traffic analytics, uptime checks, and server metrics share one interface and one alerting layer, so diagnosing an incident does not mean hopping between Google Analytics, Uptime Kuma, and Prometheus - and the built-in public status pages replace a separate paid Statuspage-style subscription. Because collection uses no cookies with IP truncation and aggregation by default, basic traffic measurement requires no consent banner. Built in TypeScript under the Apache 2.0 license and inspired by Umami and Uptime Kuma, it is deliberately right-sized for independent developers and small SaaS teams whose monitoring needs are real but lightweight.
Agenta
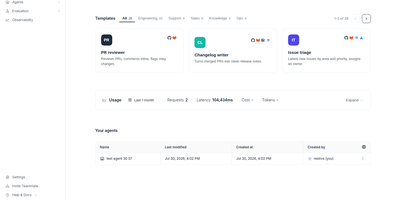
Agenta delivers a comprehensive open-source LLMOps workspace that covers the full lifecycle of AI application development — from prompt engineering through production monitoring. The platform supports 15+ model providers including OpenAI, Anthropic, Google Gemini, Mistral, Groq, Together AI, Azure, AWS Bedrock, and self-hosted models via Ollama, enabling teams to switch between providers without code changes. The prompt playground allows side-by-side comparison of different configurations, while the evaluation system offers LLM-as-a-Judge assessment, 20+ pre-built evaluators covering semantic similarity, regex matching, and factual accuracy, plus custom Python evaluators for domain-specific requirements. Teams run evaluations through both the web UI for subject matter experts and the Evaluation SDK for programmatic CI/CD integration. The observability layer captures full trace visibility across complex agentic workflows, flagging quality issues like hallucinations and off-topic responses in real time. Human annotation workflows let domain experts review and annotate LLM outputs, feeding corrections back into the evaluation loop. The architecture supports Chain of Prompts, RAG pipelines, and multi-step agent workflows, integrating with frameworks like LangChain and LlamaIndex. Self-hosting deploys via Docker Compose with Traefik for routing, requiring only a clone, environment configuration, and a single docker compose command. On RepoCloud, deploy Agenta on a dedicated VPS with root SSH access, persistent storage for evaluation datasets and traces, and complete control over model provider credentials, all under the MIT license with no usage restrictions.
Apache HertzBeat
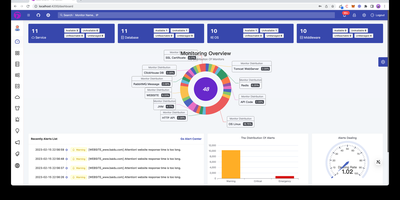
Instead of deploying proprietary background agents across dozens of target nodes, engineers rely on Apache HertzBeat to monitor real-time infrastructure health, metrics gathering, threshold alerting, and public status pages from a central operations platform. Operations teams can poll hundreds of target services without deploying proprietary background daemons, gathering performance data across Linux hosts, Kubernetes clusters, SQL databases, and network switches using native connection protocols. Engineers can define custom monitoring targets directly within the web dashboard by composing declarative YAML templates that specify polling intervals, parsing expressions, and metric extraction rules. The centralized alert engine processes inbound threshold events, suppresses cascading alert storms during maintenance windows, and dispatches actionable incident notifications to Discord channels, Slack rooms, Telegram groups, and webhook endpoints. Telemetry streams flow into interactive charts with customizable refresh cadences, enabling site reliability engineers to inspect latency waterfalls, correlate log spikes against CPU exhaustion, and track disk capacity trends over extended timeframes. Administrators can also publish real-time public status pages that inform external stakeholders about service availability, scheduled downtime, and ongoing incident resolutions. Running on a dedicated VPS on RepoCloud with guaranteed CPU, RAM, and SSD, full root SSH access, and a browser serial console. Apache 2.0 licensed.
Graylog
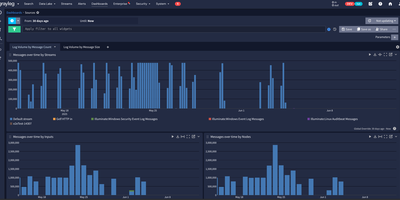
Trusted by over 60,000 organizations worldwide with more than 8,100 GitHub stars since 2010, Graylog has established itself as one of the fastest paths from raw log data to operational visibility, delivering centralized log management, security analytics, and compliance auditing through a purpose-built web interface with sub-second search at scale. The platform ingests logs from virtually any source via syslog, GELF, Beats, raw TCP/UDP, HTTP, CEF, IPFIX, and Netflow protocols, processing each message through configurable pipelines that parse fields, apply transformations, enrich events with GeoIP data from MaxMind or IPinfo lookup tables, and route messages to appropriate streams based on content rules. OpenSearch handles full-text indexing and storage with dynamic shard sizing that automatically calculates appropriate sizes from available node memory, while MongoDB stores configuration metadata including user accounts, roles, dashboards, alert rules, and pipeline definitions. The alerting system integrates with Slack, PagerDuty, and email with customizable notification templates and Replay Search links for immediate investigation context. Version 7.0 introduced MCP server integration for connecting preferred LLMs to perform AI-assisted log analysis and automation, while version 7.1 added Sigma detection rule import from private GitHub, GitLab, and Bitbucket repositories for detection-as-code workflows. The Sidecar agent management system centrally configures and deploys Filebeat, Winlogbeat, and nxlog collectors across infrastructure from the Graylog web interface. Running on a dedicated VPS on RepoCloud with guaranteed CPU, RAM, and SSD, full root SSH access, and a browser serial console. SSPL licensed.
OneUptime
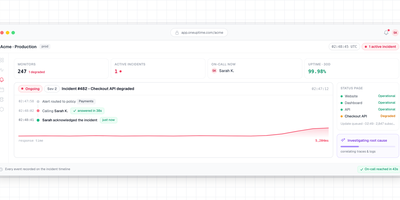
With 7,400+ GitHub stars and a feature set that replaces seven separate SaaS subscriptions — Pingdom for monitoring, StatusPage.io for status pages, PagerDuty for on-call, Incident.io for incident management, Datadog for APM, Loggly for logs, and Sentry for error tracking — OneUptime delivers every tool your reliability team needs in a single open-source platform that is genuinely 100% open source under Apache 2.0 (not open-core). Uptime monitoring runs synthetic checks against websites, APIs, ports, SSL certificates, and DNS records from distributed global probes with configurable intervals and thresholds. Branded status pages publish automatically when monitors detect issues, notifying subscribers via email, SMS, webhook, or RSS without manual intervention during an outage. On-call scheduling routes alerts through escalation policies to the right engineer via phone call, SMS, push notification, Slack, or Microsoft Teams. The incident management workflow handles declaration, triage, communication, resolution, and post-mortem generation in a unified timeline. APM collects traces and metrics via native OpenTelemetry integration — no proprietary agents required — while log management provides full-text search and alerting. An AI agent continuously monitors telemetry data, identifies root causes, and opens GitHub pull requests with proposed fixes for review. Deploy via Docker Compose or Kubernetes Helm charts with a Terraform provider for infrastructure-as-code configuration. Running on a dedicated VPS on RepoCloud with guaranteed CPU, RAM, and SSD, full root SSH access, and a browser serial console. Apache-2.0 licensed.
Parseable
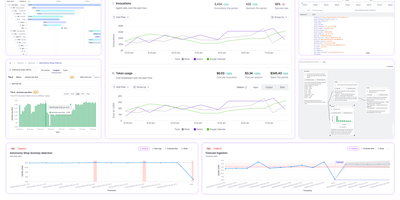
Parseable replaces expensive Elasticsearch clusters and fragmented monitoring stacks with a single Rust binary that ingests, queries, and stores logs, metrics, and traces on commodity object storage at a fraction of the cost. The data lake architecture decouples stateless compute from S3-compatible storage, enabling independent scaling of ingestion throughput and query capacity while cutting storage costs by up to 90% compared to indexed alternatives. OpenTelemetry-native OTLP ingestion accepts telemetry from existing OTel collector pipelines, Prometheus Remote Write endpoints, Kafka consumers, eBPF probes, and popular logging agents including Fluentd, Fluent Bit, and Vector without proprietary format conversions. The SQL-first query interface enables cross-signal analysis across all telemetry types, while native PromQL support with 50+ functions and 12 aggregation operators provides Prometheus-compatible metrics querying that works directly with Grafana dashboards. Built-in features include customizable dashboards, real-time alerting with Webhook, Slack, and Alertmanager targets, role-based access control, OpenID single sign-on integration, LogIQ automatic unstructured-to-structured log transformation, smart caching for frequently accessed data, and retention policies for lifecycle management. AI-powered Keystone Q&A provides natural language to SQL conversion and dataset summarization. All data stored as standard Apache Parquet on object storage remains accessible to any Parquet-compatible engine (DuckDB, Spark, Trino), ensuring zero vendor lock-in. Deploys on AWS S3, Azure Blob, Google Cloud Storage, MinIO, Wasabi, and DigitalOcean Spaces. Running on a dedicated VPS on RepoCloud with guaranteed CPU, RAM, and SSD, full root SSH access, and a browser serial console. Apache 2.0 licensed.