Stars
Forks
Watchers
Developer links
OpenObserve
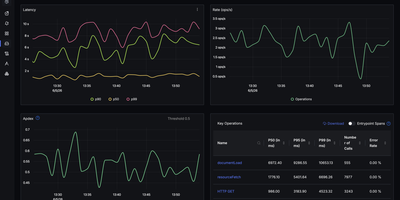
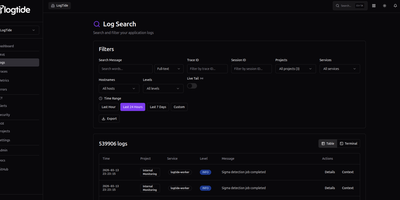
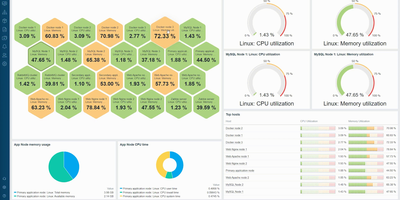
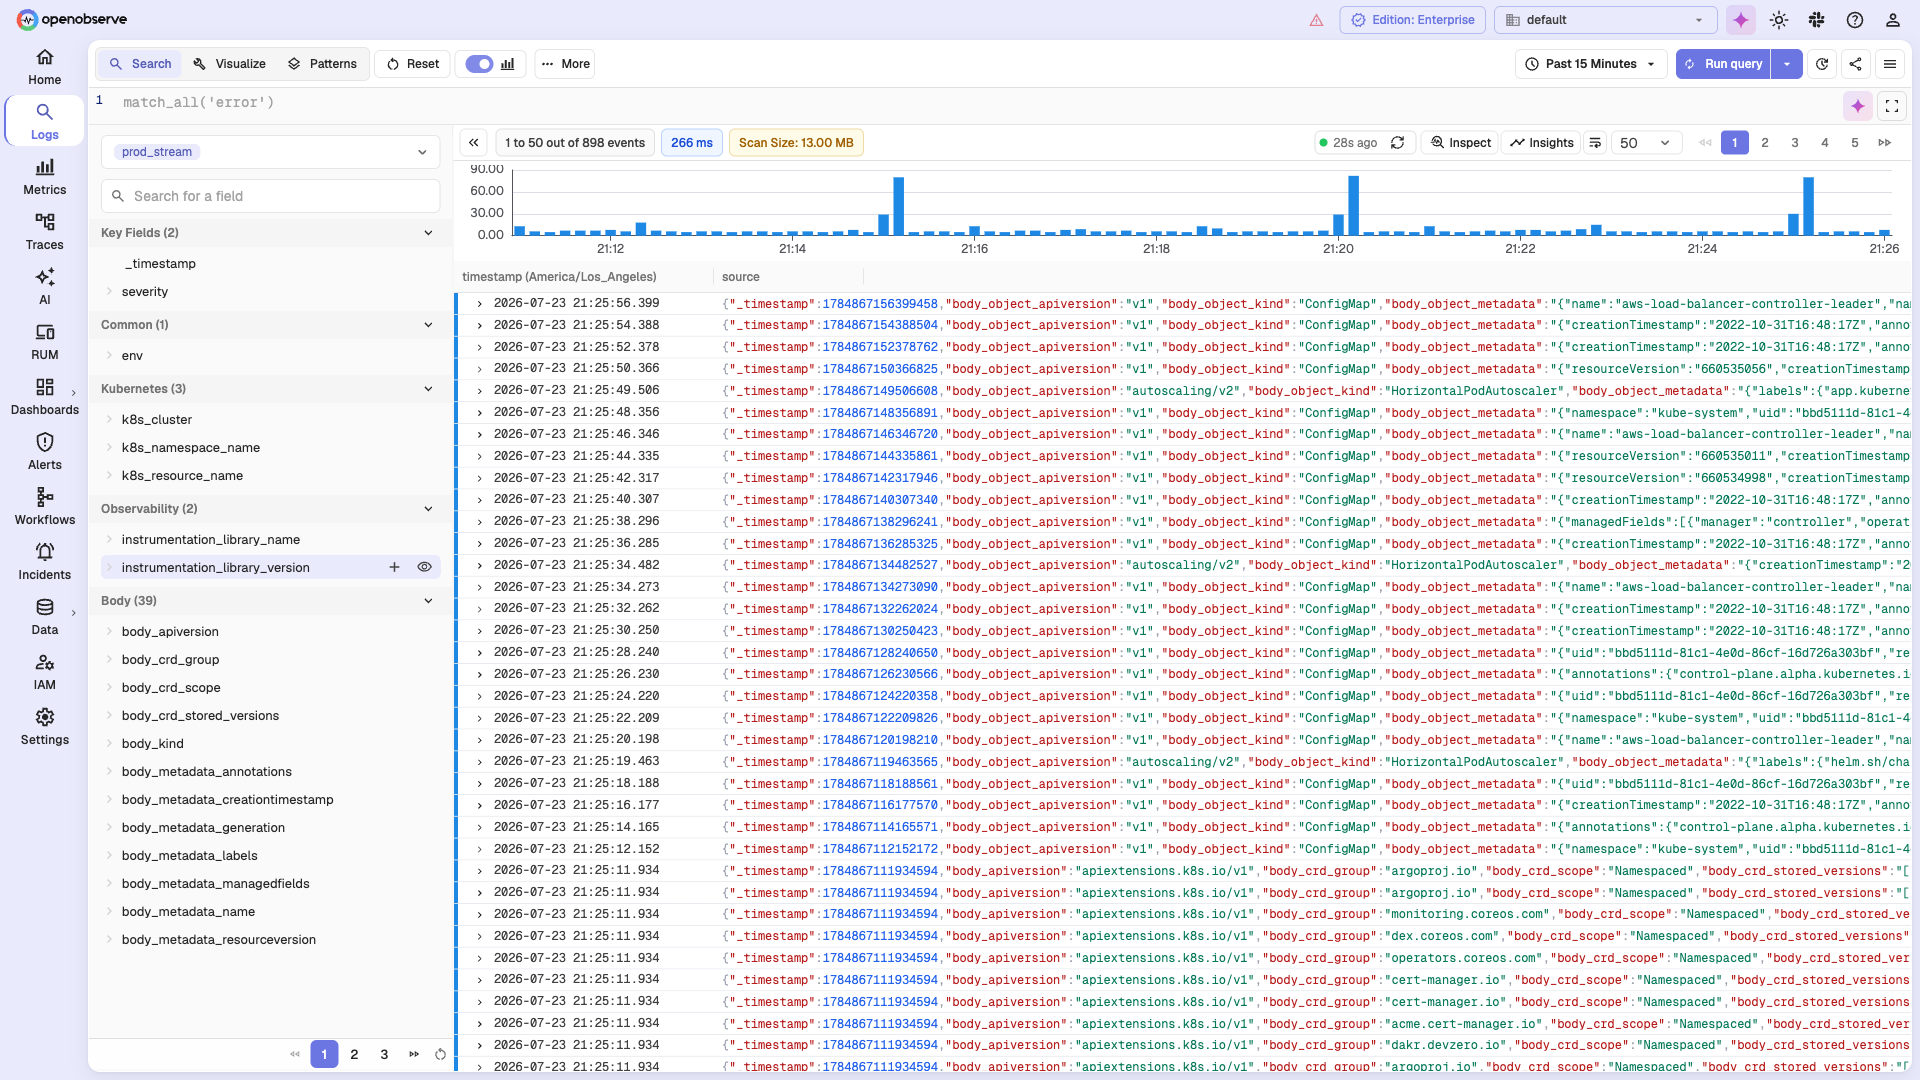
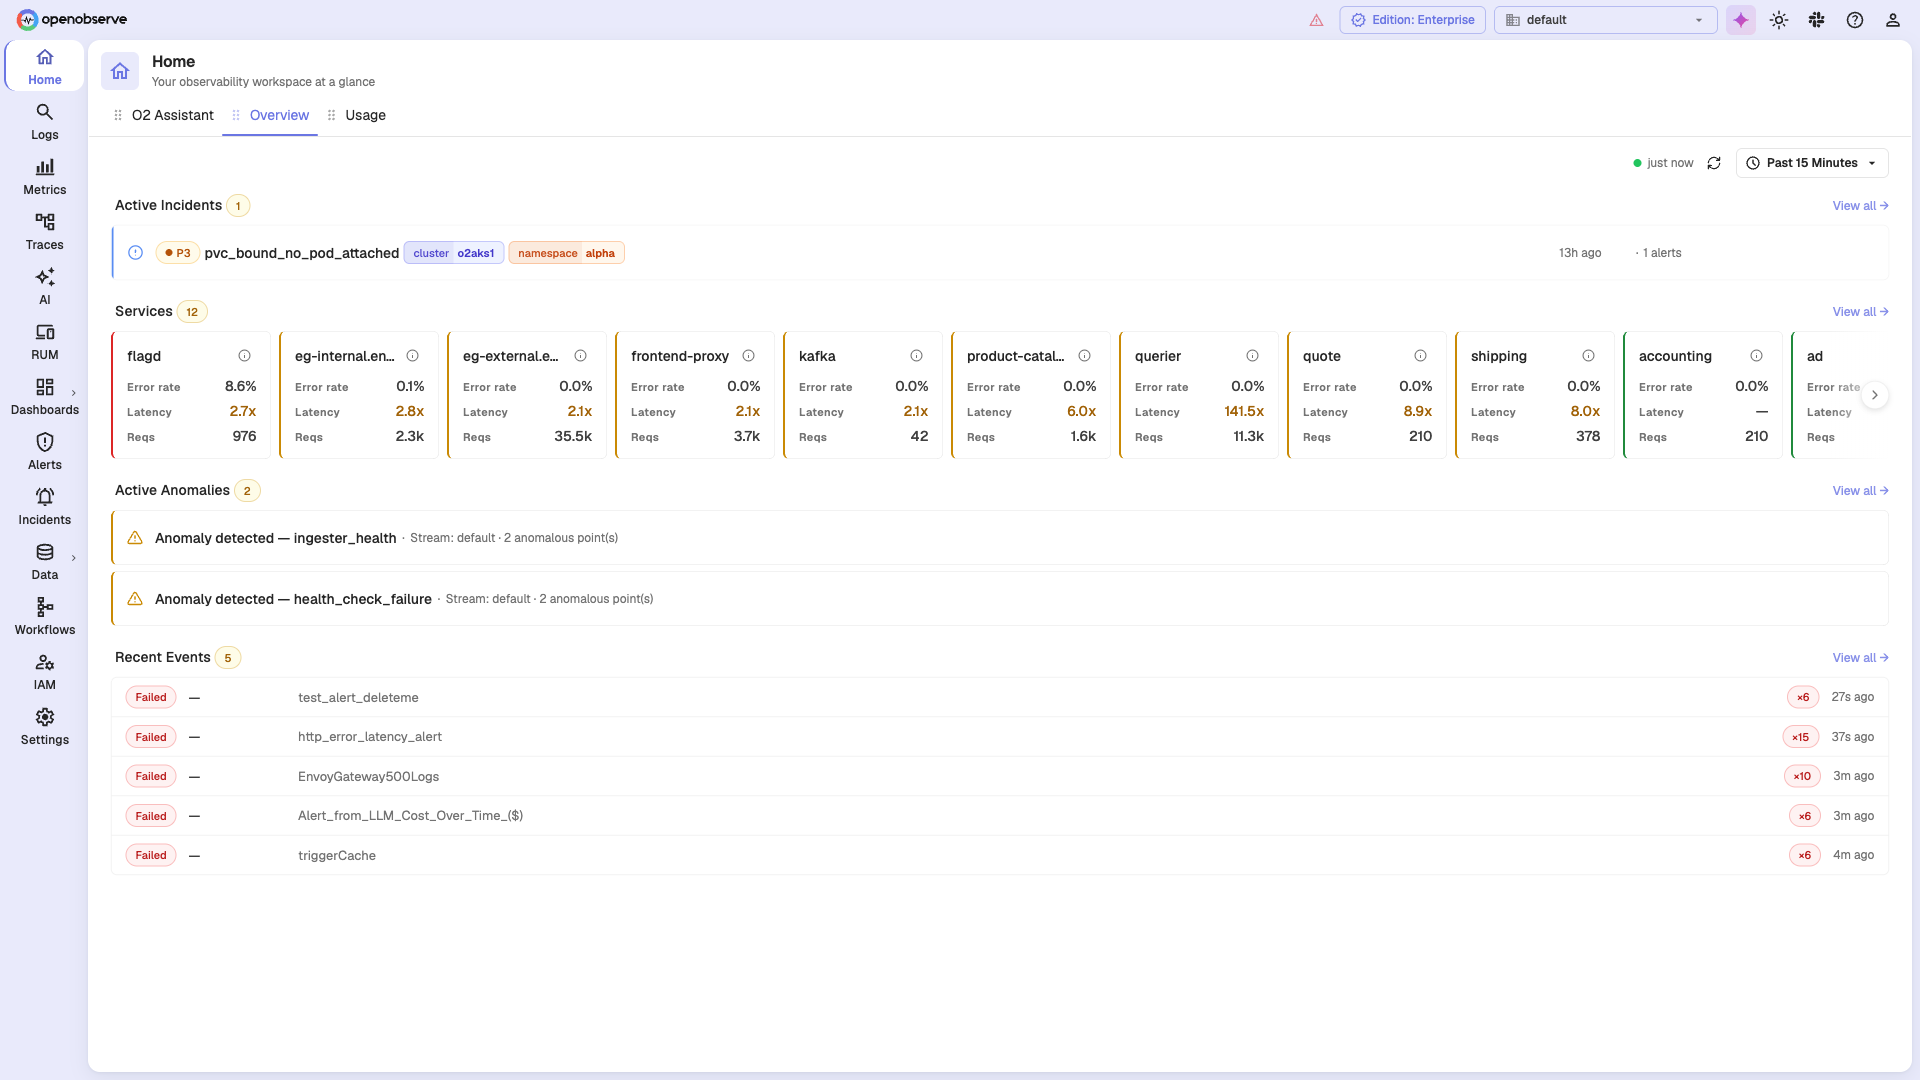
With 20,500+ GitHub stars and over 6,000 organizations running it in production — including a Fortune 100 company ingesting more than 4 PB per day — OpenObserve is the open-source observability platform that replaces your entire Datadog, Splunk, or ELK stack with a single Rust binary deploying in under two minutes. Apache Parquet columnar storage with zstd compression on S3-compatible object storage delivers 140x lower storage costs than Elasticsearch while providing better query performance on a quarter of the hardware. Ingest logs, metrics, and distributed traces via native OpenTelemetry OTLP endpoints with no vendor lock-in. Query logs and traces with standard SQL, metrics with SQL or PromQL — no proprietary query language to learn. The built-in dashboard builder offers 19 chart types including time-series graphs, heatmaps, gauges, tables, and top-K lists with drag-and-drop layout combining data from all signal types. Data pipelines process, enrich, redact, or normalize ingestion streams using Vector Remap Language for real-time transformations including PII redaction and logs-to-metrics conversion. Real User Monitoring captures frontend performance with session replay. The Service Catalog provides topology-based trace analysis with side-panel drill-downs into database queries and error details. Alerting supports real-time and scheduled rules with SQL and PromQL conditions. Native multi-tenancy isolates organizations and streams with complete data separation. Running on a dedicated VPS on RepoCloud with guaranteed CPU, RAM, and SSD, full root SSH access, and a browser serial console. AGPLv3 licensed.
Benefits
- 140x Lower Storage Cost
- Apache Parquet columnar storage with zstd compression on S3-compatible object storage reduces costs by 140x versus Elasticsearch. Retain more data for longer at a fraction of traditional pricing.
- Single Binary Two Minute Deploy
- Written in Rust, the entire platform ships as one binary. No cluster setup, no external dependencies — download, run, and start ingesting logs, metrics, and traces immediately.
- Unified Logs Metrics and Traces
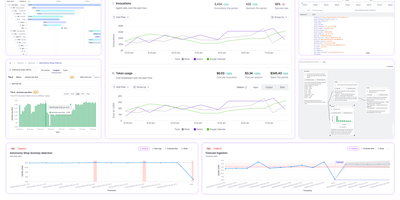
- All three observability pillars plus RUM and LLM monitoring in one platform with one storage layer. Correlate across signal types without managing separate tools or query languages.
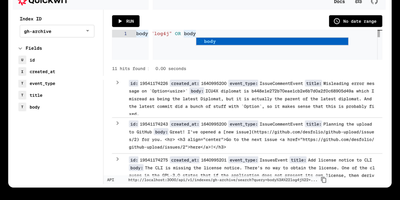
- SQL and PromQL Native Queries
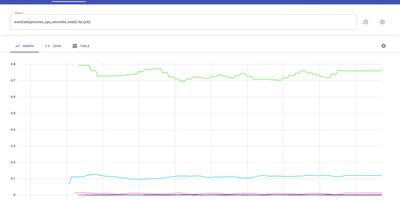
- Query logs and traces with standard SQL, metrics with SQL or PromQL. No proprietary query language to learn — use familiar syntax with full-text search and analytical aggregations.
Features
- OpenTelemetry OTLP Ingestion
- Native OpenTelemetry endpoints accept logs, metrics, and traces via OTLP gRPC and HTTP. Compatible with any OTEL collector, SDK, or instrumentation library without vendor lock-in.
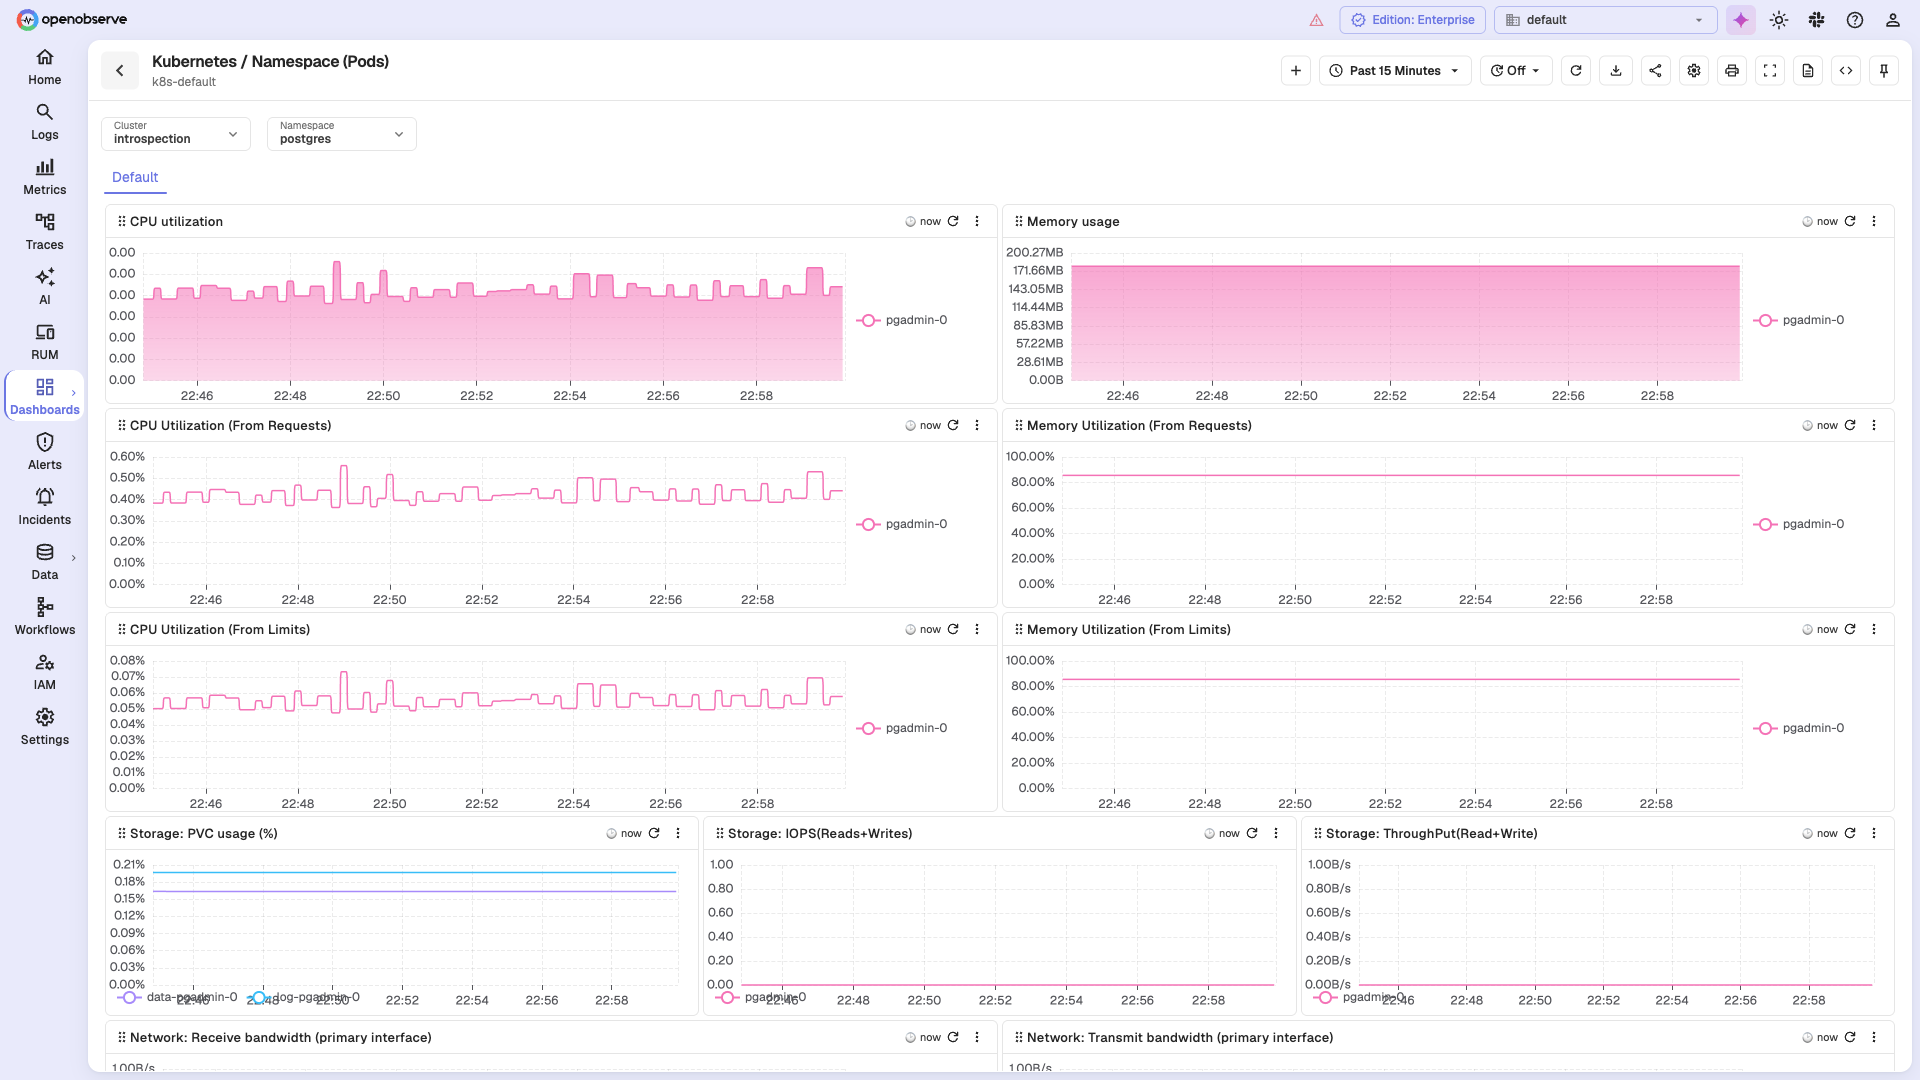
- Dashboard Builder
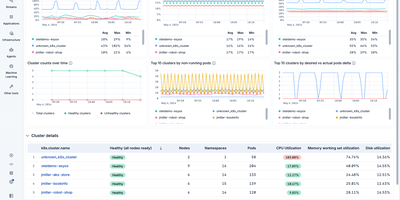
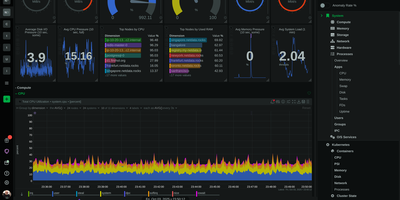
- 19 pre-built chart types including time-series, heatmaps, gauges, tables, and top-K lists with drag-and-drop layout. Combine logs, metrics, and trace data on a single dashboard.
- Data Processing Pipelines
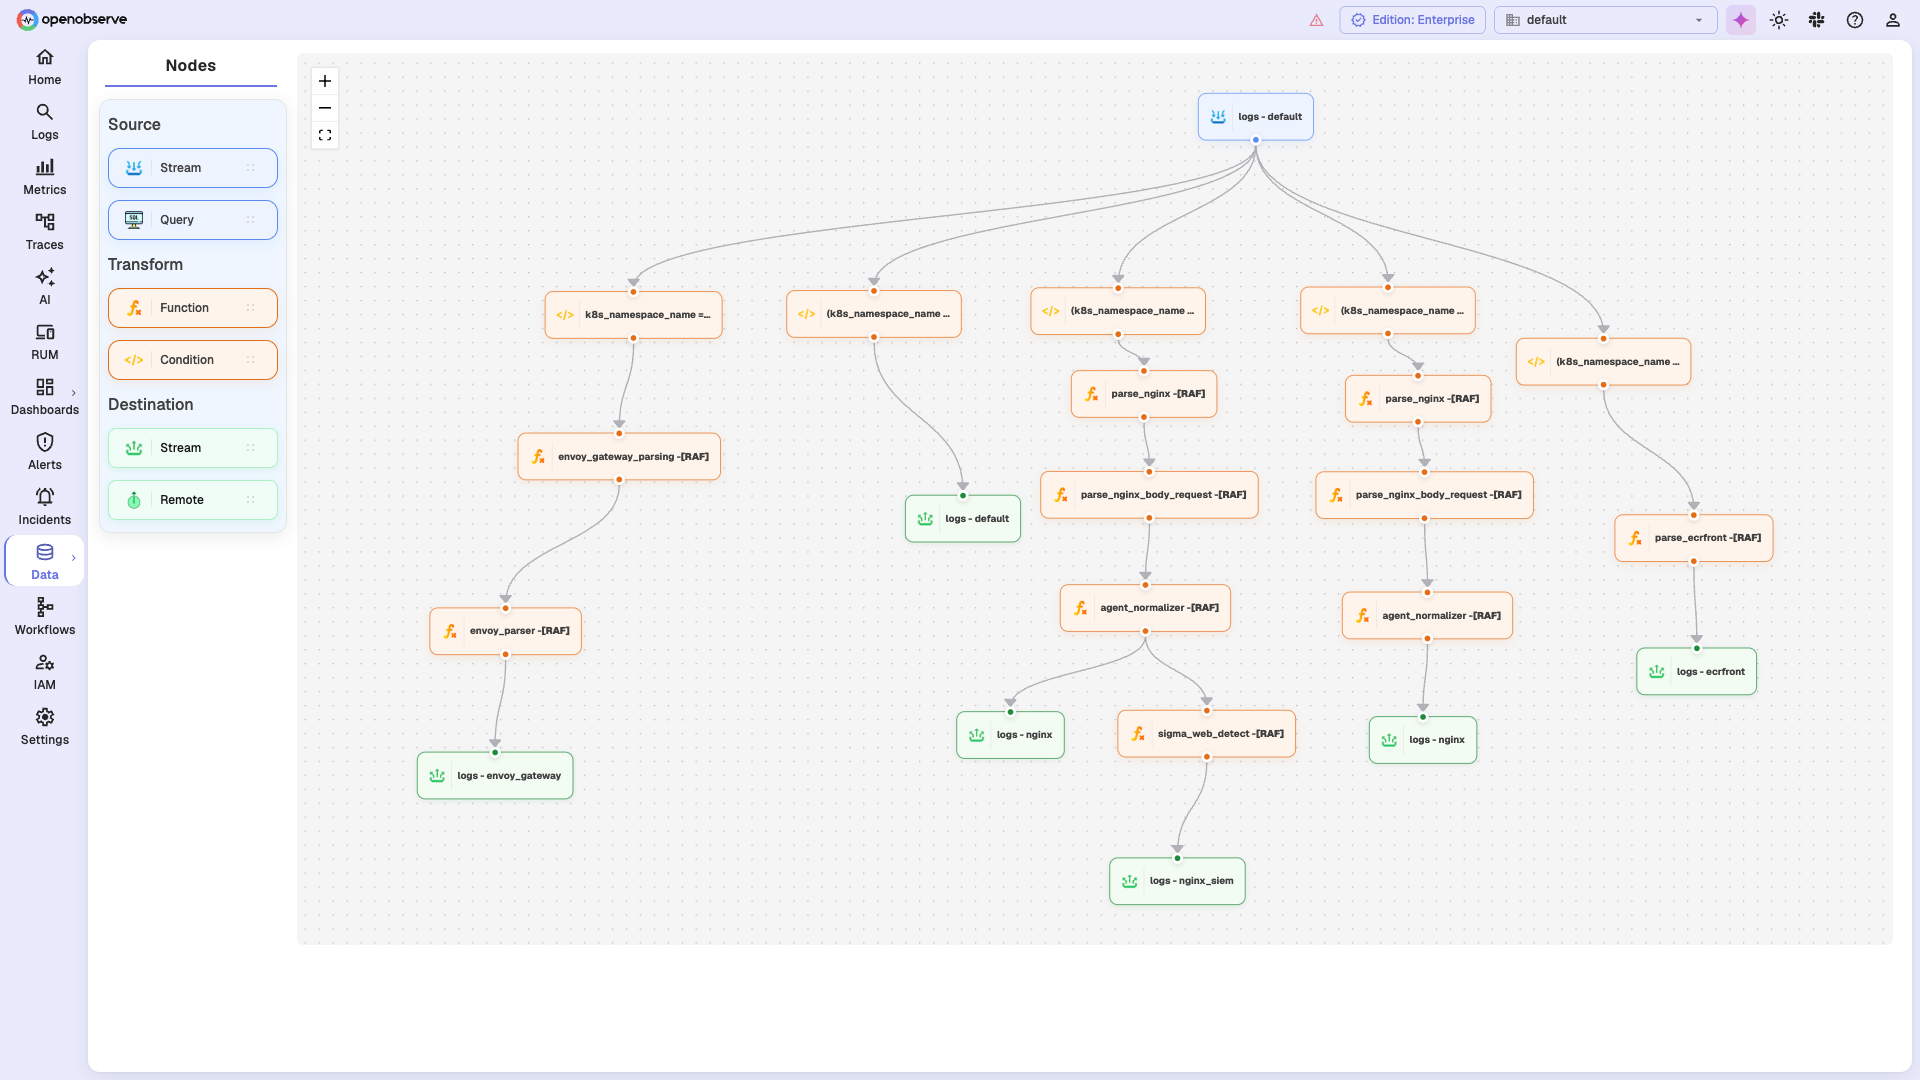
- Enrich, redact, reduce, or normalize data on ingest using Vector Remap Language. PII redaction, logs-to-metrics conversion, and stream routing without external tools.
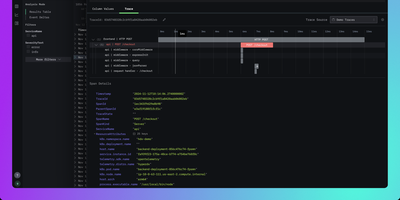
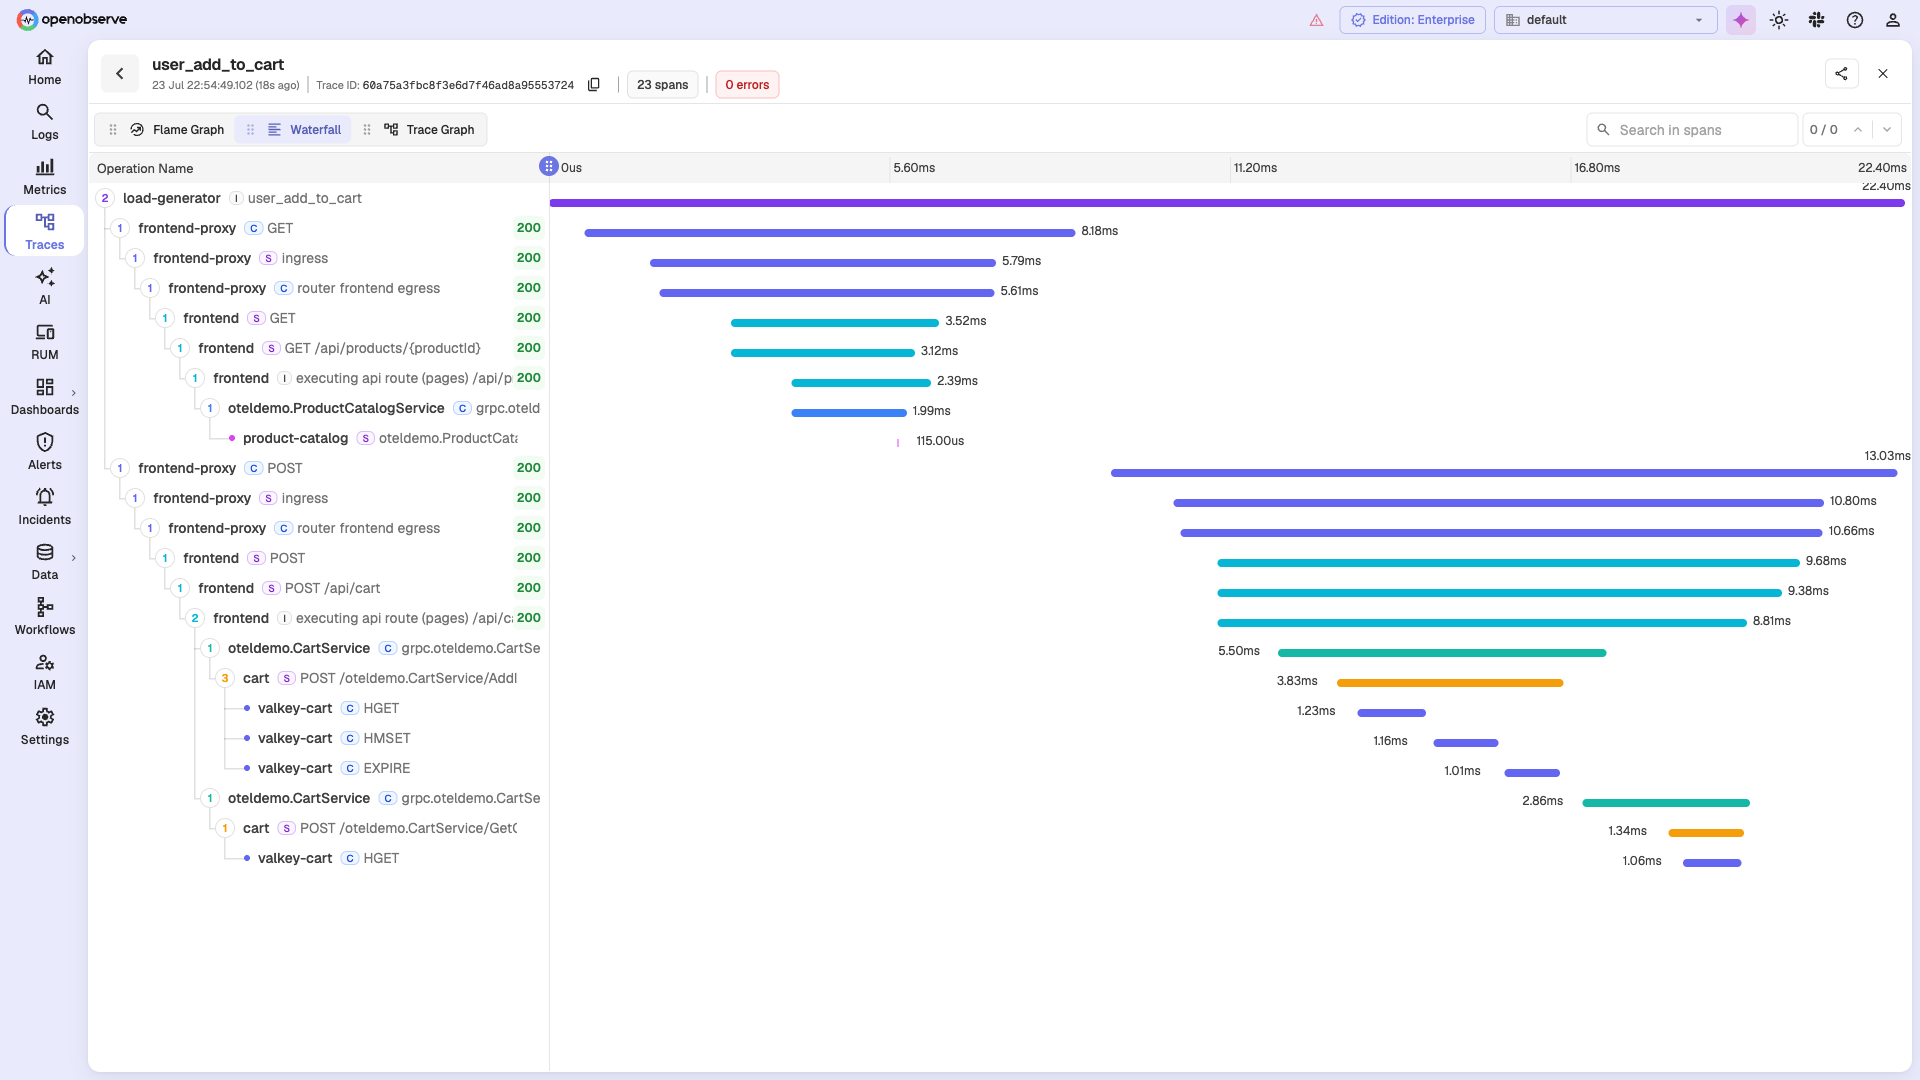
- Service Catalog and Traces
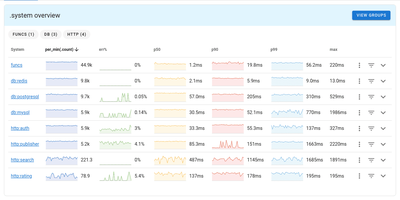
- Topology-based service catalog with side-panel drill-downs, operations tables, and dedicated database and error tabs for debugging distributed traces across microservices.
- Real User Monitoring
- Frontend performance monitoring with session replay captures page load times, core web vitals, JavaScript errors, and user interactions for end-to-end application observability.
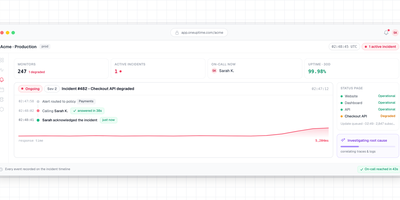
- Alerting and Incidents
- Real-time and scheduled alerting rules with SQL and PromQL conditions. Alert destinations include email, Slack, PagerDuty, and webhook endpoints with configurable thresholds.