Categories
DevOps Monitoring Infrastructure Observability Cloud Native Network Monitoring Real-Time AnalyticsStars
Forks
Watchers
Developer links
Netdata
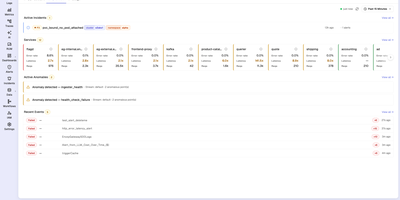
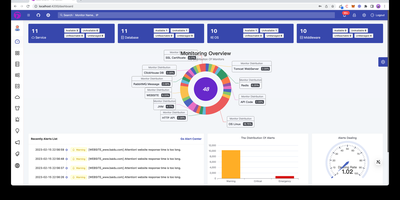
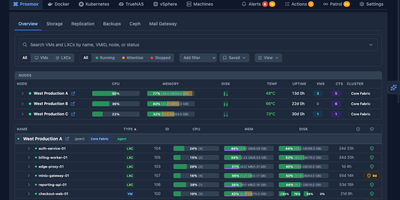
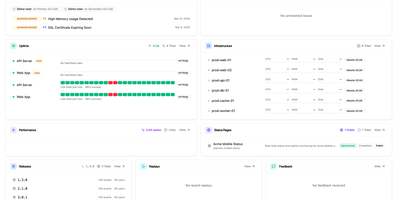
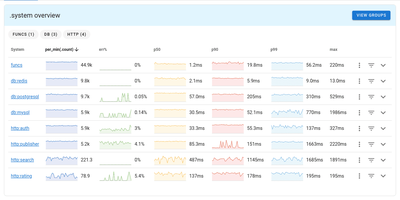
Trusted by millions of engineers and deployed on over 80,000 GitHub stars worth of community confidence, Netdata delivers true real-time monitoring at per-second granularity — 10-60x faster than Prometheus, Datadog, or any conventional monitoring stack that averages away the transient anomalies lasting 2-10 seconds where most production incidents originate. A single installation command deploys the agent with zero configuration, automatically discovering every running process, container, systemd service, network connection, disk, and application on the host within seconds. Unsupervised machine learning trains multiple models per metric directly at the edge, detecting anomalies without thresholds, baselines, or manual tuning. The distributed Parent-Child architecture scales horizontally from a single Raspberry Pi to fleets exceeding 100,000 nodes while maintaining sub-2-second visualization latency and storing metrics at approximately 0.5 bytes per sample through tiered compression. Native network monitoring provides live topology maps, NetFlow and sFlow analytics, SNMP device polling across 200+ profiles, and trap handling — capabilities that typically require a separate NPM product. Hundreds of pre-configured alerts cover systems and applications out of the box, with AI-powered root cause analysis surfacing correlated metrics through natural language via MCP-compatible AI assistants. The agent supports Linux, macOS, FreeBSD, Kubernetes, and Docker with eBPF-based kernel observability requiring no application instrumentation. Running on a dedicated VPS on RepoCloud with guaranteed CPU, RAM, and SSD, full root SSH access, and a browser serial console. GPL v3+ licensed.
Benefits
- Per-Second Visibility Without Gaps
- One-second data collection with sub-2-second visualization latency reveals microbursts, transient failures, and cascading issues that minute-averaging monitoring tools completely miss, covering 90% more incidents.
- Zero Configuration Deployment
- Single command installation auto-discovers every process, container, systemd service, network interface, disk, and application on the host — delivering complete observability within 60 seconds without manual dashboard creation.
- ML Anomaly Detection at the Edge
- Unsupervised machine learning trains multiple models per metric directly on each node, detecting anomalies without manual thresholds or baselines while keeping data sovereign and processing distributed.
- Linear Scaling to 100K+ Nodes
- Distributed Parent-Child architecture processes multi-million samples per second across unlimited nodes with predictable per-node performance — adding capacity never degrades existing monitoring latency.
Features
- Real-Time Dashboards
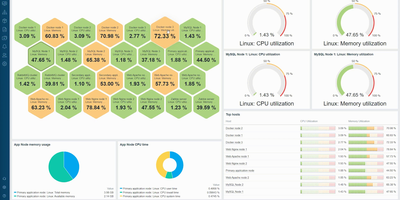
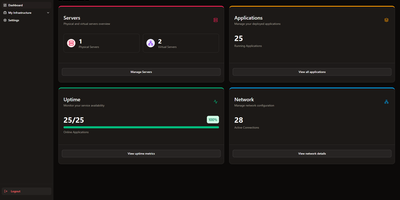
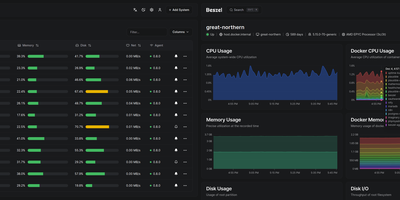
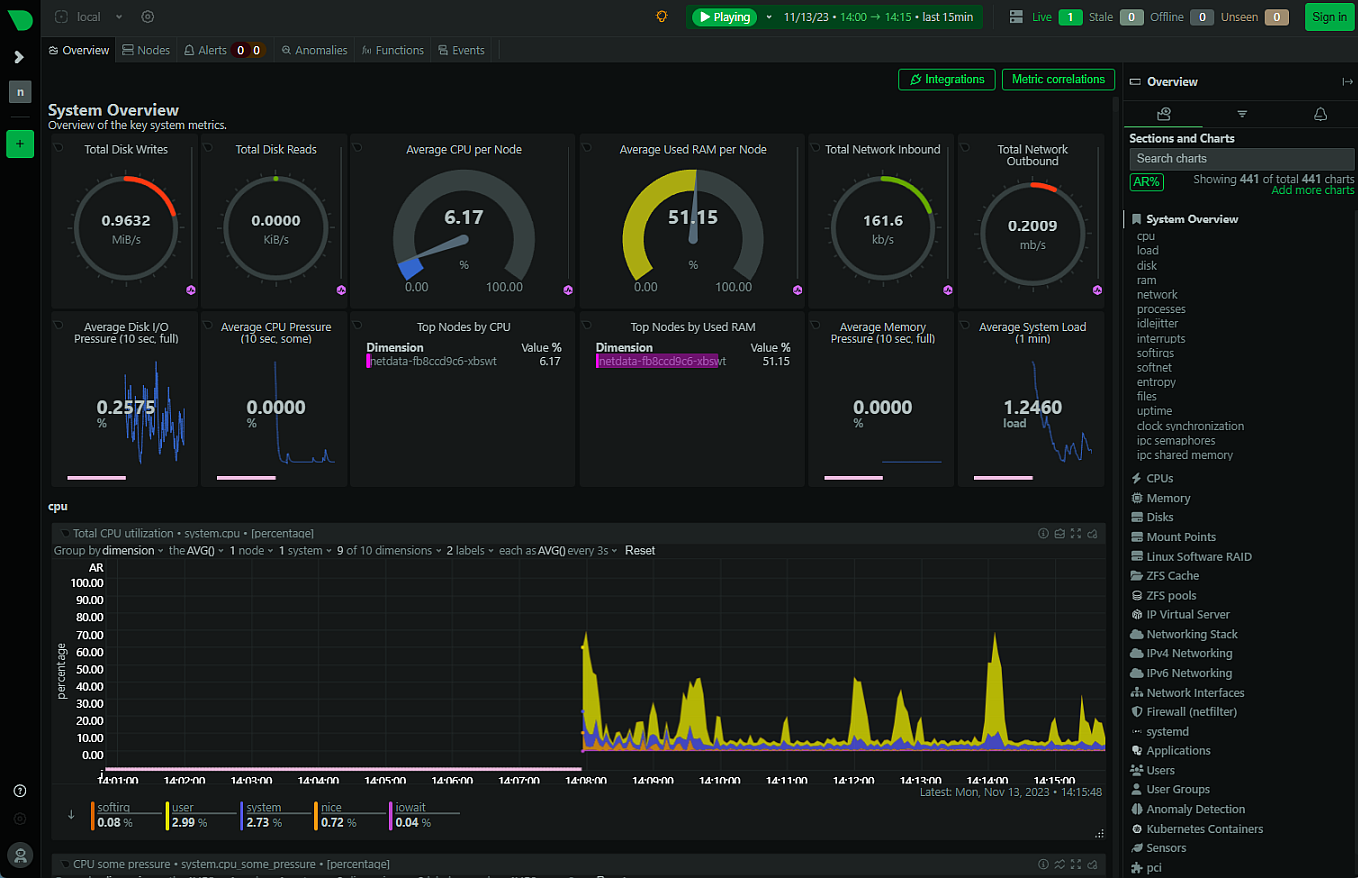
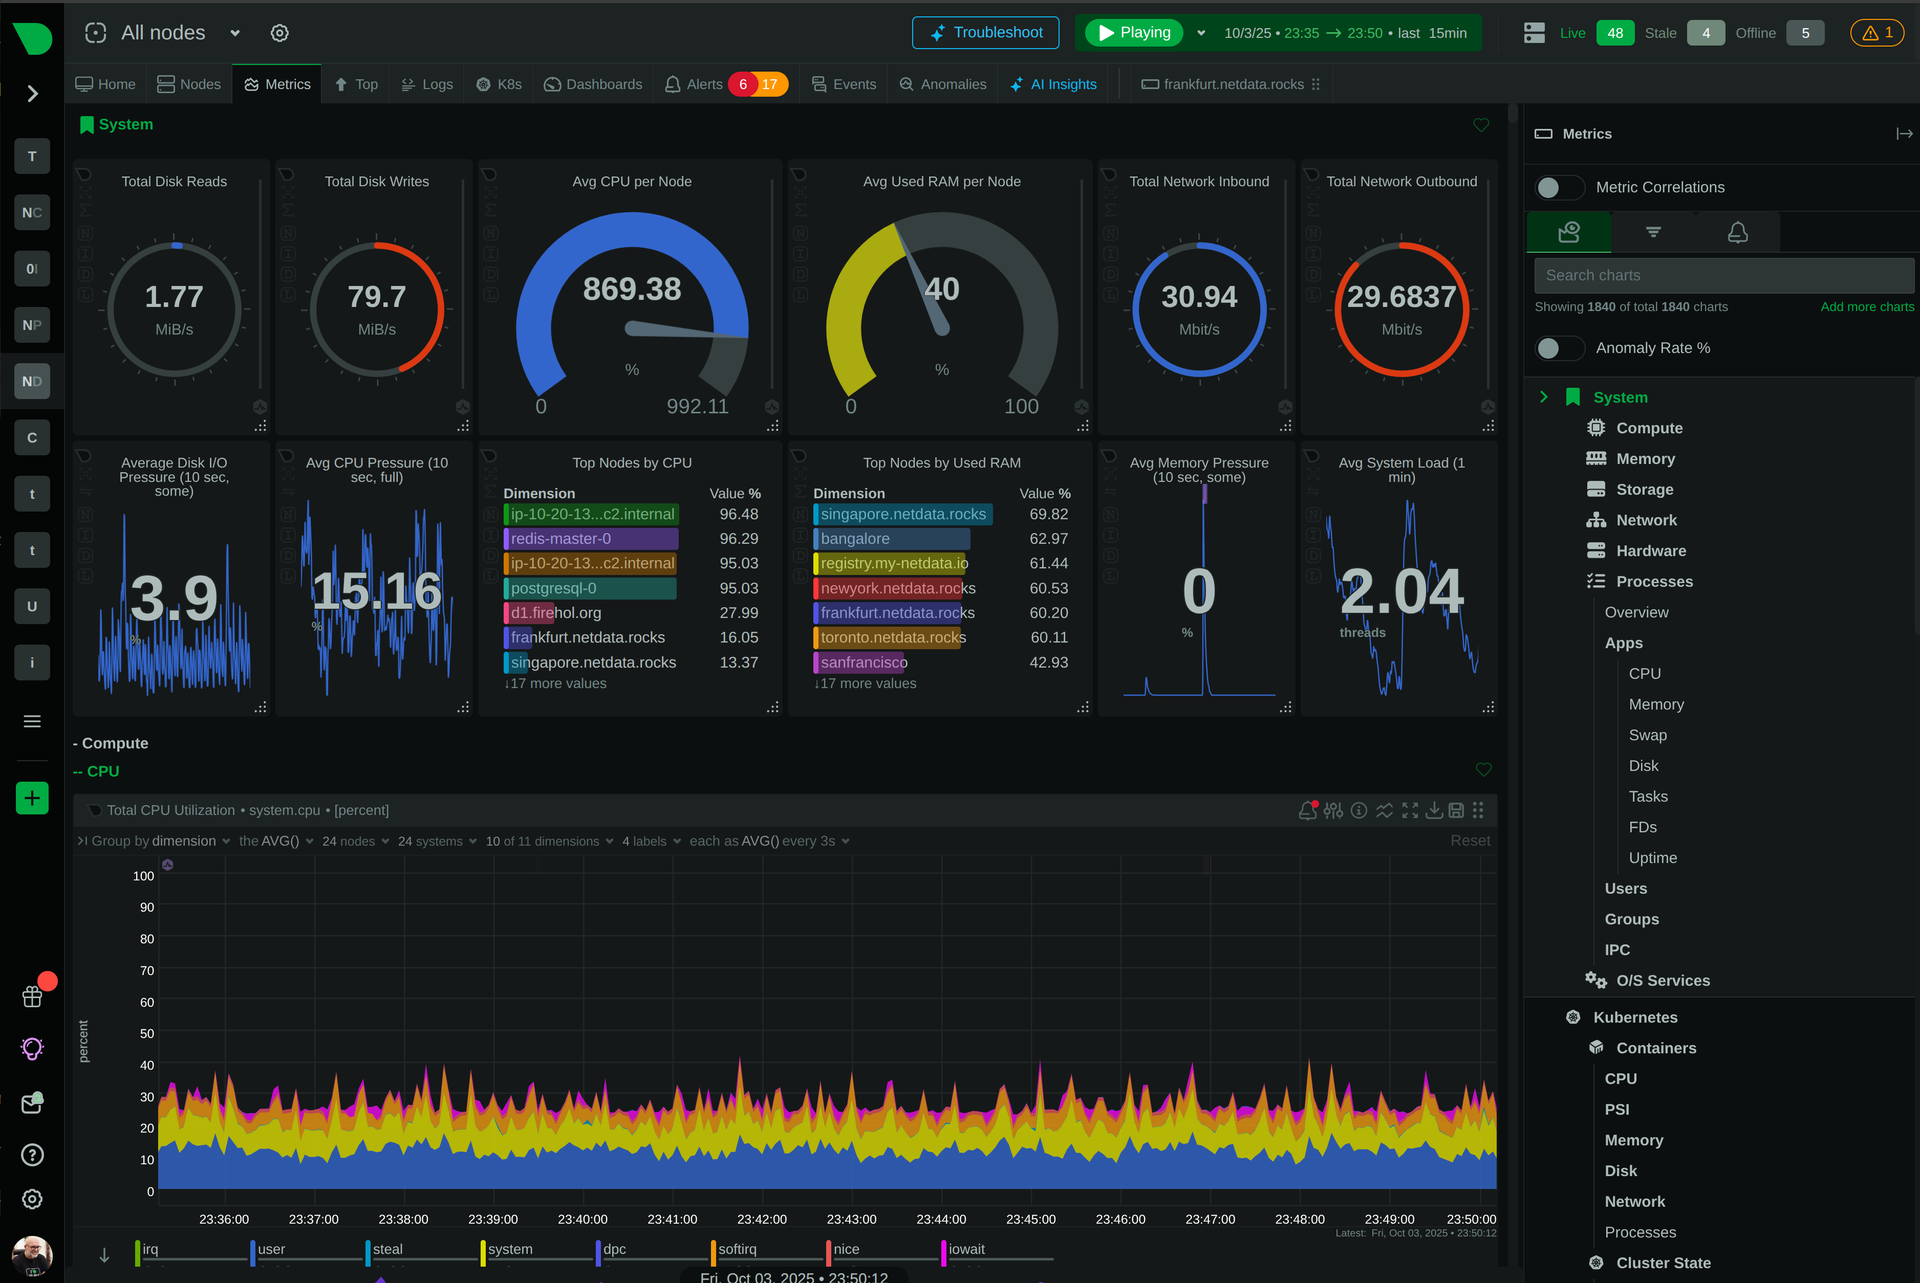
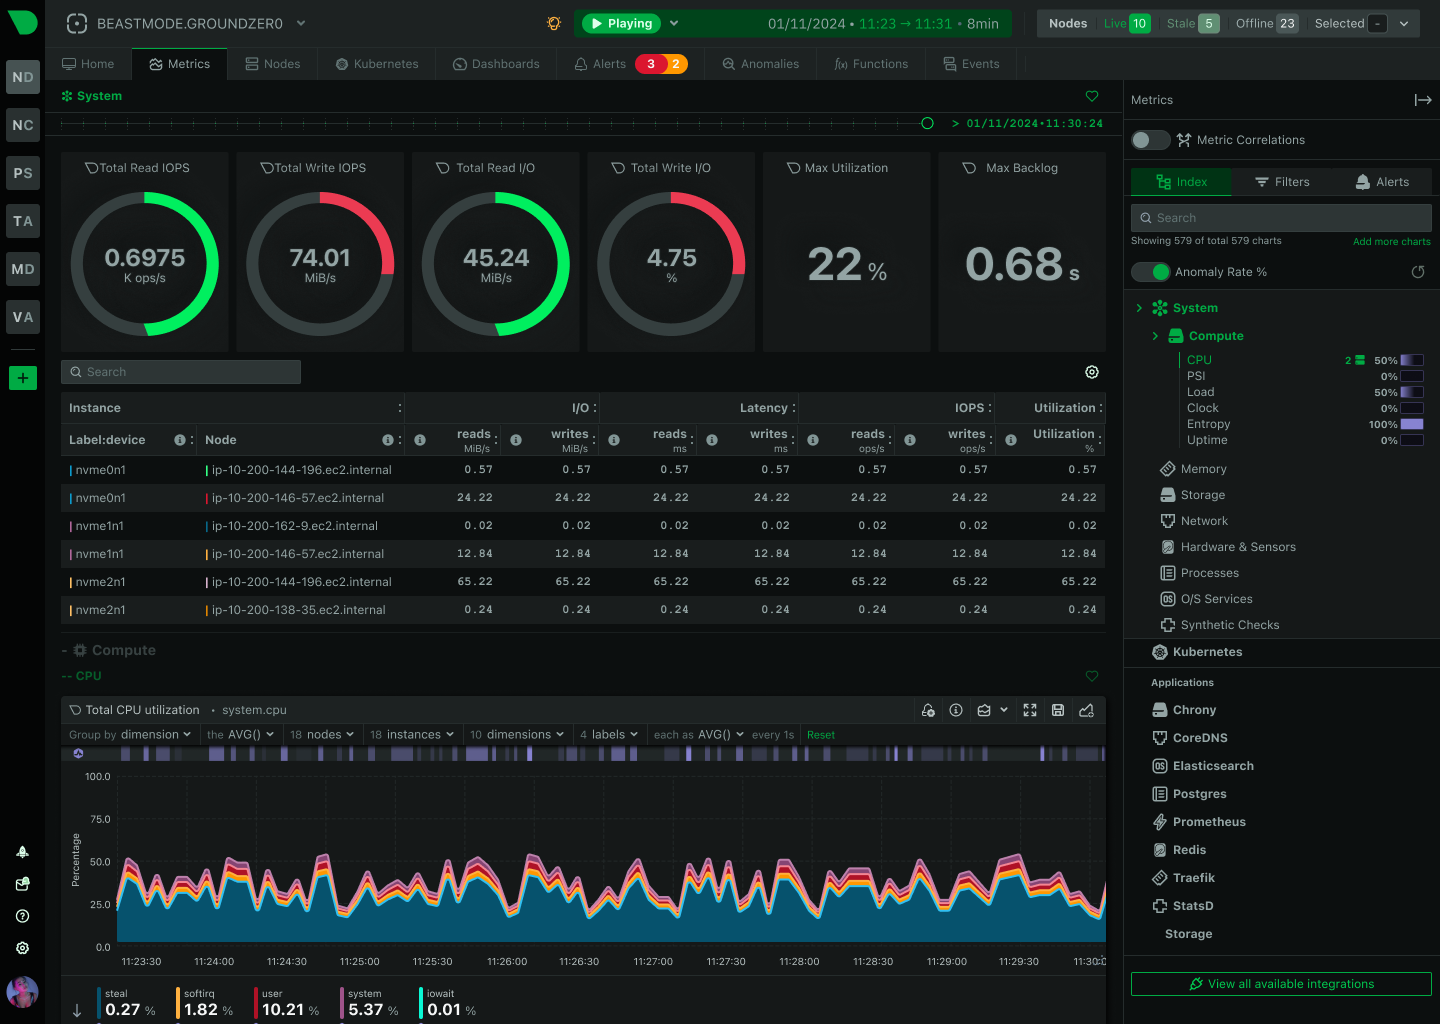
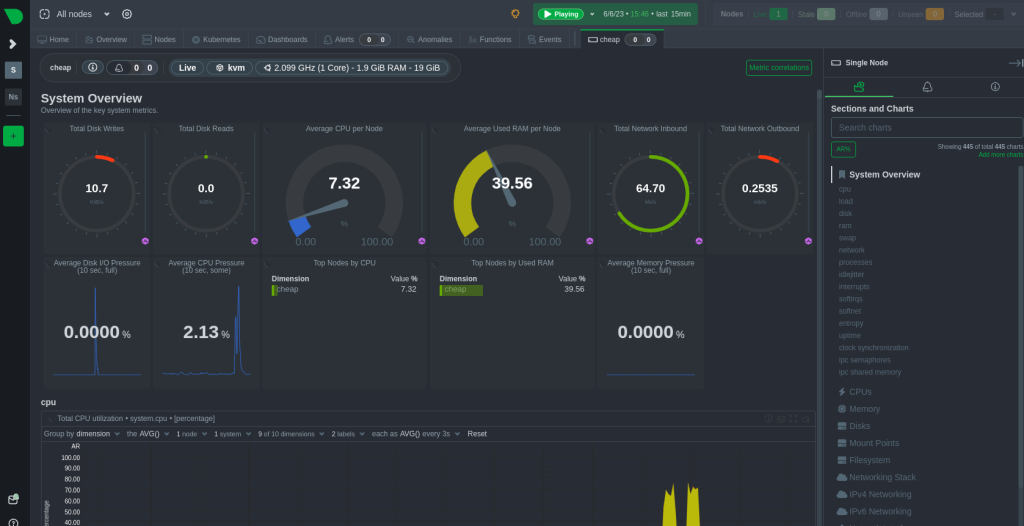
- Rich interactive visualizations with slice-and-dice exploration across thousands of metrics, zero query language required, and automatic chart correlation for root cause analysis.
- Network Monitoring
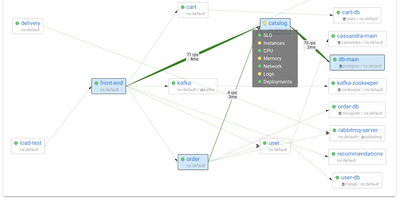
- Live topology maps, NetFlow/sFlow analytics, SNMP device polling across 200+ profiles, and trap handling provide NPM-class network observability within the same platform.
- eBPF Kernel Observability
- Extended Berkeley Packet Filter instrumentation traces system calls, file operations, network connections, and process behavior at kernel level without application code changes.
- Tiered Storage Engine
- Custom time-series database stores metrics at approximately 0.5 bytes per sample with hot, warm, and cold tiers, enabling years of retention on modest disk without external databases.
- Container and Kubernetes Native
- Automatic cgroups-based discovery monitors every Docker container and Kubernetes pod with per-second metrics, labels, and resource attribution requiring no sidecars or instrumentation.
- AI-Powered Analysis
- MCP-compatible AI integration enables natural language queries against observability data, automated incident playbooks, and root cause analysis surfacing top correlated anomalous metrics.