Categories
Self-Hosted Observability Kubernetes Alerting Prometheus Site Reliability SLO Monitoring Error BudgetsStars
Forks
Watchers
Developer links
Pyrra
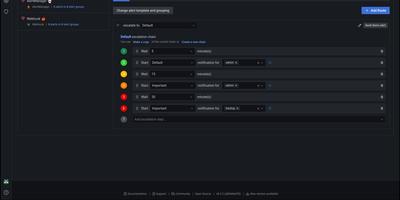
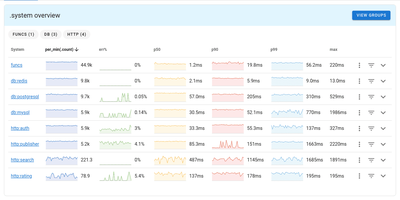
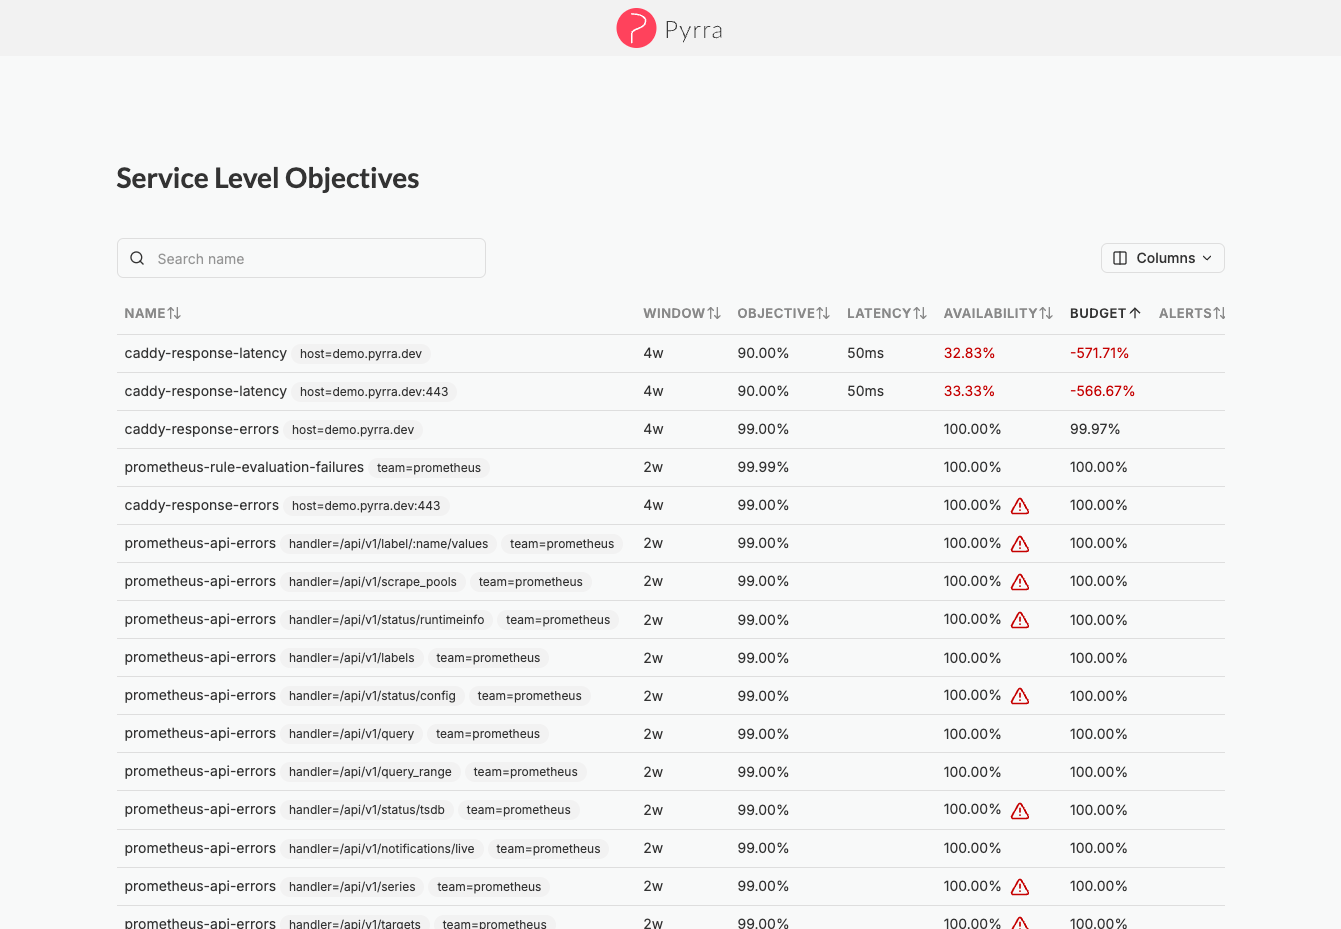
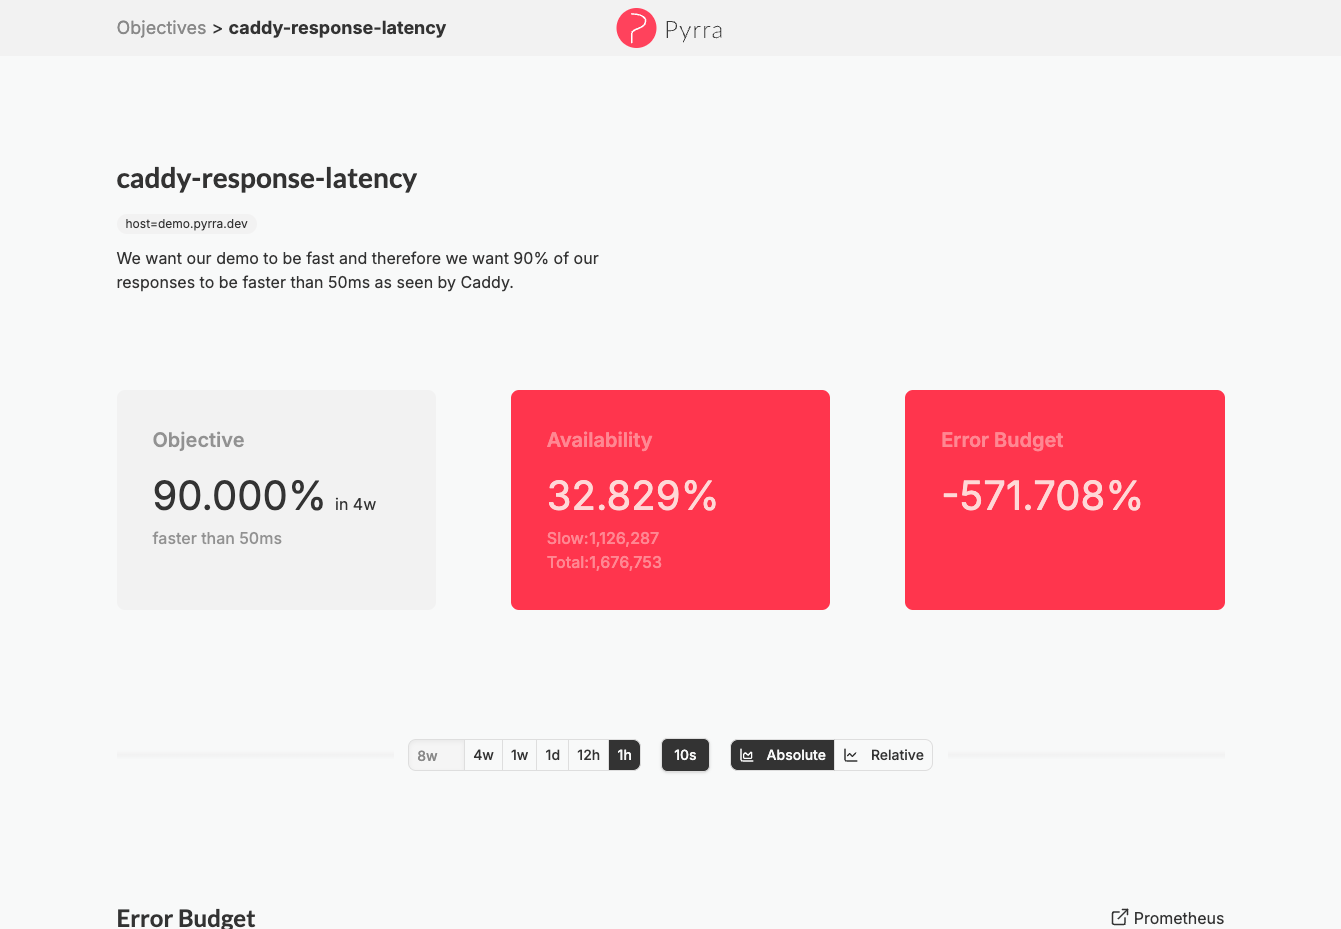
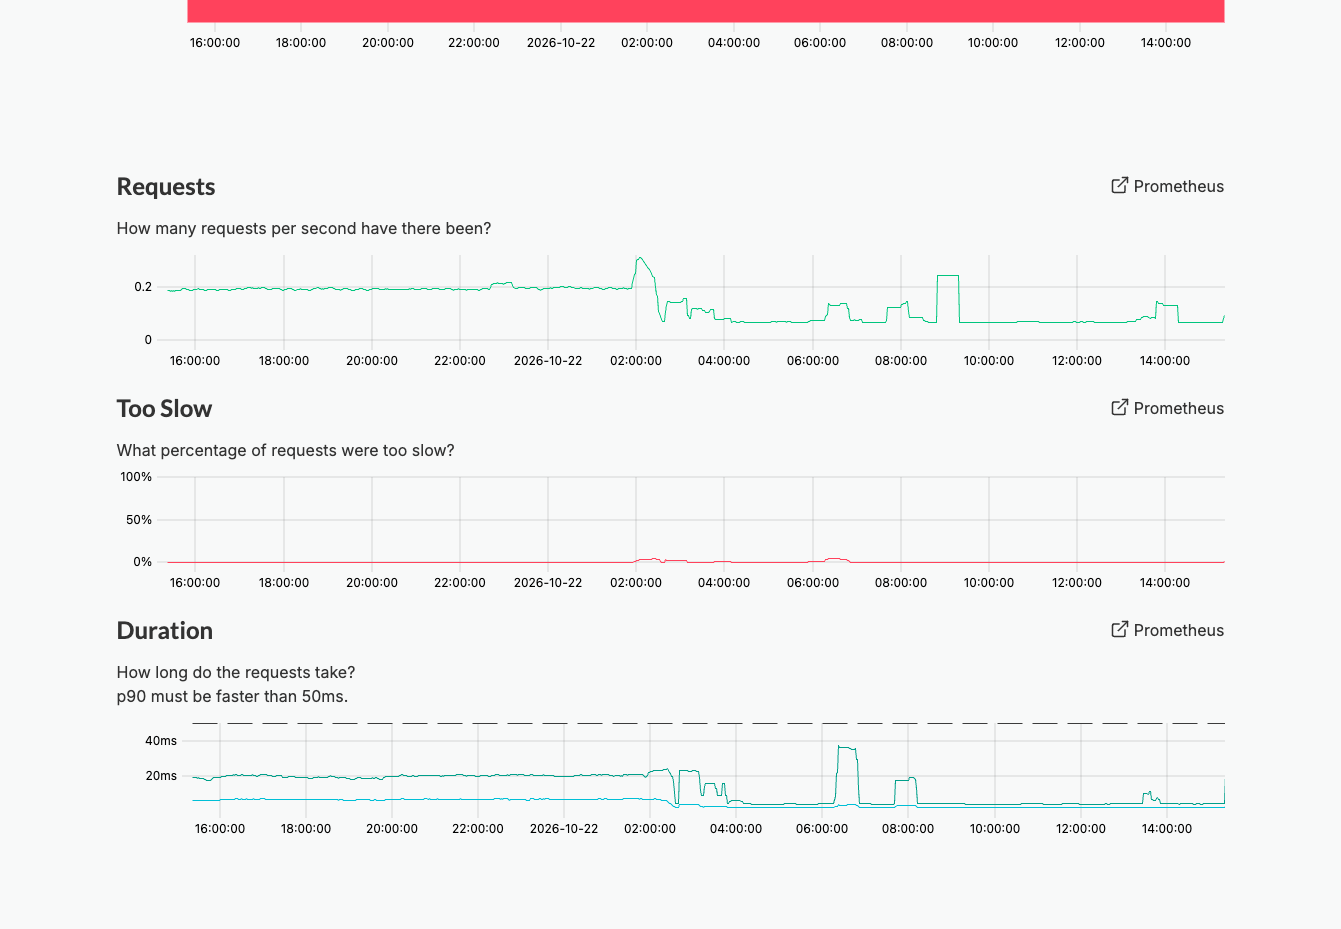
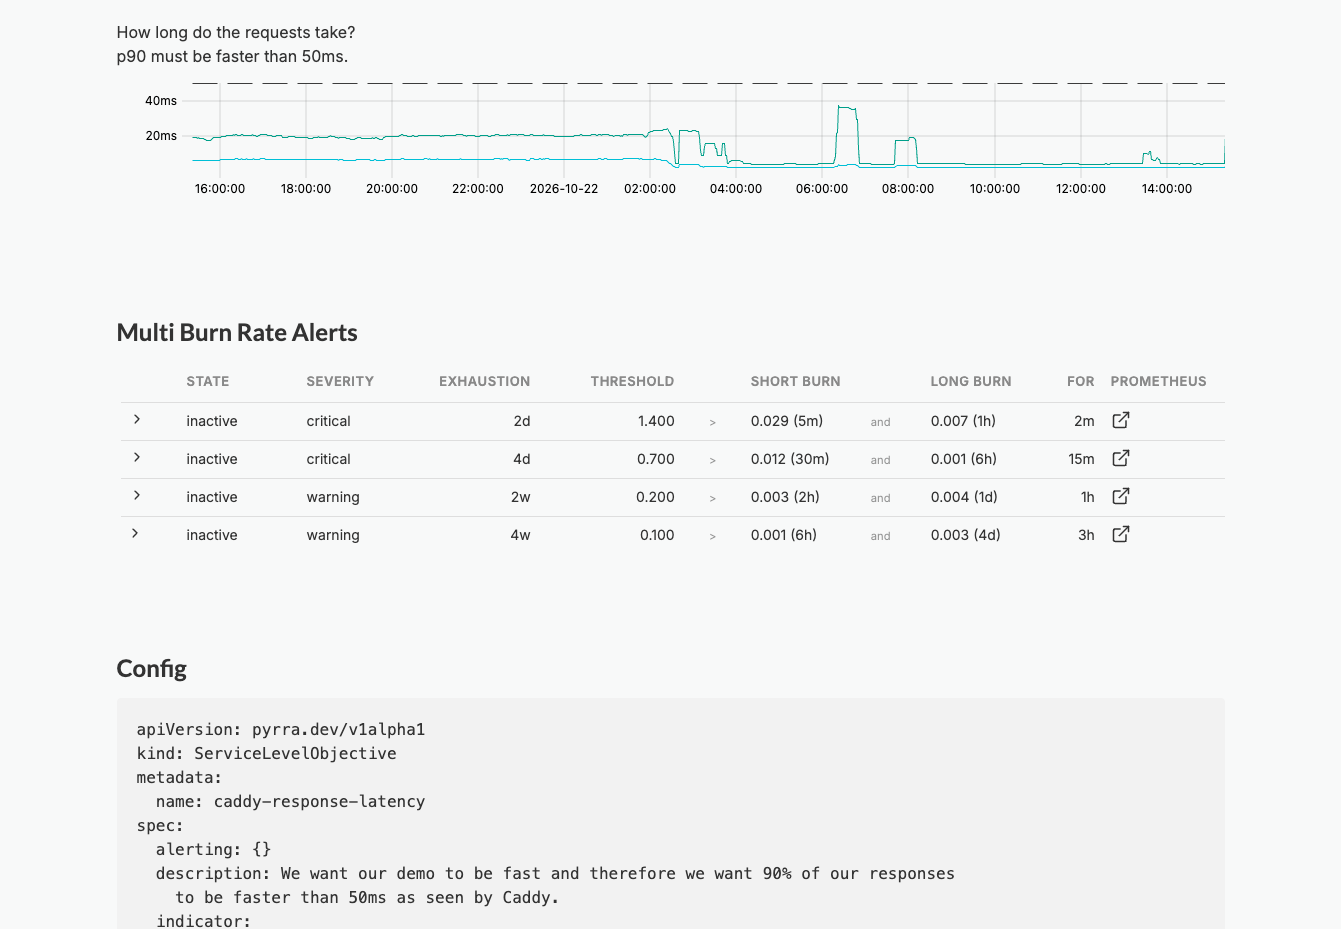
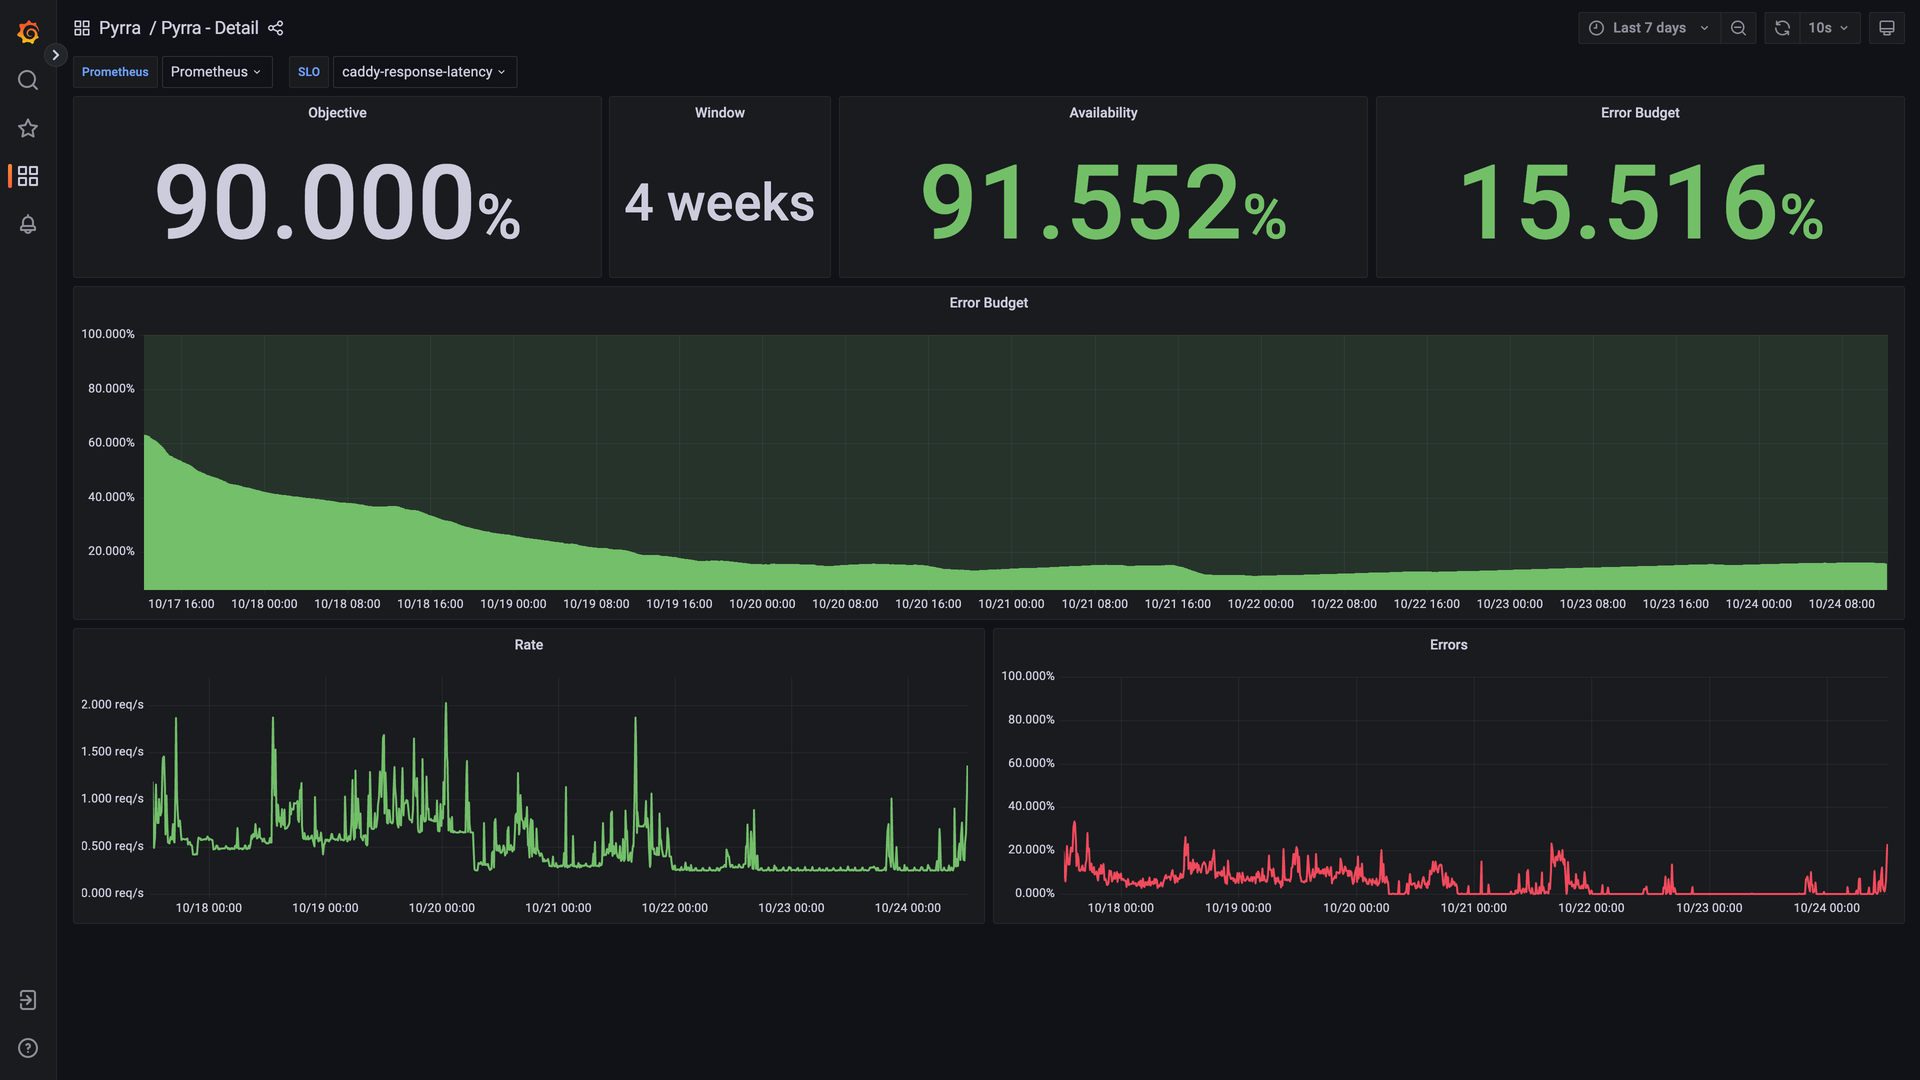
Define a service level objective in a few lines of YAML and Pyrra writes the Prometheus recording rules and multi-window burn rate alerts for it, then tracks the remaining error budget in a web interface. An objective can be an error ratio or a latency target, declared as a Kubernetes custom resource or as a plain file read from disk when running under Docker or as binaries. Grouping labels fan one definition out into an objective per route or handler. The objectives page lists each SLO with its window, target, availability, and remaining budget, sorted so the worst offenders sit on top; columns can be sorted or hidden, and a search box or a click on any label filters the list. Opening an objective highlights availability and error budget, plots the budget over time, and charts requests, errors, and duration with a time range picker and absolute or relative scales. Below the charts, a table shows the four generated alerts with their severities. Generated alerts carry a link back to the objective's page, and severities can be overridden in the spec. Queries go to Prometheus, Thanos, or Mimir, with basic auth, bearer tokens, or tenant IDs, and ready-made Grafana dashboards chart the same objectives. Running on a dedicated VPS on RepoCloud with guaranteed CPU, RAM, and SSD, full root SSH access, and a browser serial console. Apache-2.0 licensed.
Benefits
- SLOs without hand-written PromQL
- Each objective is a short YAML definition with a target, window, and error or latency indicator. Pyrra writes the matching Prometheus recording rules, so nobody maintains burn rate queries by hand.
- Alerts tied to budget burn
- Four multi-window burn rate alerts per objective carry different severities and fire on how fast the error budget is being spent, instead of on a single metric threshold.
- Spot the riskiest objectives first
- The objectives list sorts by remaining error budget, offers name search and one-click label filters, and lets you sort or hide columns, so the most at-risk services stay on top.
- Fits the stack you already run
- Deploy on Kubernetes with an operator or Helm chart, or under Docker and as plain binaries reading YAML from disk, and query Prometheus, Thanos, or Mimir with basic auth, bearer tokens, or tenant IDs.
Features
- YAML-defined objectives
- Declare a target, window, and error ratio or latency indicator as a Kubernetes custom resource or a plain file, with grouping labels that create one objective per route or handler.
- Generated rules and alerts
- Pyrra writes Prometheus recording rules for every objective, creates four multi-window burn rate alerts with different severities, and lets severities be overridden directly in the spec.
- Objectives list and filters
- Search by name or label, click a label to filter, sort any column, and hide the ones you do not need; rows are ordered by remaining error budget.
- Detail pages with RED charts
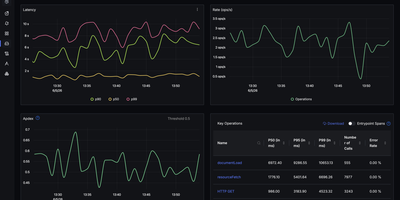
- Availability and error budget lead the page, followed by an error budget graph, request, error, and duration charts, a time range picker, and absolute or relative scales.
- Prometheus-compatible backends
- Query Prometheus, Thanos, or Mimir with basic authentication, bearer tokens, custom CA files, or tenant IDs; Thanos queries add downsampling headers and disable partial responses.
- Grafana dashboards included
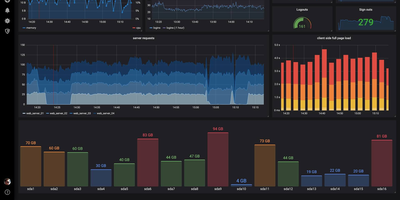
- Generic rules generation produces a Grafana dashboard for every objective, and the interface can link out to Grafana Explore instead of Prometheus for deeper query work.