SaaS Alternative
Datadog Continuous Profiler Polar Signals Cloud Grafana Cloud Profiles Google Cloud ProfilerCategories
self-hosted devops observability continuous-profiling performance-monitoring ebpf flame-graph pprofStars
Forks
Watchers
Developer links
Parca
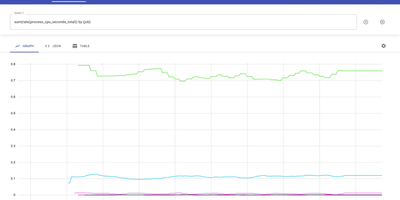
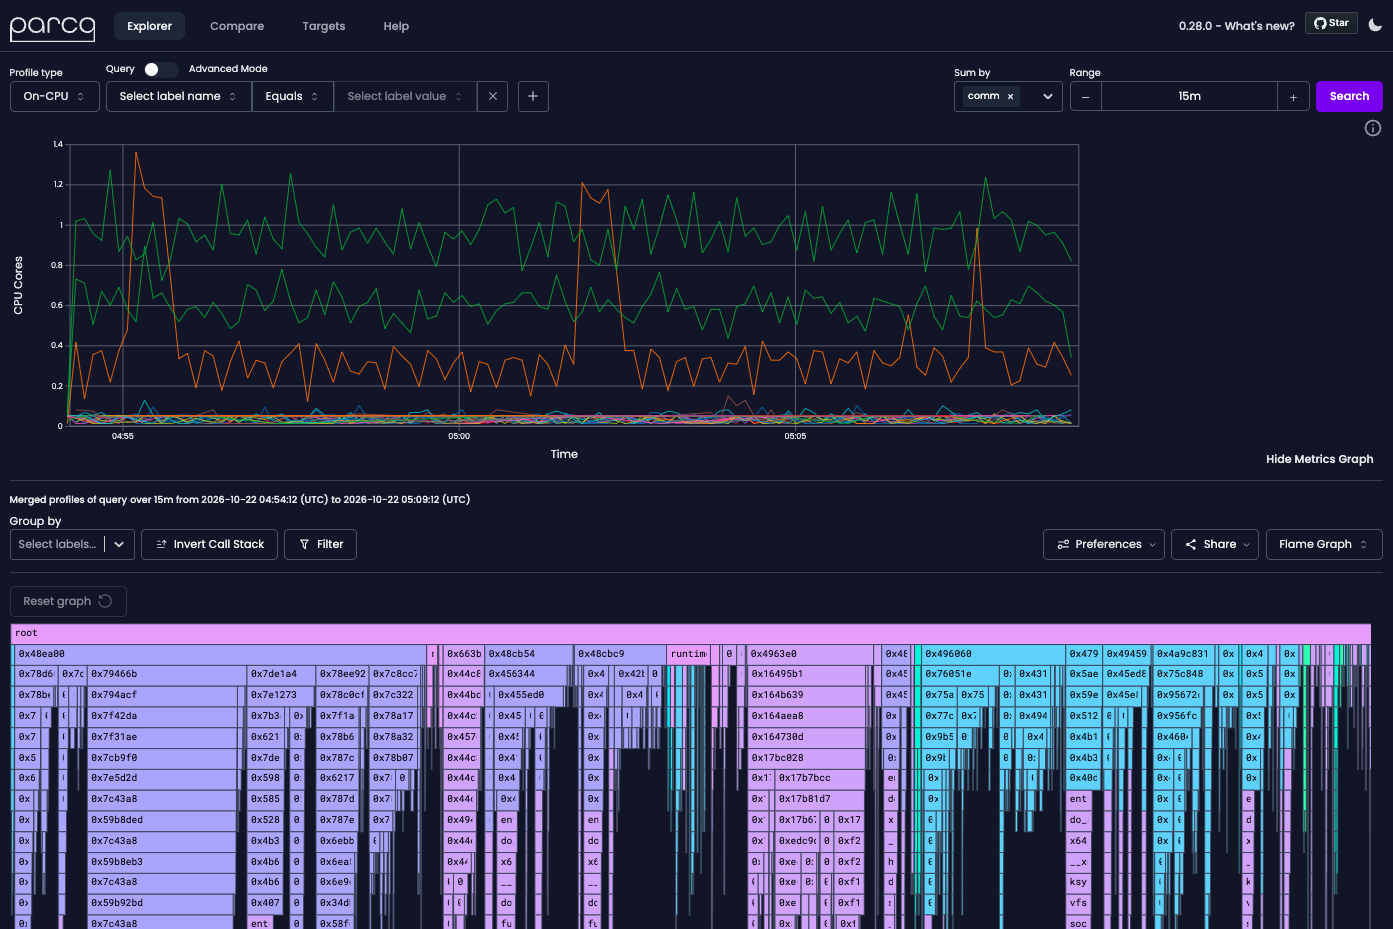
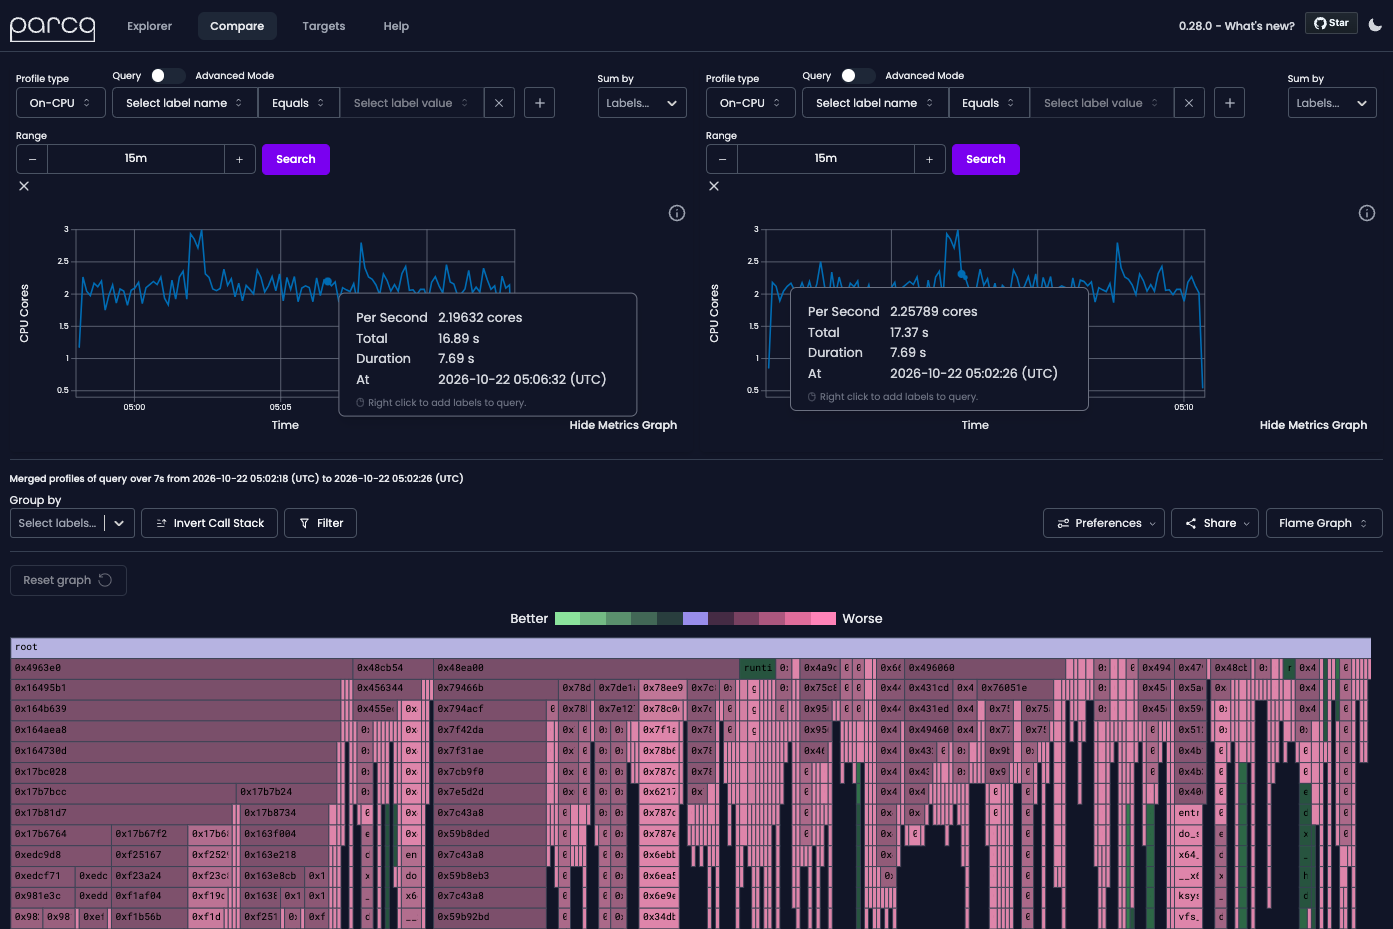
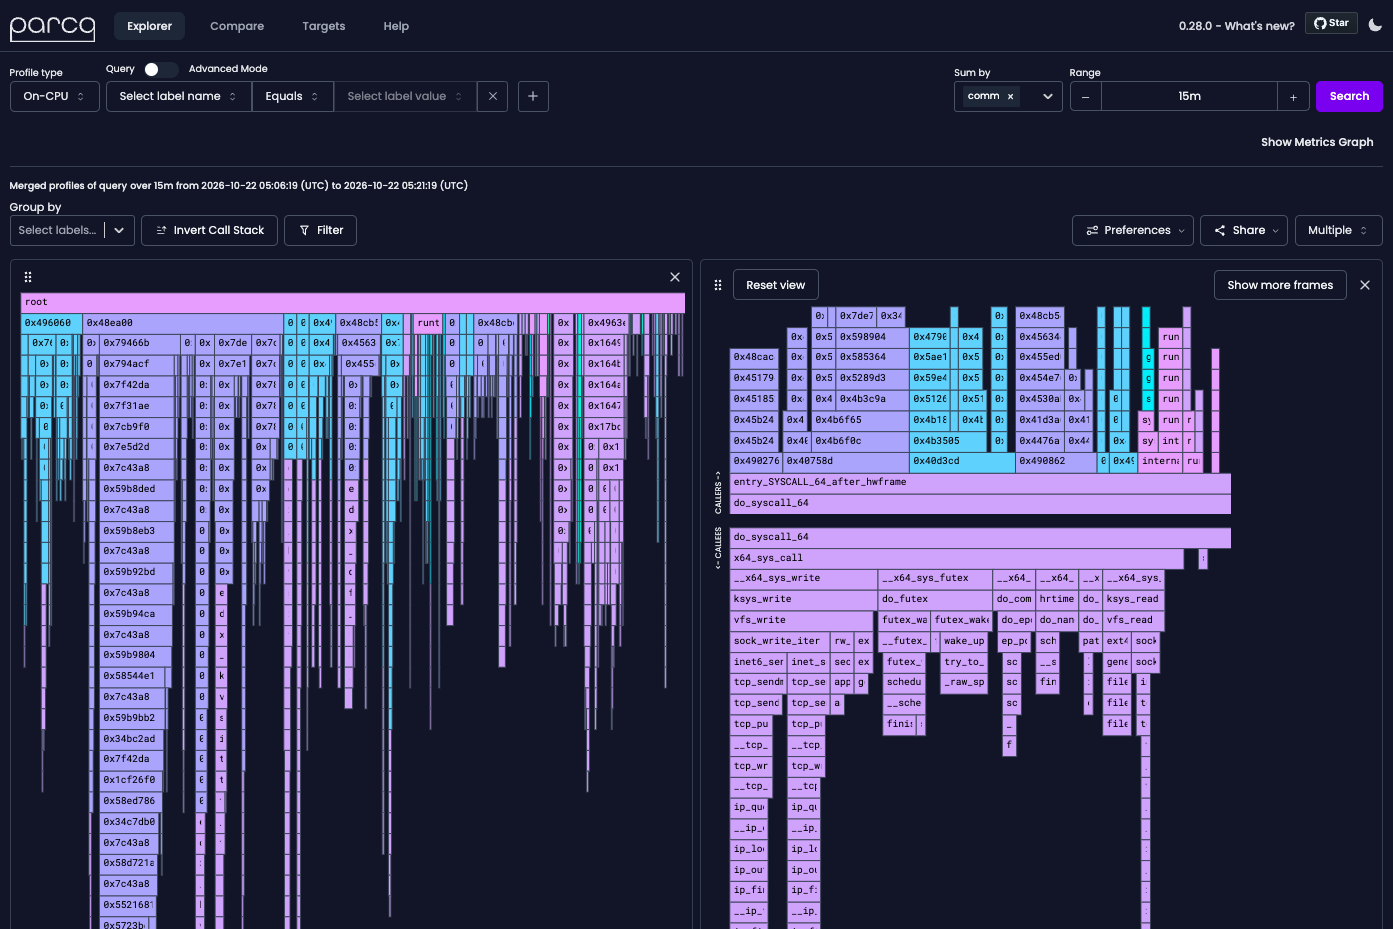
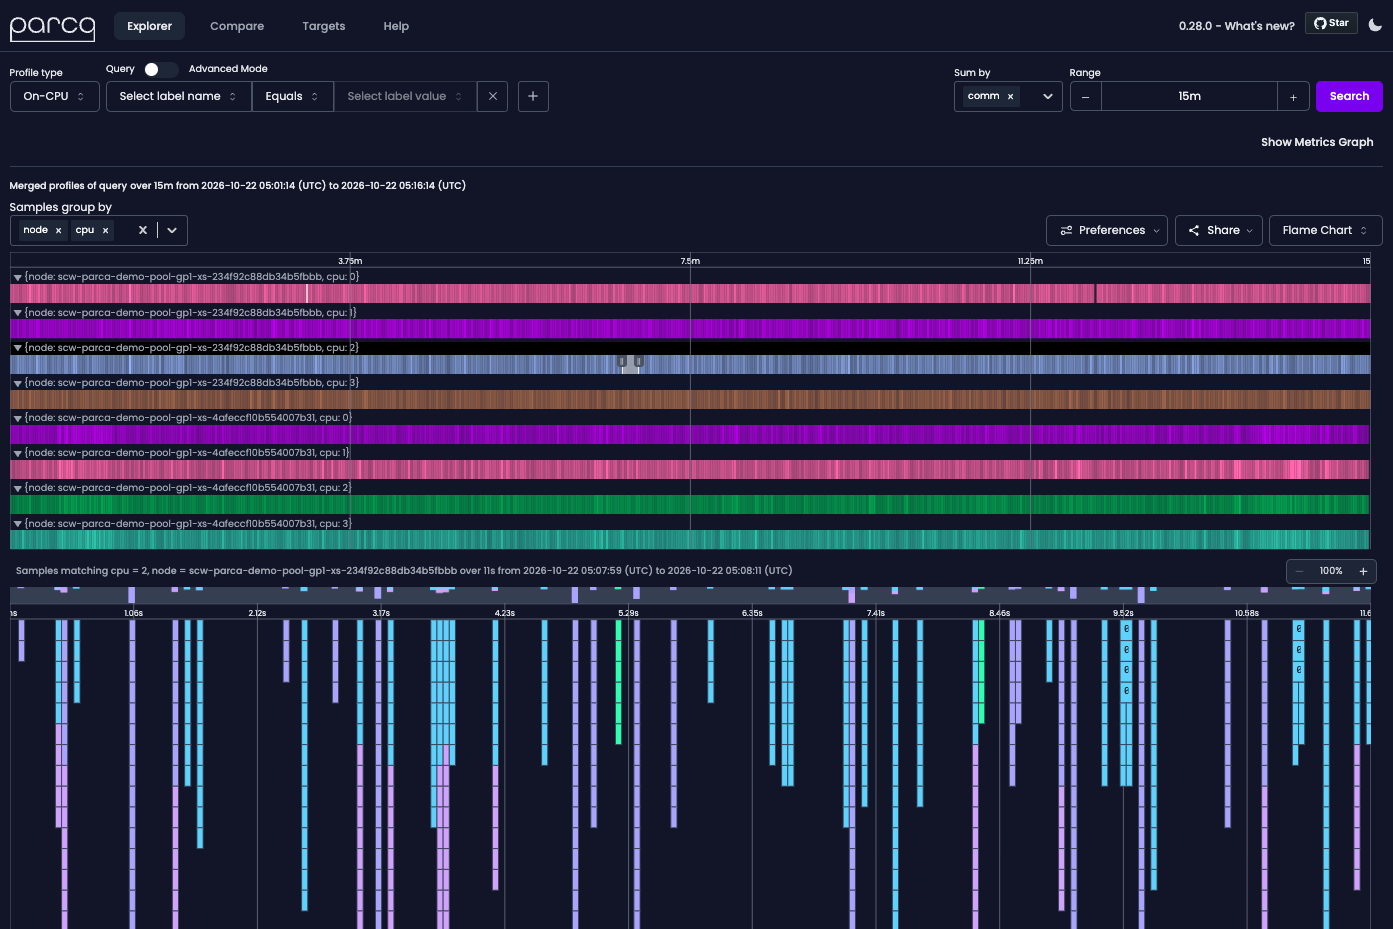
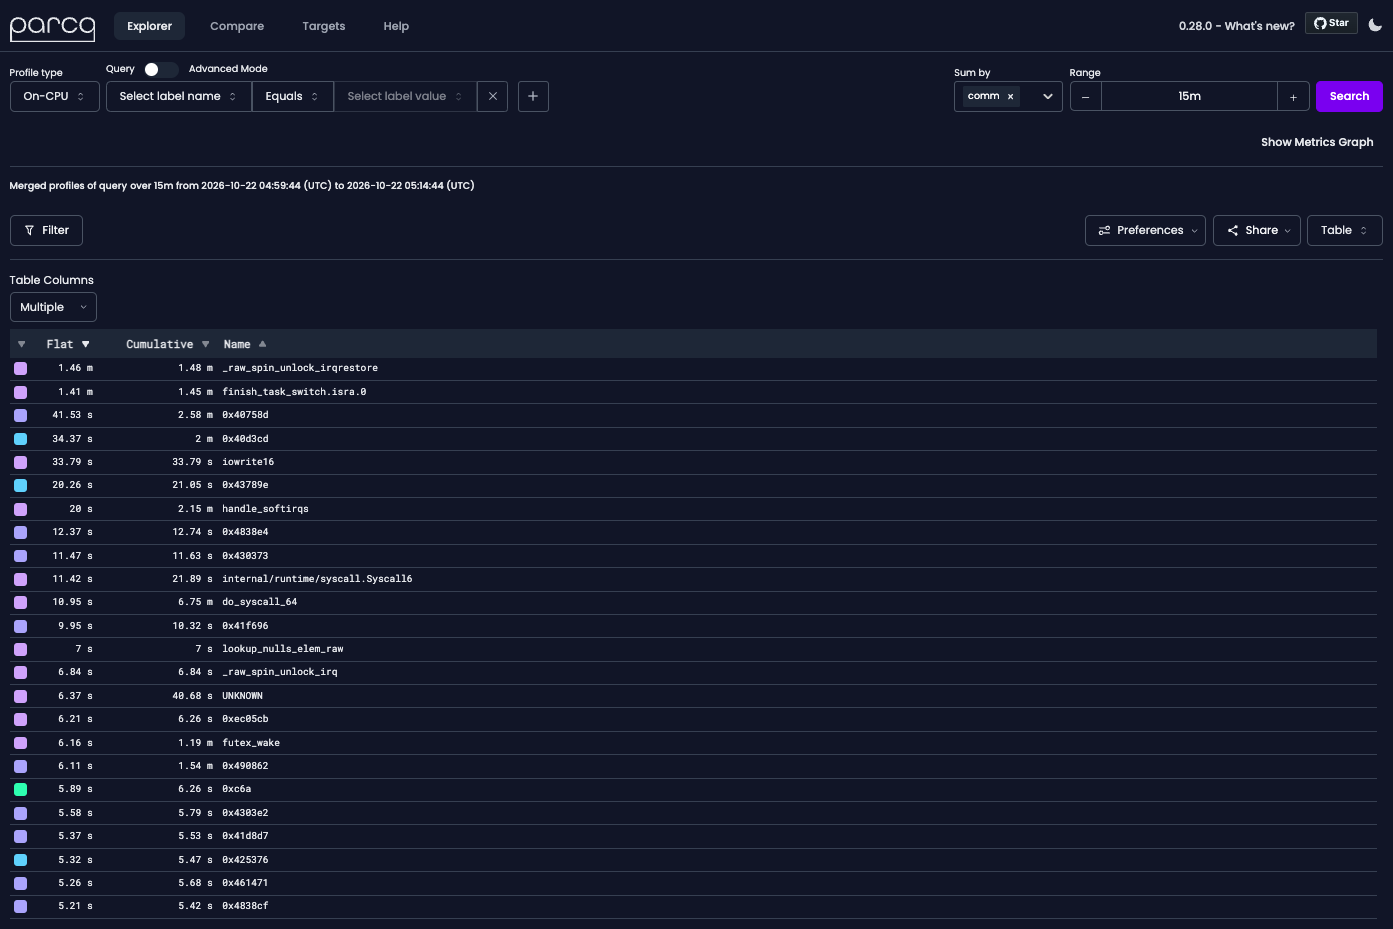
A flight recorder for production code, Parca profiles CPU and memory continuously and keeps the history to query after something breaks. A slow memory leak or a momentary CPU spike is already on record by the time anyone looks. Point it at any service that exposes pprof endpoints, or deploy the eBPF-based Parca Agent to profile every process on a Linux host or Kubernetes node without touching application code. The agent covers C, C++, Rust, Go, and more. In the web UI, pick a profile type such as on-CPU, narrow it with Prometheus-style label selectors, sum or group by any label, and click a point on the time series to open its flame graph. Switch the same query to a table, add extra panels, or try the alpha Flame Chart and Sandwich views. After a deploy, open the Compare page, set two queries side by side by label or time range, and the functions that gained or lost CPU time stand out as a diff. Native binaries are symbolized from uploaded debuginfo or upstream debuginfod servers. Recent releases add support for OpenTelemetry eBPF profiler profiles and GPU profile types. Optional persistence keeps history across restarts, and a Prometheus-style scrape configuration with service discovery decides what gets profiled. Running on a dedicated VPS on RepoCloud with guaranteed CPU, RAM, and SSD, full root SSH access, and a browser serial console. Apache-2.0 licensed.
Benefits
- Profile Everything Without Code Changes
- The eBPF-based Parca Agent discovers targets from Kubernetes or systemd and profiles C, C++, Rust, Go, and more across the whole fleet with very low overhead and zero instrumentation.
- Find Regressions With One Comparison
- Compare any two label sets or time ranges, such as before and after a deploy, and see which functions gained or lost CPU time instead of guessing from dashboards.
- History Ready When Incidents Strike
- Always-on sampling at low overhead means the profile of last night's CPU spike or slow memory leak is already stored, so you can query it after the incident.
- Open pprof Format, Familiar Queries
- Parca validates and stores upstream pprof profiles, so existing Go endpoints work unchanged, and its label-selector data model follows Prometheus conventions that operators already know.
Features
- Flame Graph Explorer
- Query by profile type and Prometheus-style label selectors, sum or group by labels, then drill into an interactive flame graph with invert-call-stack and filter controls.
- Multiple Views And Panels
- Switch the same query between flame graph, table, and the alpha Flame Chart and Sandwich views, and add extra panels to inspect them together.
- Profile Comparison
- A dedicated Compare page diffs two queries by label or time range, highlighting where CPU or memory use changed between deploys, versions, or regions.
- Pull And Push Ingestion
- Scrape pprof HTTP endpoints from statically configured or service-discovered targets with Prometheus-style scrape_configs, or receive profiles over gRPC from the Parca Agent.
- FrostDB Columnar Storage
- Samples go to FrostDB, a columnar database built for observability, while function and line metadata sit in an embedded Badger store; optional persistence survives restarts.
- Symbolization And GPU Profiles
- Native stacks are symbolized from uploaded debuginfo or upstream debuginfod servers, and v0.29 adds GPU profile types with tooltips for SASS and stall frames.