Categories
self-hosted devops observability siem opentelemetry log-management log-database elasticsearch-alternativeStars
Forks
Watchers
Developer links
VictoriaLogs
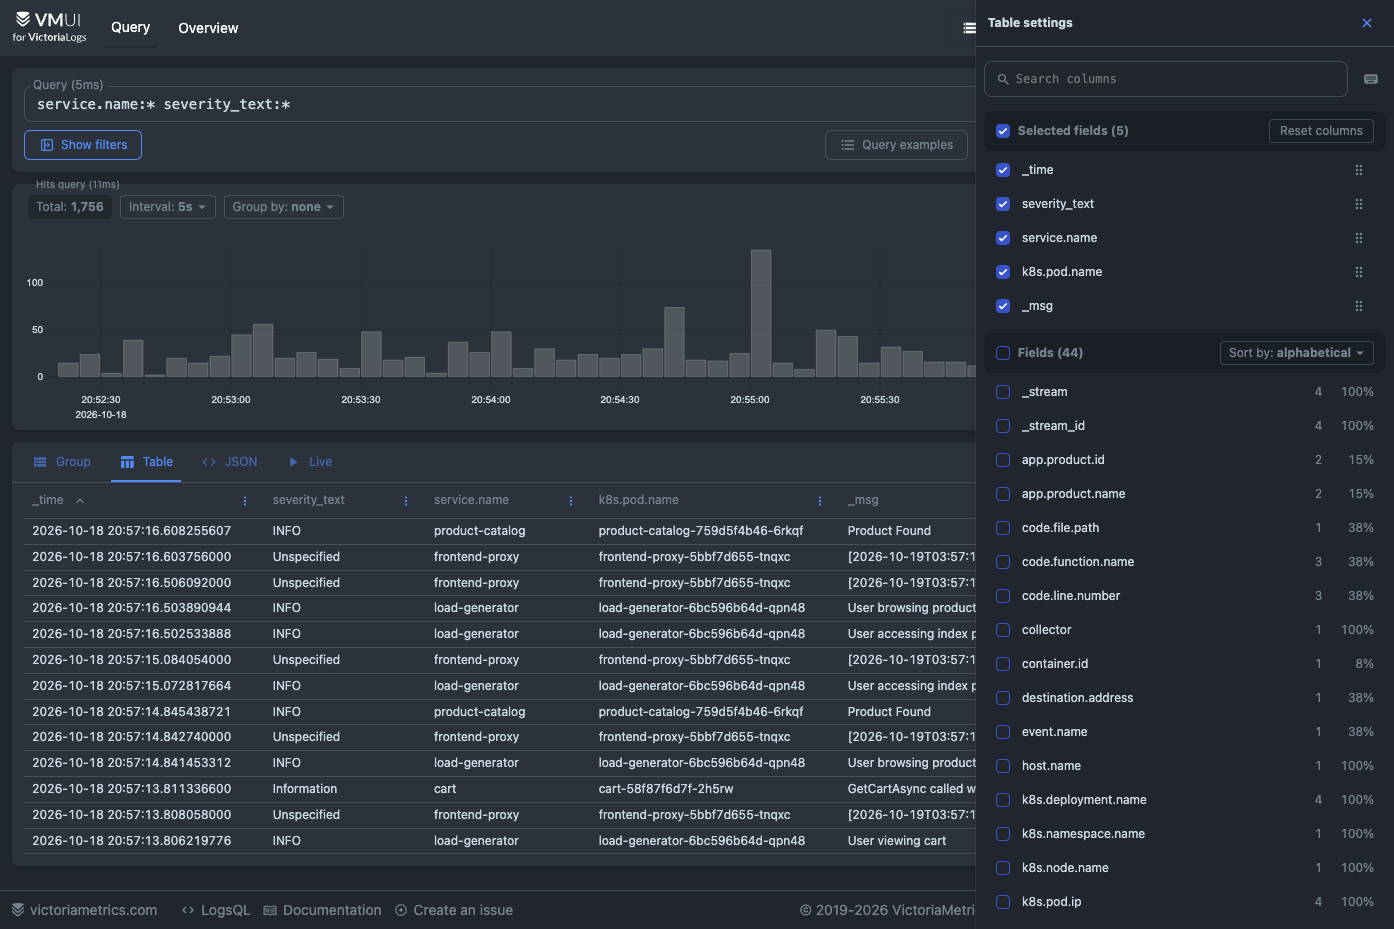
Instead of running an Elasticsearch or Loki cluster, VictoriaLogs stores and searches your logs from a single zero-config server. Ship from Filebeat, Fluent Bit, Fluentd, Logstash, Vector, Promtail, Telegraf, the OpenTelemetry Collector, or the Datadog Agent. Syslog, journald, and Splunk endpoints work too. Query with LogsQL: word, phrase, and prefix filters combine with pipes that extract fields from raw lines and compute stats, top values, and facets. See results as a table, grouped by stream, as raw JSON, or as a live tail. Chart them in Grafana, or work from a terminal with vlogscli and pipe output into grep, less, or jq. Events with hundreds of fields are supported. So are high-cardinality fields like trace_id and user_id. Late, out-of-order backfills are accepted. During an incident, stream_context pulls the lines around any match. Tenants are keyed by AccountID and ProjectID headers. vmalert evaluates LogsQL queries as alerting and recording rules. CEF messages sent over Syslog are parsed automatically for SIEM work. Retention defaults to 7 days and can be capped by disk space. Per-day partitions snapshot and copy out with rsync or rclone. Cluster mode splits ingestion, querying, and storage across nodes for logs that outgrow one server. Running on a dedicated VPS on RepoCloud with guaranteed CPU, RAM, and SSD, full root SSH access, and a browser serial console. Apache 2.0 licensed.
Benefits
- Far Lighter Than Elasticsearch Or Loki
- Project benchmarks report up to 30x less RAM and up to 15x less disk space than Elasticsearch and Grafana Loki, and logs usually compress by 10x or more on disk.
- Start Fast With Zero Configuration
- A single self-contained binary starts with no arguments, listens on port 9428, writes to one data directory, and adjusts its defaults automatically to the CPU and RAM available.
- Keep Your Existing Log Shippers
- Filebeat, Fluent Bit, Fluentd, Logstash, Vector, Promtail, Telegraf, Datadog Agent, and the OpenTelemetry Collector all have documented setups that send their logs to VictoriaLogs.
- Predictable Retention And Disk Usage
- Retention defaults to 7 days and accepts 1 day to 100 years, and optional disk space or disk percentage limits automatically drop the oldest per-day partitions when exceeded.
Features
- LogsQL Query Language
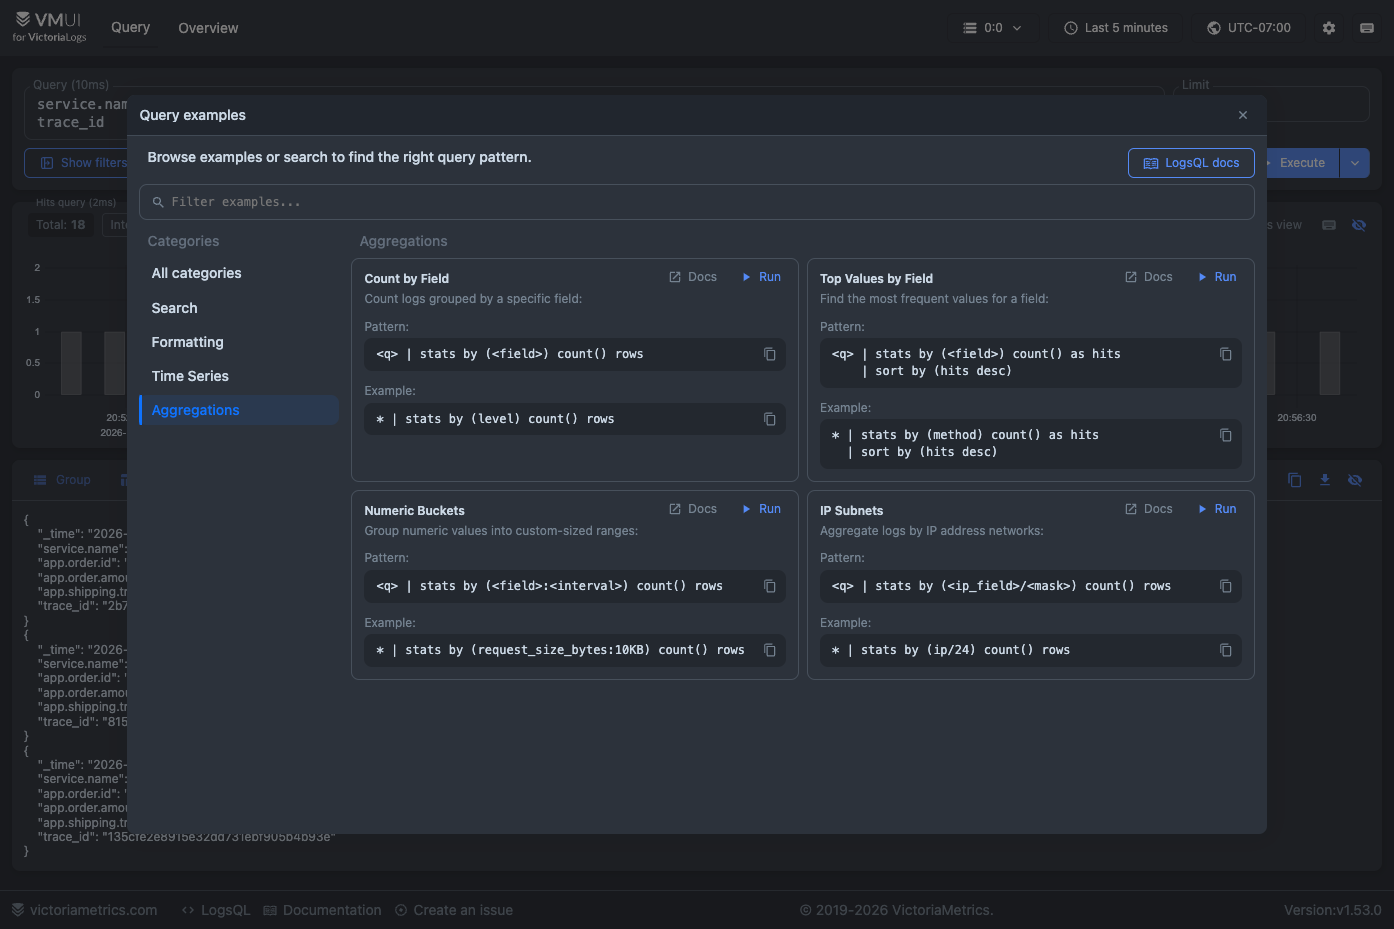
- LogsQL combines word, phrase, and prefix filters with pipes such as extract, stats, top, and facets to pull fields from raw lines and aggregate them at query time.
- Built-In Web UI
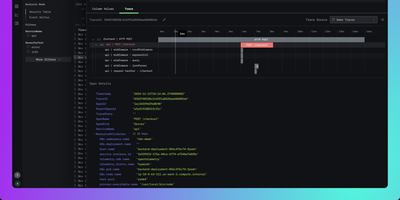
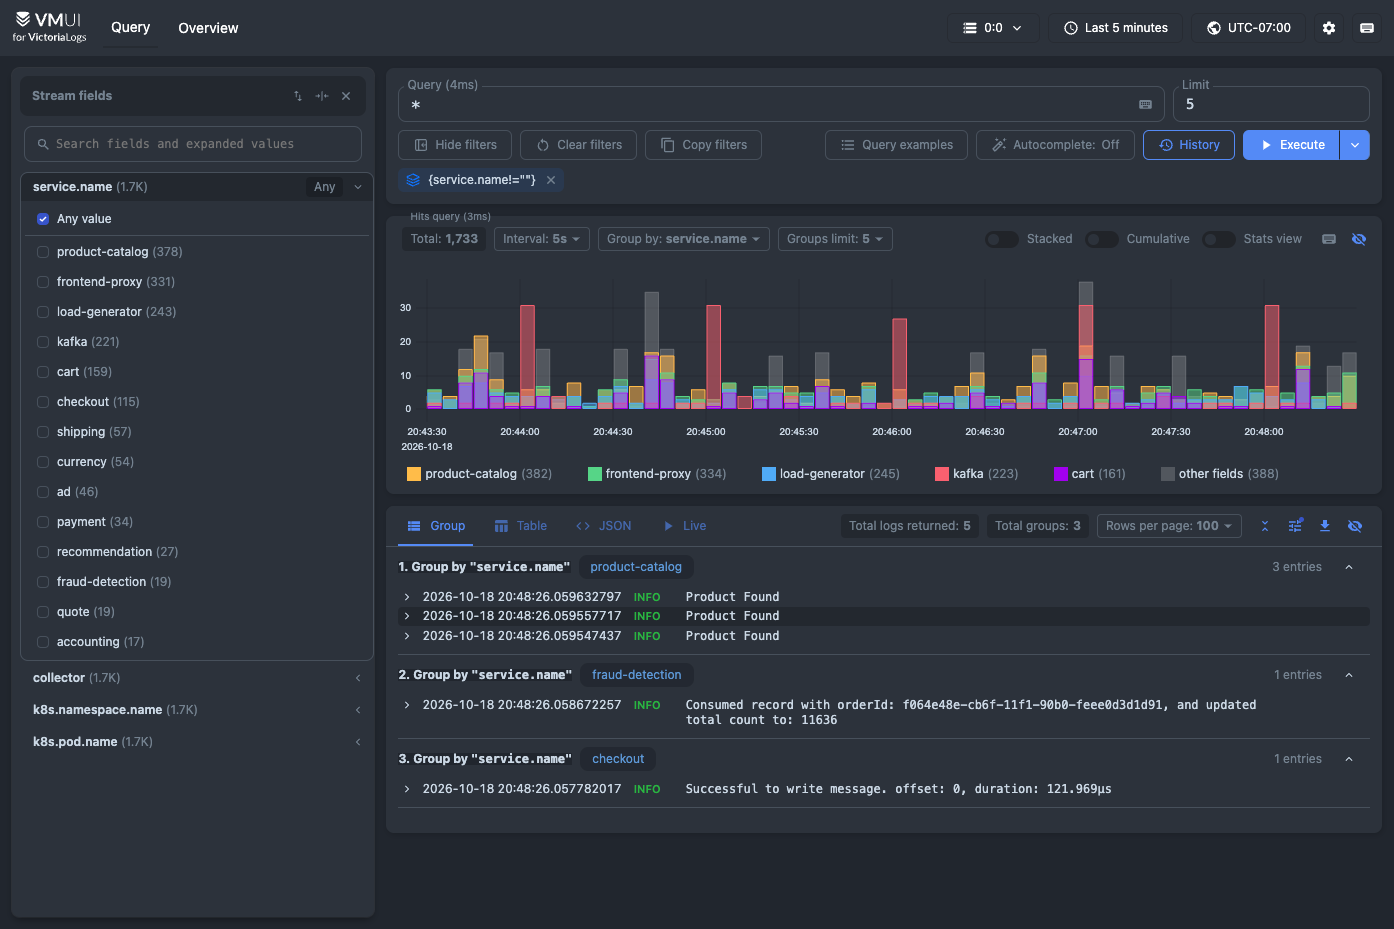
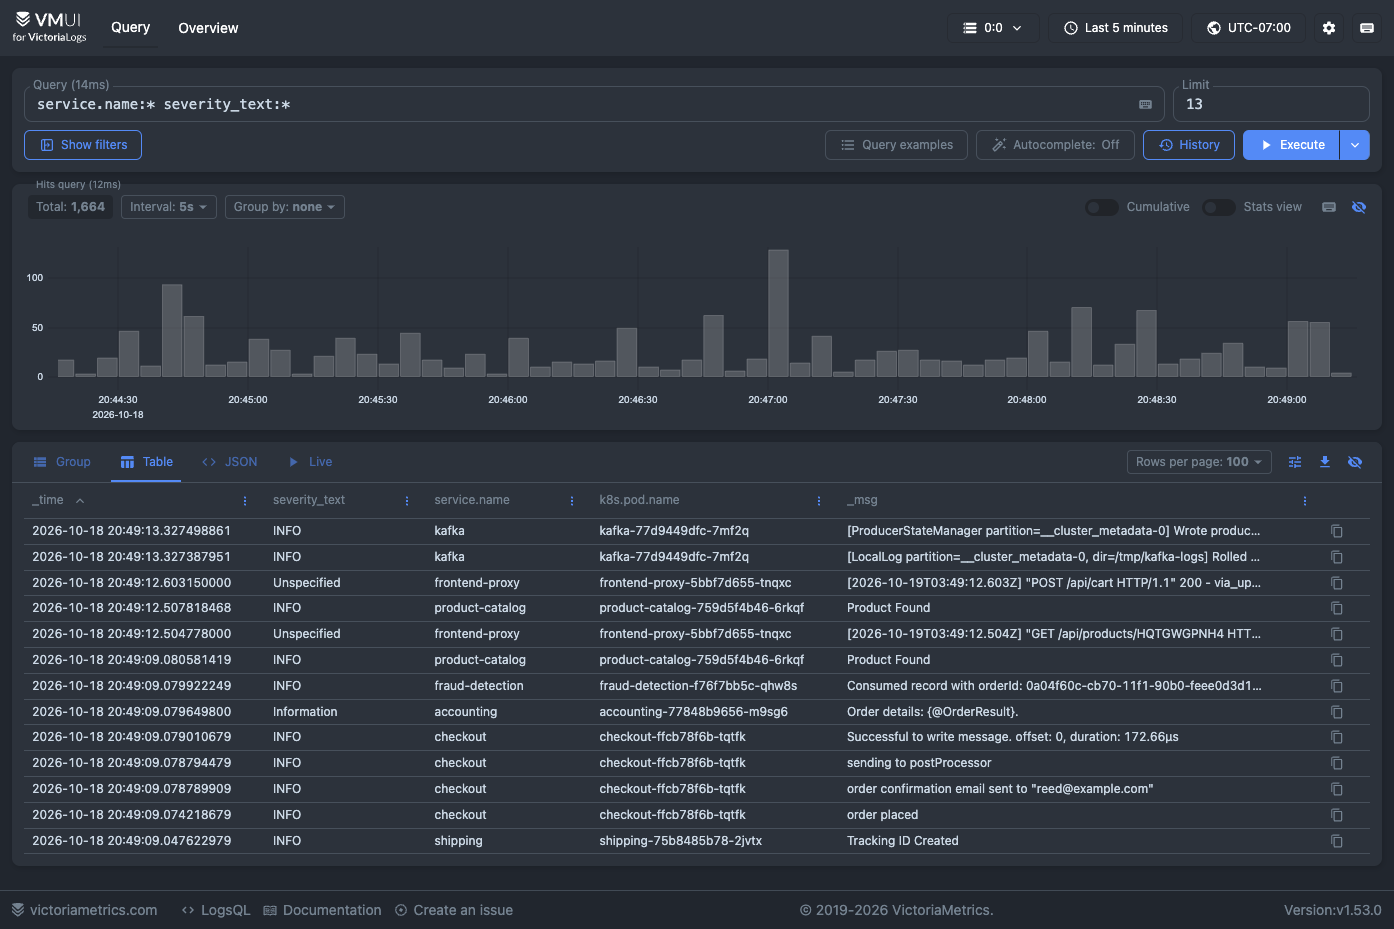
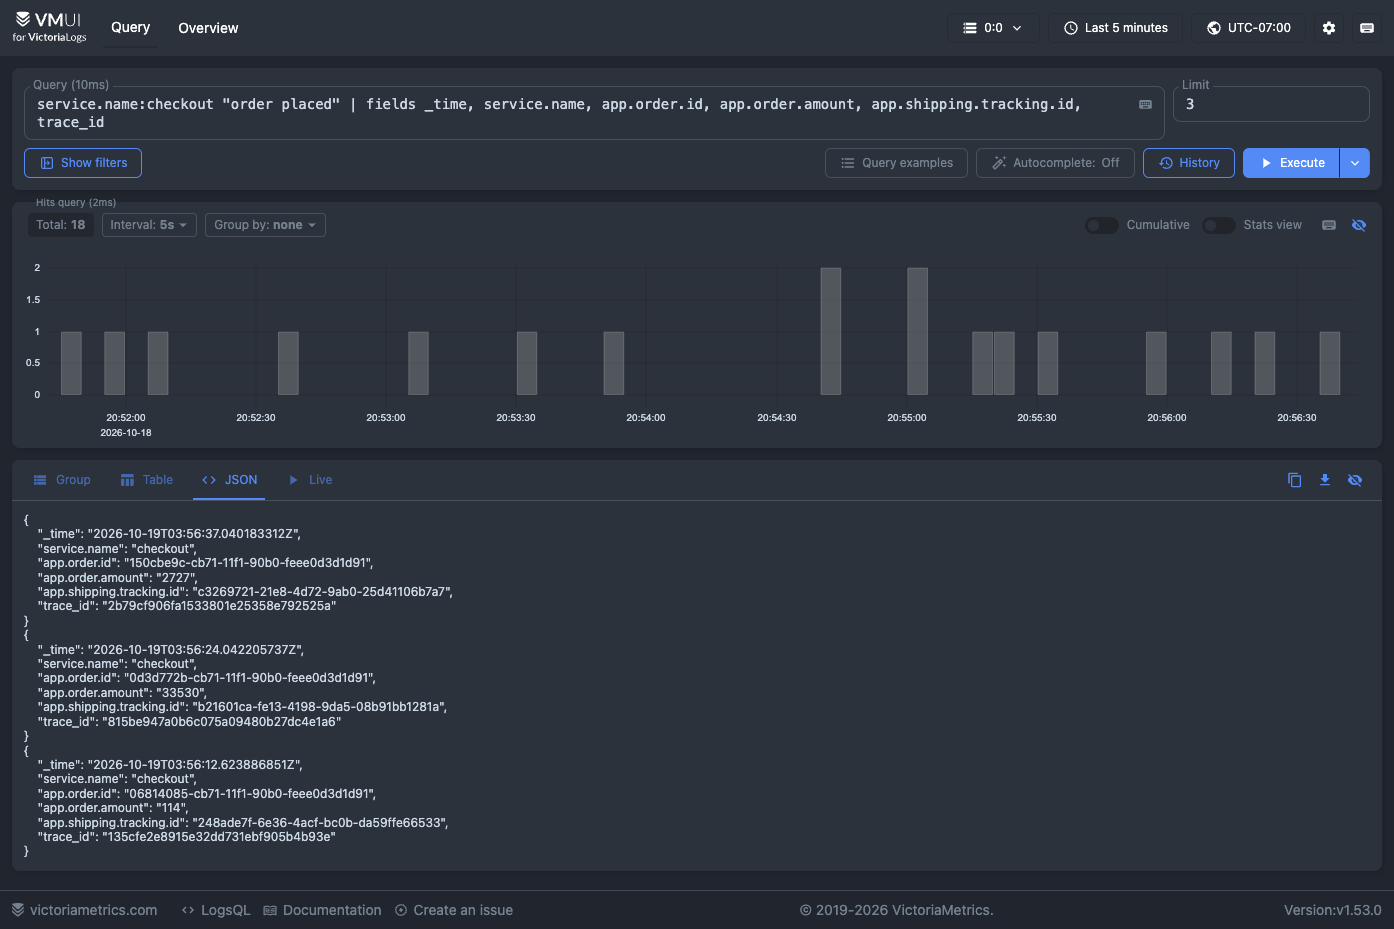
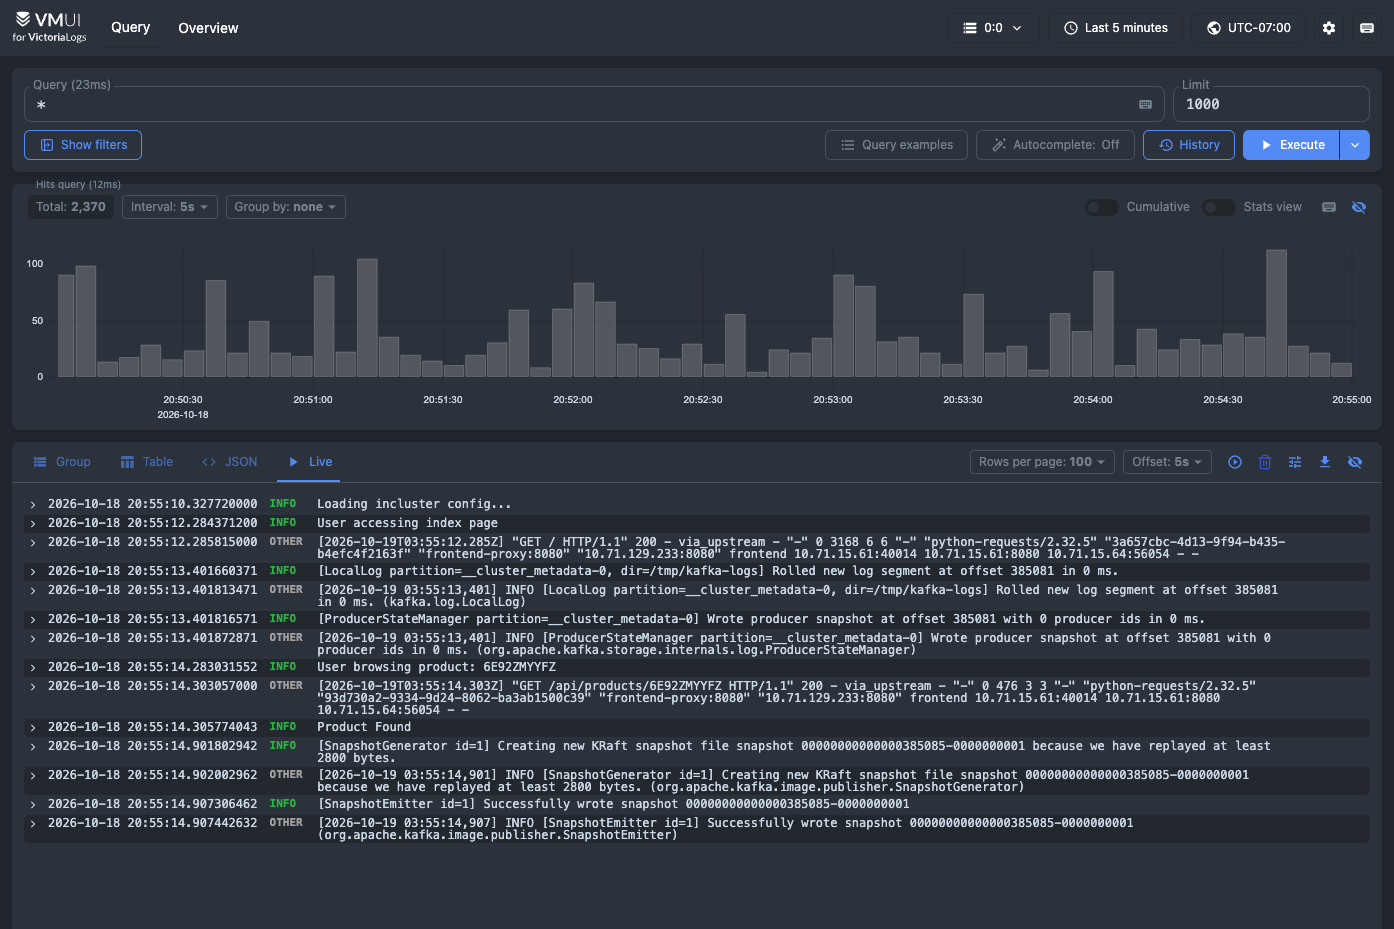
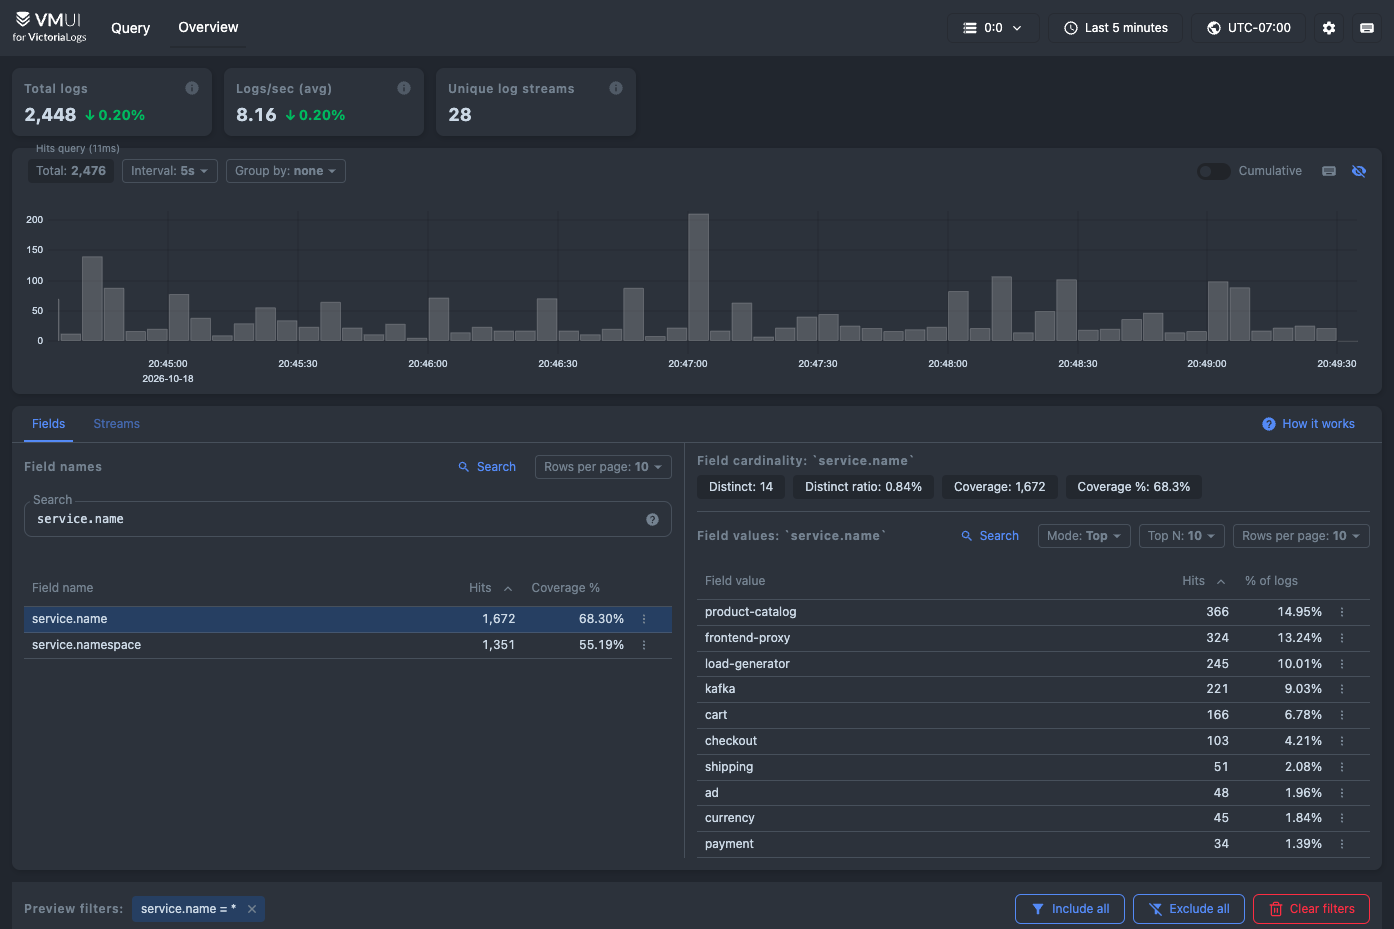
- The built-in web UI at /select/vmui runs LogsQL queries and shows results grouped by stream, as a table, as raw JSON, or as a live tail of new entries.
- Broad Ingestion Protocols
- Logs arrive through Elasticsearch bulk, newline-delimited JSON, Loki JSON, OpenTelemetry, Syslog over TCP or UDP, journald, Datadog, and Splunk endpoints, with Syslog listeners enabled by flags.
- Grafana And CLI Clients
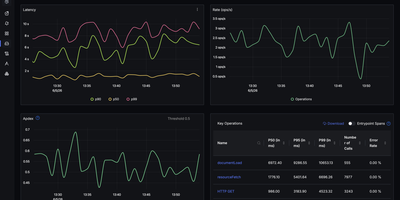
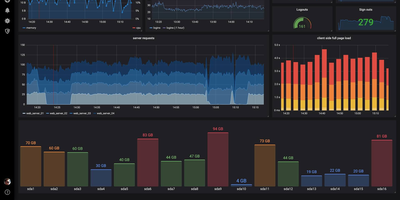
- A Grafana datasource plugin builds dashboards from log queries, vlogscli offers an interactive terminal client, and streaming HTTP responses pipe into grep, less, and jq.
- Multitenancy And Alerting
- Tenants are keyed by AccountID and ProjectID request headers, and vmalert evaluates LogsQL queries as alerting and recording rules, with alerts delivered through Alertmanager.
- Snapshots And Clustering
- Per-day partitions can be snapshotted over HTTP and copied with rsync or rclone to S3 or GCS, and cluster mode with vlinsert, vlselect, and vlstorage scales horizontally.