OpenLIT
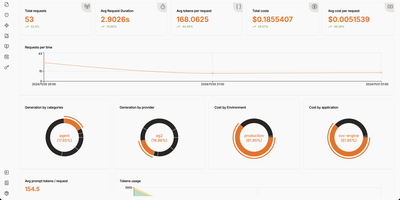
Your AI application is burning through API tokens faster than you can refresh the billing page, and you have no idea which prompt template is responsible. OpenLIT plugs that visibility gap with a self-hosted observability platform built specifically for LLM workloads. Add one line of code to instrument 90+ LLM providers, agent frameworks, and vector databases, then watch every request flow through a tracing dashboard that shows tokens consumed, latency measured, and dollars spent per call, per model, per environment. The requests view lists every LLM interaction with provider, model, cost, and token breakdown in a filterable table, while the trace detail panel lets you drill into individual spans to read the exact prompt sent and response received. Prompt Hub turns prompts into versioned artifacts you deploy, rollback, and A/B test without touching application code. OpenGround compares models side by side on the same input, so you can evaluate cost-versus-quality tradeoffs before committing to a provider. Automated evaluations run LLM-as-a-judge scoring on live production traces, flagging hallucinations, bias, and toxicity in real time. The Vault stores and rotates API keys centrally so secrets stay out of your codebase. Custom dashboards let you build drag-and-drop monitoring views with charts, stat cards, and tables backed by SQL queries against ClickHouse. GPU utilization, memory, temperature, and power metrics feed into the same platform for end-to-end infrastructure visibility. Running on a dedicated VPS on RepoCloud with guaranteed CPU, RAM, and SSD, full root SSH access, and a browser serial console. Apache 2.0 licensed.

RocketplaneIO
RocketplaneIO is a self-hosted AI SRE platform that gives Kubernetes clusters zero-instrumentation eBPF observability plus a copilot capable of safely diagnosing and fixing issues without your telemetry ever leaving your infrastructure. Point it at any cluster, and an eBPF DaemonSet starts capturing HTTP, gRPC, SQL, Redis, and Kafka spans across every service, including compiled binaries, with cross-service context propagation and no code changes required. The live service map draws itself from actual network traffic, matching technology logos from container images and coloring each node's health from RED metrics. Every log line sits two clicks from its parent distributed trace, and a PromQL query engine, embedded from the real Prometheus evaluator, runs over ClickHouse for long-term metric retention. The complete Kubernetes inventory (Services, Ingress, ConfigMaps, network policies, persistent volumes, CRDs) syncs continuously and is searchable alongside traces and logs. When the copilot identifies a problem, it picks from a catalog of roughly 30 risk-classified safe actions; each action verifies its preconditions, captures a before-state snapshot, executes, checks the result, and rolls back automatically on failure. Disruptive operations pause for explicit human approval before proceeding. An MCP endpoint exposes the identical guardrailed toolbox to external AI agents, so Claude Code or Cursor can operate the cluster through the same safety boundary the browser copilot uses. Complex remediations compose as searchable, forkable Starlark workflows that compile deterministically at save. Running on a dedicated VPS on RepoCloud with guaranteed CPU, RAM, and SSD, full root SSH access, and a browser serial console. Apache-2.0 licensed.
Moneat
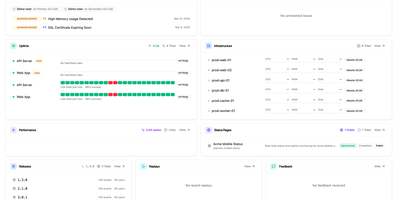
Moneat is the open-source observability platform that unifies error tracking, session replay, performance monitoring, logging, uptime checks, synthetics, product analytics, and AI observability into a single self-hosted application — replacing Sentry, Datadog, and Statuspage with one deployment. The Sentry SDK compatibility layer accepts data from @sentry/browser, @sentry/node, @sentry/react, @sentry/nextjs, sentry-sdk for Python, sentry-kotlin, sentry-java, sentry-android, sentry-cocoa, sentry-go, sentry-ruby, and Sentry.NET by updating one DSN endpoint. Datadog Agent compatibility redirects existing fleets by setting dd_url, and native OpenTelemetry OTLP ingestion accepts logs, traces, and metrics from any exporter or Collector. Error monitoring groups exceptions with smart deduplication, session replay records DOM-based user interactions linked to errors, distributed tracing visualizes transaction and span breakdowns with live service maps, and continuous profiling renders flamegraphs in pprof, JFR, and Sentry formats. Uptime monitoring runs HTTP, TCP, and ping checks with public status pages, while synthetics executes API tests, multi-step workflows, SSL checks, and DNS probes. Custom dashboards support drag-and-drop widgets with Grafana import, product analytics provides funnels and retention cohorts, release tracking surfaces crash-free rates with source map upload, and AI observability traces LLM calls end to end. Built on Kotlin and Java with ClickHouse for analytical storage, PostgreSQL for relational data, and Redis for caching, deployment uses Docker Compose with an interactive installer automating secrets and service orchestration. Running on a dedicated VPS on RepoCloud with guaranteed CPU, RAM, and SSD, full root SSH access, and a browser serial console. AGPL-3.0 licensed.
Percona PMM
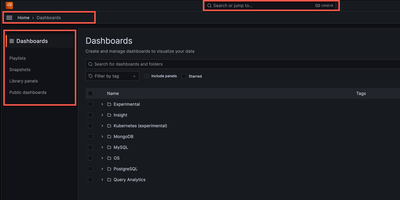
Backed by 1,080+ GitHub stars and maintained by Percona with the latest release v3.8.1 in June 2026, Percona Monitoring and Management delivers the open-source database observability platform that provides a single pane of glass across MySQL, PostgreSQL, MongoDB, Valkey, and Redis databases deployed on-premises, cloud, or hybrid environments. The Go-powered PMM Server collects metrics from lightweight PMM Client agents with minimal performance impact, storing time-series data in ClickHouse for fast querying across configurable retention periods. Query Analytics ranks every query by load across all database engines from one unified dashboard, drilling from fleet-level performance down to individual problematic queries with explain plans, per-query metrics, and anomaly detection. Real-time Query Analytics streams live MongoDB operations updated every 1-5 seconds for immediate troubleshooting of lock contention and long-running queries. Built-in Percona Advisors continuously scan connected databases for security gaps, misconfigurations, and performance problems, distilling decades of DBA expertise into automated actionable recommendations. Percona Alerting integrates with 15+ notification channels including Slack, PagerDuty, email, and webhooks to trigger on custom metric thresholds. Database-specific dashboards visualize InnoDB storage engine details, WiredTiger cache metrics, PostgreSQL tuple activity, replication lag, and cluster health with annotations for root-cause correlation. Deployment options include Docker single-container setup, Podman rootless execution, and Helm charts for Kubernetes with Ingress controller support and ConfigMap management. Running on a dedicated VPS on RepoCloud with guaranteed CPU, RAM, and SSD, full root SSH access, and a browser serial console. AGPL-3.0 licensed.
Exceptionless
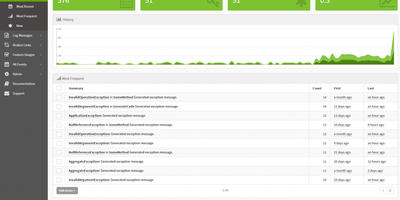
Exceptionless has earned over 2,400 GitHub stars and has been processing production errors since 2014 as the real-time event monitoring platform that captures far more than crashes. Built with ASP.NET Core on Elasticsearch for storage and Redis for caching, Exceptionless ingests exceptions, log messages, feature usage events, broken links, and custom event types through official SDKs for JavaScript, Node.js, .NET Core, ASP.NET, WPF, Web API, WebForms, Console apps, and React Native. Automatic event stacking groups related occurrences by exception type, message, and call stack into single actionable items, while manual stacking keys let developers create custom groupings for specific features or workflows. The real-time dashboard displays Most Frequent, Most Recent, and New event views with filtering by project, date range, environment, and custom tags. Stack management tracks resolution status with version-aware regression detection that automatically reopens resolved issues when the same error surfaces in a newer release. Webhook integrations connect to Slack, Discord, and external services through Zapier for automated issue tracking in GitHub Issues and Jira. Per-project notification settings control email and chat alerts for new errors, regressions, and critical events. OpenTelemetry support captures distributed traces alongside error data. The v8.6.0 release introduced a hosted Model Context Protocol server at the /mcp endpoint, enabling AI tools to query error data via OAuth-authenticated access. Deploy via Docker with the exceptionless/exceptionless image alongside Elasticsearch and Redis. Running on a dedicated VPS on RepoCloud with guaranteed CPU, RAM, and SSD, full root SSH access, and a browser serial console. Apache 2.0 licensed.
Vigil
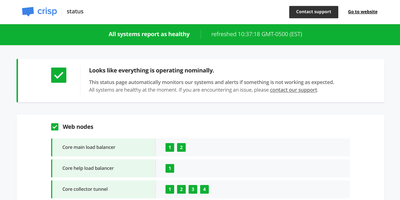
Vigil monitors your entire distributed infrastructure and generates a public status page from a single Rust binary small enough to run on a Raspberry Pi, consuming minimal CPU and memory while providing crash-free reliability. Four distinct monitoring modes cover every topology: poll probes check HTTP, TCP, SSH, and ICMP endpoints for reachability with configurable intervals and thresholds; push probes receive health reports from Vigil Reporter libraries embedded in your application code across Node.js, Python, Golang, Rust, TypeScript, Dart, and C#; local probes delegate monitoring to Vigil Local slave daemons running behind firewalls on separate LANs; and script probes execute custom shell commands for specialized health checks. Each monitored service transitions through healthy, sick, and dead states based on consecutive probe failures, with configurable thresholds controlling state transition sensitivity. When services change state, Vigil dispatches notifications through twelve alert channels including Slack, Email, Twilio SMS, Telegram, Pushover, Gotify, XMPP, Matrix, Zulip, Cisco Webex, and generic webhooks. The generated status page displays service groups organized by category with real-time replica status, system load metrics from reporter probes, and a maintenance announcement system for communicating planned downtime through the Manager HTTP API. Configuration uses a single TOML file defining all probes, services, and notification channels with no database dependency. Docker deployment pulls the official image with volume-mounted configuration. Running on a dedicated VPS on RepoCloud with guaranteed CPU, RAM, and SSD, full root SSH access, and a browser serial console. MPL-2.0 licensed.

LobsterBoard
LobsterBoard lets you assemble custom monitoring dashboards from 50 pre-built widgets using a visual drag-and-drop editor, covering everything from CPU and memory gauges to AI subscription trackers, stock tickers, and camera feeds on your own server with zero cloud dependencies. The snap-grid editor handles layout composition with resize handles and a property panel, so you drag widgets onto a canvas, configure their data sources, and the dashboard is live. Real-time system statistics flow through Server-Sent Events, updating CPU load, memory pressure, disk usage, network throughput, and Docker container status without page refreshes. Five built-in themes range from a dark default to a retro CRT terminal aesthetic, a warm sepia paper look, and pastel options for different display environments. The template gallery lets you export complete dashboard layouts with auto-captured screenshot previews, share them with other users, and import configurations as a full replacement or selective merge. Custom pages extend beyond dashboards into notes, kanban boards, or any free-form layout you need. Built-in widgets connect to iCal feeds for calendar events, RSS sources for news aggregation, weather APIs for local conditions, and financial data providers for cryptocurrency and stock prices. The whole system runs from a single server.cjs file with zero cloud dependencies or external frameworks. Running on a dedicated VPS on RepoCloud with guaranteed CPU, RAM, and SSD, full root SSH access, and a browser serial console. BSL-1.1 licensed (free for non-commercial use; converts to MIT in 2030).
CoreObs
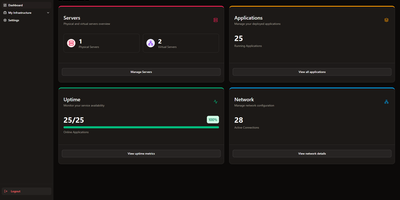
CoreObs delivers a unified self-hosted dashboard that replaces the typical combination of Uptime Kuma, Homer, and separate monitoring tools with a single interface for managing your entire server infrastructure. The Next.js frontend with shadcn components provides a modern dark-themed UI displaying server hardware metrics collected by a lightweight Go agent that leverages Glances for hardware abstraction — streaming real-time per-core CPU load, RAM utilization, NVIDIA GPU statistics, disk usage, system uptime, and load averages via WebSocket connections. The application registry tracks all self-hosted services with configurable uptime monitoring, availability history charts, and instant notifications through Discord, Telegram, Pushover, and email when services go down or recover. Quick-access links provide one-click navigation to each application's management panel directly from the dashboard. The network visualization module built on React Flow enables creating visual topology maps of your infrastructure with drag-and-drop nodes representing servers, switches, and services connected by labeled edges. Server data can be organized with tags, copied between entries, and monitored with configurable pagination and compact view modes. Deploy via Docker Compose with three containers — the Next.js web interface, the Go monitoring agent, and PostgreSQL 17 for persistent storage. Running on a dedicated VPS on RepoCloud with guaranteed CPU, RAM, and SSD, full root SSH access, and a browser serial console. MIT licensed.
DAC
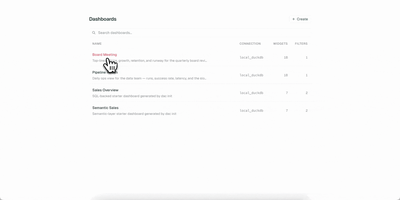
Your dashboards deserve version control, code review, and reproducible builds, just like the rest of your stack. DAC lets you define interactive data dashboards in YAML or TSX, validate them in CI, and serve them from a single Go binary that embeds a full React frontend. Choose from 21 chart types including line, bar, area, pie, scatter, bubble, funnel, sankey, heatmap, calendar, sparkline, waterfall, gauge, treemap, radar, and candlestick, plus metric cards, data tables, text blocks, and image widgets. The built-in semantic layer lets you define metrics and dimensions once in reusable model files, then reference them from any widget while DAC generates the SQL automatically. Connect to Postgres, MySQL, Snowflake, BigQuery, Redshift, Databricks, and DuckDB through standard Bruin connection configs. Interactive filters with date pickers, dropdowns, multiselects, and search inputs inject values via Jinja templating and re-execute only affected widgets. Live reload via Server-Sent Events refreshes connected browsers instantly when you save a file. Export dashboards as self-contained static HTML with baked-in query results for S3, GitHub Pages, or offline sharing, and render slide decks via the Google Slides export command. On RepoCloud, deploy DAC on a dedicated VPS with root SSH access and persistent storage for your dashboard definitions and database connections under the AGPL-3.0 license.
Drydock
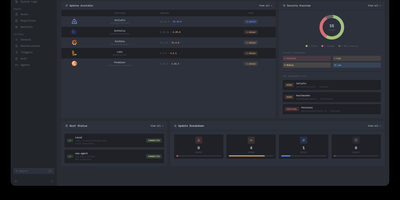
Deploying container updates without blind surprises is what Drydock delivers through a monitor-first inspection plane that evaluates image registries, scans CVE vulnerabilities, and automates rollbacks across distributed Docker infrastructure. Systems engineers track container fleets across twenty-three public and private registries including Docker Hub, GitHub Container Registry, Harbor, and Quay using cursor-based pagination and semver classification. The integrated Update Bouncer runs Trivy and Grype static scanners against incoming candidate layers, blocking deployments that fail configurable CVE severity policies while verifying cryptographic signatures through cosign. Operators configure declarative update schedules with stabilization countdown gates that hold back brand-new releases until defined burn-in periods elapse. When updates execute, Drydock creates pre-upgrade container snapshots and evaluates post-launch container health checks, instantly restoring previous image digests and network configs if failures occur. Distributed Portwing edge agents stream live container output and system logs over encrypted WebSockets, allowing central consoles to coordinate remote daemon updates without opening inbound host firewall ports. Automated event triggers dispatch granular notifications and update payloads across seventeen communication channels including Slack, Discord, Telegram, and Home Assistant MQTT brokers. Running on a dedicated VPS on RepoCloud with guaranteed CPU, RAM, and SSD, full root SSH access, and a browser serial console. AGPL-3.0 licensed.
Statainer
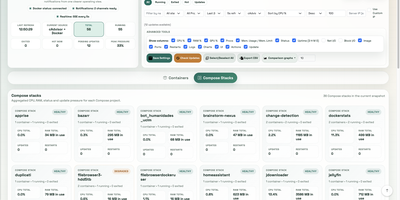
Monitoring and safeguarding Docker infrastructure without heavy enterprise software overhead is the primary mission of Statainer, an open-source management control center for container hosts. System operators inspect live CPU loads, memory consumption, network throughput, and disk I/O metrics across individual containers or comparative top-ranking charts. The interface groups containers by Compose projects, enabling administrators to start, stop, or restart entire application stacks and inspect real-time log streams without opening SSH sessions. The built-in Update Manager detects available image tags, executes single-click container updates, and maintains persistent deployment history with automated rollback capabilities for failed recreations. Custom alert configurations trigger instant notifications to Telegram, Discord, Slack, Pushover, or generic webhook endpoints whenever resource thresholds are breached or container health states change. Developers can provision scoped API keys with token authentication to automate container state transitions and export performance telemetry into custom monitoring workflows. Running on a dedicated VPS on RepoCloud with guaranteed CPU, RAM, and SSD, full root SSH access, and a browser serial console. MIT licensed.
Grafana OnCall
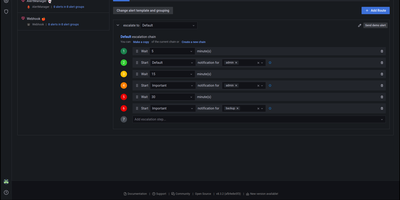
With 3,900 GitHub stars, 140 contributors, and 380 releases since its 2022 launch, Grafana OnCall delivers developer-friendly incident response that routes alerts from any monitoring system to the right engineer at the right time through the right channel. The platform accepts alerts via unique API URLs from Alertmanager, Grafana Alerting, Zabbix, Datadog, Pagerduty-compatible sources, Jira, inbound email, and generic HTTP webhooks, then applies routing templates to direct each alert to the appropriate escalation chain. Escalation chains define notification sequences — notify the primary on-call via Slack, wait 5 minutes, escalate to SMS and phone, wait 10 minutes, page the secondary on-call and notify the engineering manager — continuing until acknowledgment or resolution. On-call schedules support multi-layer rotations with overrides, shift swaps, and timezone-aware handoffs rendered directly inside Grafana dashboards. ChatOps integration publishes alert groups to Slack channels and Telegram groups with interactive buttons for acknowledge, resolve, and silence actions. Template engines based on Jinja2 control alert grouping, appearance rendering, and behavioral automation. The REST API enables programmatic management of integrations, schedules, and escalation policies. Deploy via Docker Compose with PostgreSQL, Redis, and Celery workers alongside your existing Grafana instance. Running on a dedicated VPS on RepoCloud with guaranteed CPU, RAM, and SSD, full root SSH access, and a browser serial console. GNU AGPL v3 licensed.
Nimbus
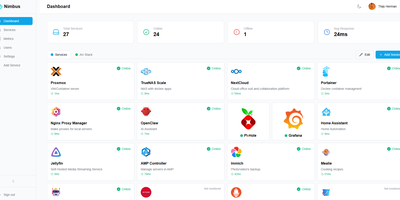
Nimbus is a self-hosted homelab dashboard that turns your scattered pile of services into a polished, organized command center with real-time health monitoring for every endpoint you care about. The dashboard displays live status cards for each registered service, tracking response times down to the millisecond and graphing uptime history so you can spot degradation before it becomes an outage. Health checks run on configurable intervals with smart self-signed certificate handling, meaning your internal services with self-issued TLS do not trigger false alarms. Multi-user support comes standard: local accounts authenticate via JWT, while OAuth2 integration with Google, GitHub, and Discord lets team members sign in with existing credentials. Role-based access control and a built-in admin panel give you granular authority over who sees what. Each user personalizes their view with custom backgrounds, light or dark mode, accent color themes, and drag-and-drop service tile arrangement. Services group into named categories and cards resize to fit your preferred layout, with both grid and list view modes available. Prometheus metrics export feeds your existing Grafana stack, and webhook notifications alert you instantly when a service goes offline. Custom service icons upload directly or auto-fetch from the Dashboard Icons collection. Zero-config Docker deployment gets you running in under 30 seconds with a single docker-compose command. Running on a dedicated VPS on RepoCloud with guaranteed CPU, RAM, and SSD, full root SSH access, and a browser serial console. AGPL-3.0 licensed.
ServerBee
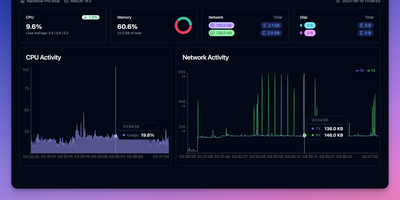
ServerBee delivers complete fleet monitoring from a single Rust binary that embeds both the server and web UI, requiring no external database or heavy runtime. Lightweight agents installed on each node stream CPU, memory, disk, network, load, temperature, GPU, and disk I/O metrics over persistent WebSocket connections to a central server backed by embedded SQLite. The real-time React dashboard presents 17 drag-and-drop widget types across custom layouts, with historical charts spanning one hour to 30 days and monthly traffic statistics with billing-cycle prediction and cost insights including burn rate and per-resource unit cost scoring. Network monitoring covers ICMP, TCP, and HTTP ping probes, service monitors for SSL certificates, DNS records, HTTP keyword matching, TCP ports, and WHOIS expiration, plus network-quality probing across 96 China 3-ISP and international presets with IP-quality and streaming-unlock detection. Remote management features include a web terminal with sandboxed file manager, Docker container stats with logs and events, firewall configuration, and agent auto-update capabilities. Public status pages display 90-day uptime timelines, while alerting supports email and webhook notifications with flexible trigger expressions. A native iOS companion app provides mobile monitoring access. Deploy via Docker or download the single binary for Linux, macOS, or Windows, running on a dedicated VPS on RepoCloud with guaranteed CPU, RAM, and SSD, full root SSH access, and a browser serial console. AGPL-3.0 licensed.
Usulnet
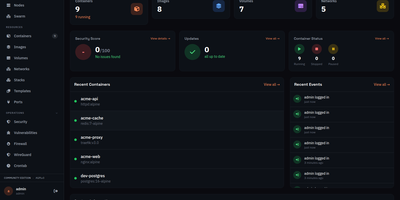
Usulnet packs container management, Trivy security scanning, Nginx reverse proxy, scheduled backups, WireGuard VPN, firewall rules, and multi-node orchestration into a single 70MB Go binary with zero external runtime dependencies. Every module ships in one download with no paid tiers, no telemetry, and no edition gating. Container lifecycle management covers creation, start, stop, restart, pause, kill, and removal with bulk operations, real-time resource statistics, filesystem browsing, and settings editing. Trivy integration scans images and running containers for CVEs with severity scoring, generates SBOMs, and validates CIS benchmarks. The multi-node architecture supports standalone, master, or agent modes where agents connect over NATS JetStream with mTLS encryption, enabling remote Docker host management from a central dashboard. Reverse proxy configuration handles Nginx with automatic Let's Encrypt certificates, TCP/UDP stream proxying, access lists, and dead host detection. Backup operations capture container volumes and Compose stacks on configurable schedules with retention policies and full restore capabilities. A built-in application catalog provides 60+ one-click templates for common services. JWT license validation uses an RSA-4096 public key embedded in the binary, requiring no call-home and working entirely offline. For teams tired of maintaining separate tools for each infrastructure concern, Usulnet collapses the entire stack into a single point of management with Docker Compose deployment alongside PostgreSQL, Redis, and NATS.
GlitchTip
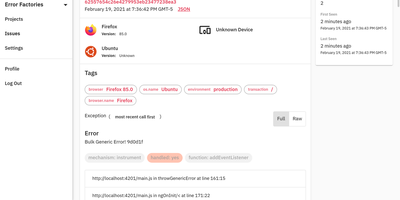
GlitchTip speaks Sentry's protocol without Sentry's operational weight - open-source error tracking that your existing SDKs already understand. The pitch is pragmatic: instrument your application with the official Sentry SDKs you already know - any language they cover - and point the DSN at your own GlitchTip instance instead. Errors, exceptions, log messages, and Content Security Policy violations flow into one place for triage, grouped into issues with stack traces, with alerts delivered by email or webhook the moment things break. Where self-hosted Sentry has ballooned into a docker-compose stack of twenty-plus containers, GlitchTip is a deliberately lean Django and PostgreSQL application a small team can actually run. Beyond errors, it bundles three more monitoring concerns: performance monitoring takes a works-out-of-the-box approach - no dashboard building, just your slowest web requests, database queries, and transactions surfaced automatically; uptime monitoring pings your sites and alerts on failures, or runs in reverse as a dead-man's-switch heartbeat for cron jobs that must check in on schedule; and log search puts application logs alongside errors for faster debugging. Unlimited projects and team members, MIT-licensed, built by Burke Software - your event volume is limited only by your own hardware.