Stars
Forks
Watchers
Developer links
Healthchecks
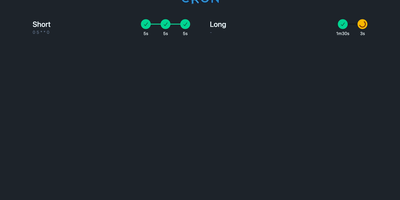
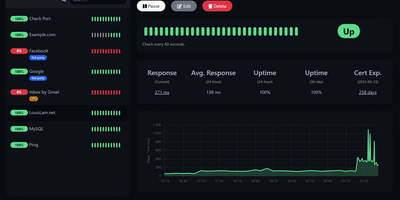
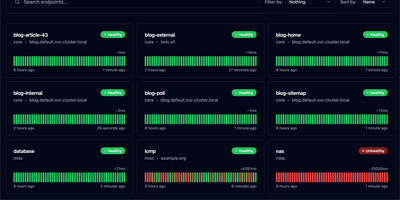
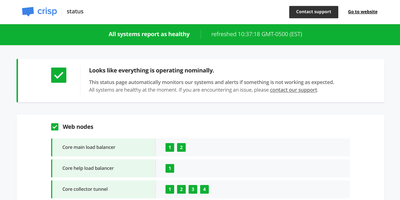
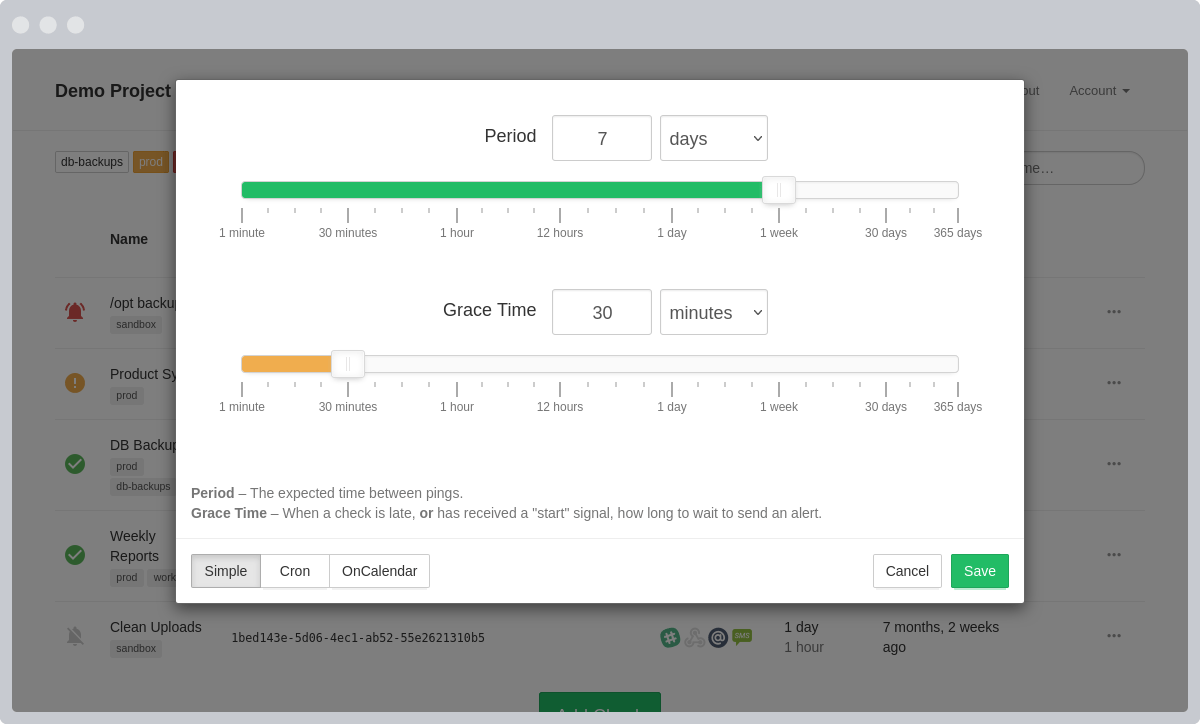
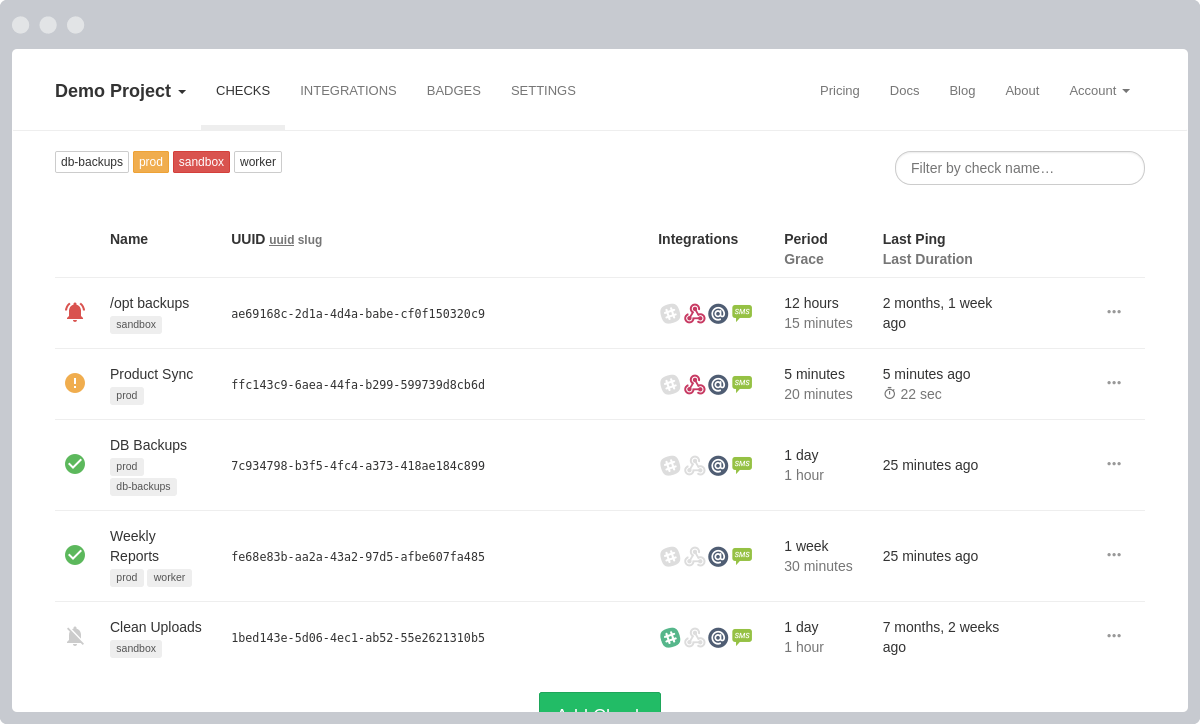
With 10,100+ GitHub stars and 75 releases over a decade of continuous development, Healthchecks is the open-source cron job monitoring service that catches failures your other monitoring tools miss — the jobs that silently stop running, the backups that never completed, the nightly reports that disappeared without error. The dead man's switch architecture requires zero agent installation: your cron jobs, scripts, and services ping a unique URL via HTTP request or email, and Healthchecks alerts you only when a ping does not arrive within the configured Period and Grace Time window. Each check supports cron expression scheduling, optional start, success, and failure signals for measuring execution time, and HTTP body keyword filtering for intelligent alert routing. Twenty-five notification integrations cover every channel teams actually use: Slack, Discord, Microsoft Teams, PagerDuty, Opsgenie, Splunk On-Call, Telegram, Signal, WhatsApp, SMS, email, webhooks, GitHub Issues, Pushover, ntfy, Gotify, Matrix, Mattermost, Zulip, Pushbullet, PagerTree, Spike.sh, and Trello. The web dashboard provides a visual grid showing real-time status with color-coded badges and per-check integration toggles. Monthly, weekly, and daily email reports summarize uptime trends with checks sorted by downtime duration. Team management supports projects with member roles and read-only access. Prometheus metrics expose check health and grace state for Grafana dashboards. WebAuthn and TOTP two-factor authentication secure accounts. Deploy via Docker images available for amd64, arm/v7, and arm64 architectures. Running on a dedicated VPS on RepoCloud with guaranteed CPU, RAM, and SSD, full root SSH access, and a browser serial console. BSD 3-Clause licensed.
Benefits
- Zero Agent Dead Man Switch
- No agents to install on monitored systems. Cron jobs and scripts ping a unique URL via HTTP or email. Healthchecks alerts only when a ping fails to arrive within the configured time window.
- Twenty Five Notification Integrations
- Alert via Slack, PagerDuty, Discord, Teams, Telegram, Signal, WhatsApp, SMS, Opsgenie, Splunk On-Call, GitHub Issues, ntfy, Pushover, webhooks, and more with per-check channel toggles.
- Intelligent Scheduling and Signals
- Configure checks with Period and Grace Time or cron expressions. Optional start and failure signals measure execution duration and distinguish between late runs and actual failures.
- Team Projects With Role Access
- Organize checks and integrations into projects with team member management. Grant read-only or full access per project. WebAuthn and TOTP two-factor authentication protect accounts.
Features
- Visual Status Dashboard
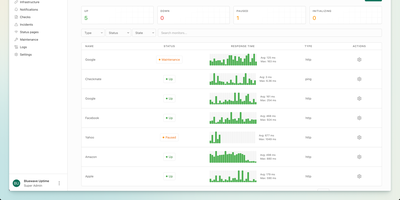
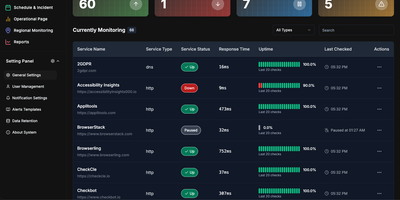
- Color-coded grid view showing real-time health status of all checks with last ping times, integration toggles, and quick-action buttons for pausing and resuming monitoring.
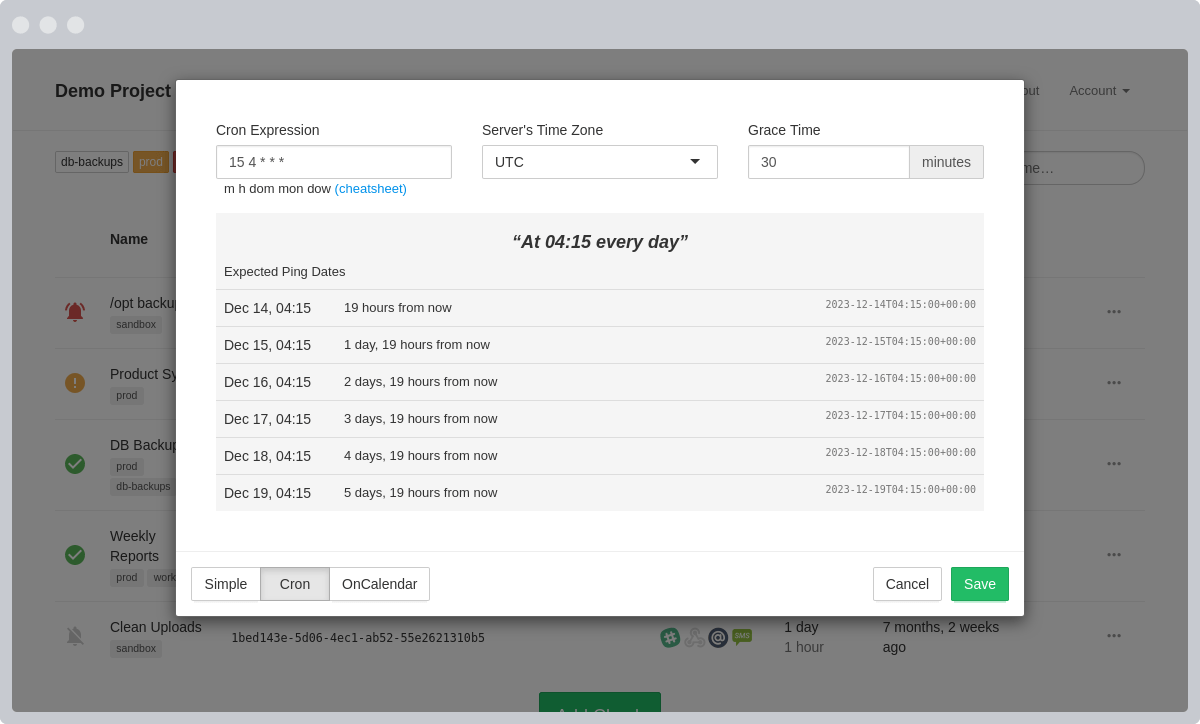
- Cron Expression Scheduling
- Define check schedules using standard cron expressions with cronsim library parsing. Supports complex schedules with multiple time fields, weekday filters, and off-calendar patterns.
- Prometheus Metrics Export
- Native /metrics endpoint exposes check health, grace state, and paused status in Prometheus format with optional Authorization header support for Grafana integration.
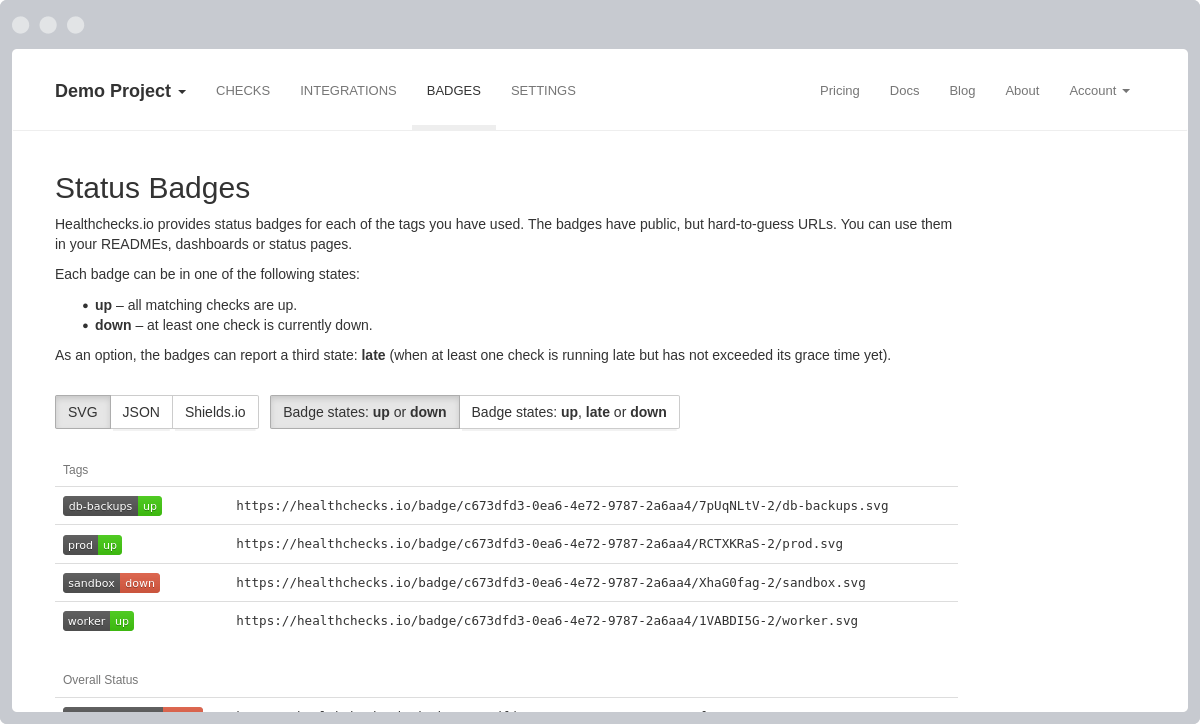
- Status Badges
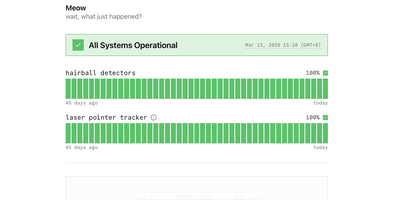
- Public, hard-to-guess badge URLs display real-time check status in SVG format. Embed in READMEs, dashboards, or status pages to communicate system health without exposing credentials.
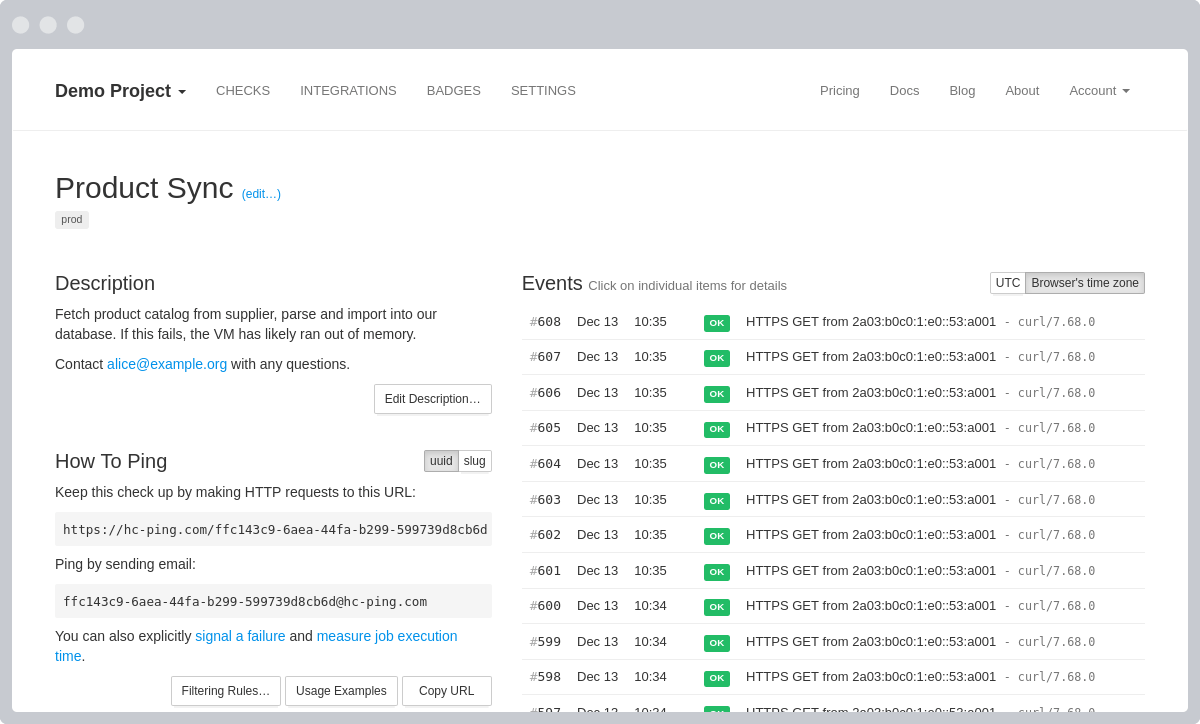
- Email and HTTP Pinging
- Checks accept both HTTP requests and email messages as pings. Append /start, /fail, or /log to URLs for signal types. Filter HTTP body keywords for conditional alerting.
- Automated Reporting
- Monthly, weekly, and daily email reports summarize uptime trends with checks sorted by downtime duration. Hourly reminders notify when any check remains in a down state.