Categories
Self-Hosted AI Agents Observability MCP Server Log Management OpenTelemetry Distributed Tracing Application MonitoringStars
Forks
Watchers
Developer links
Pitot
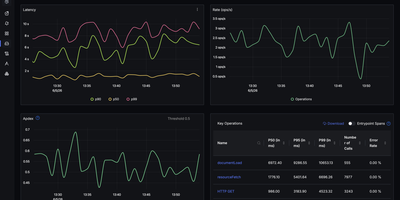
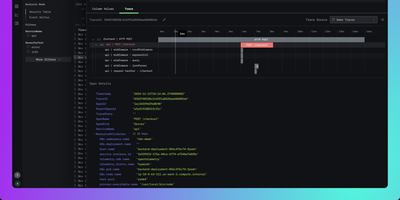
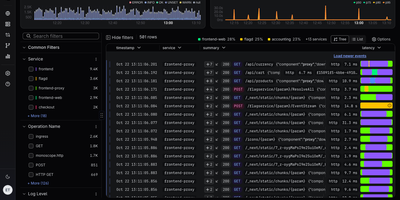
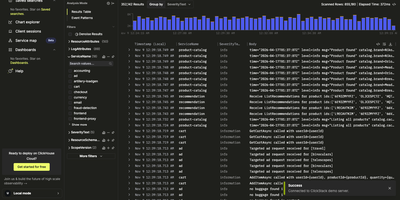
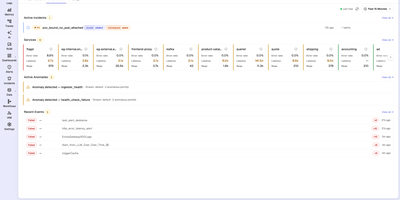
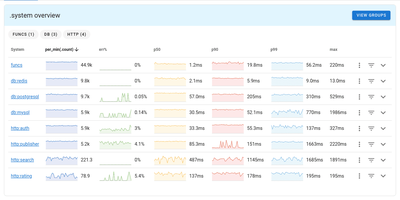
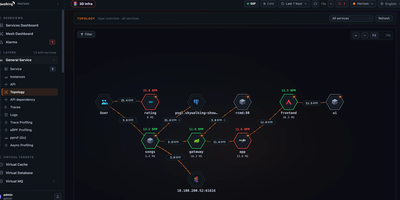
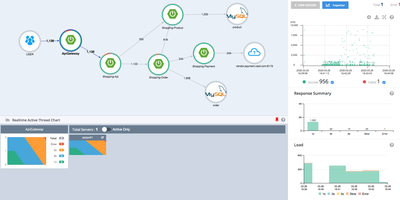
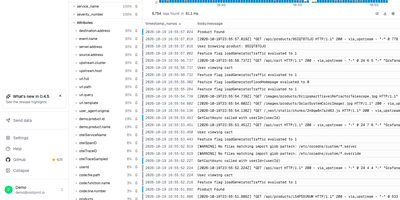
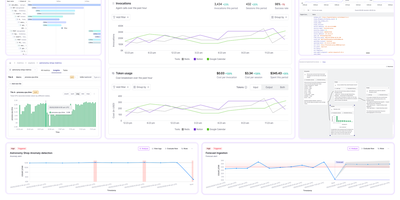
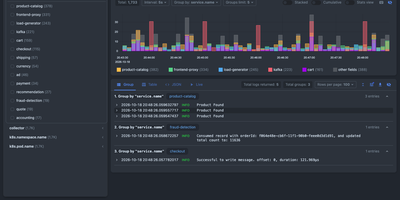
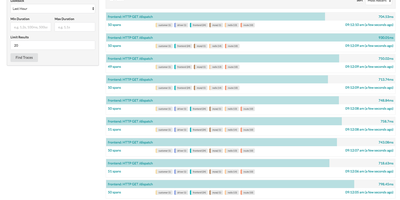
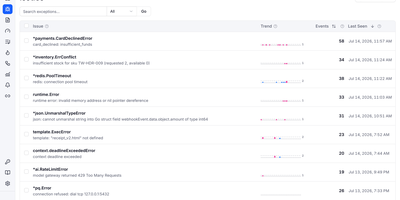
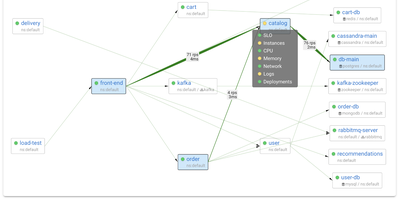
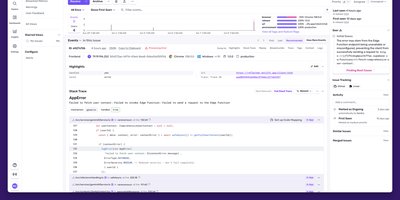
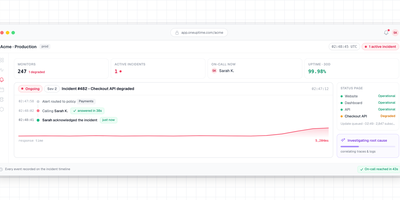
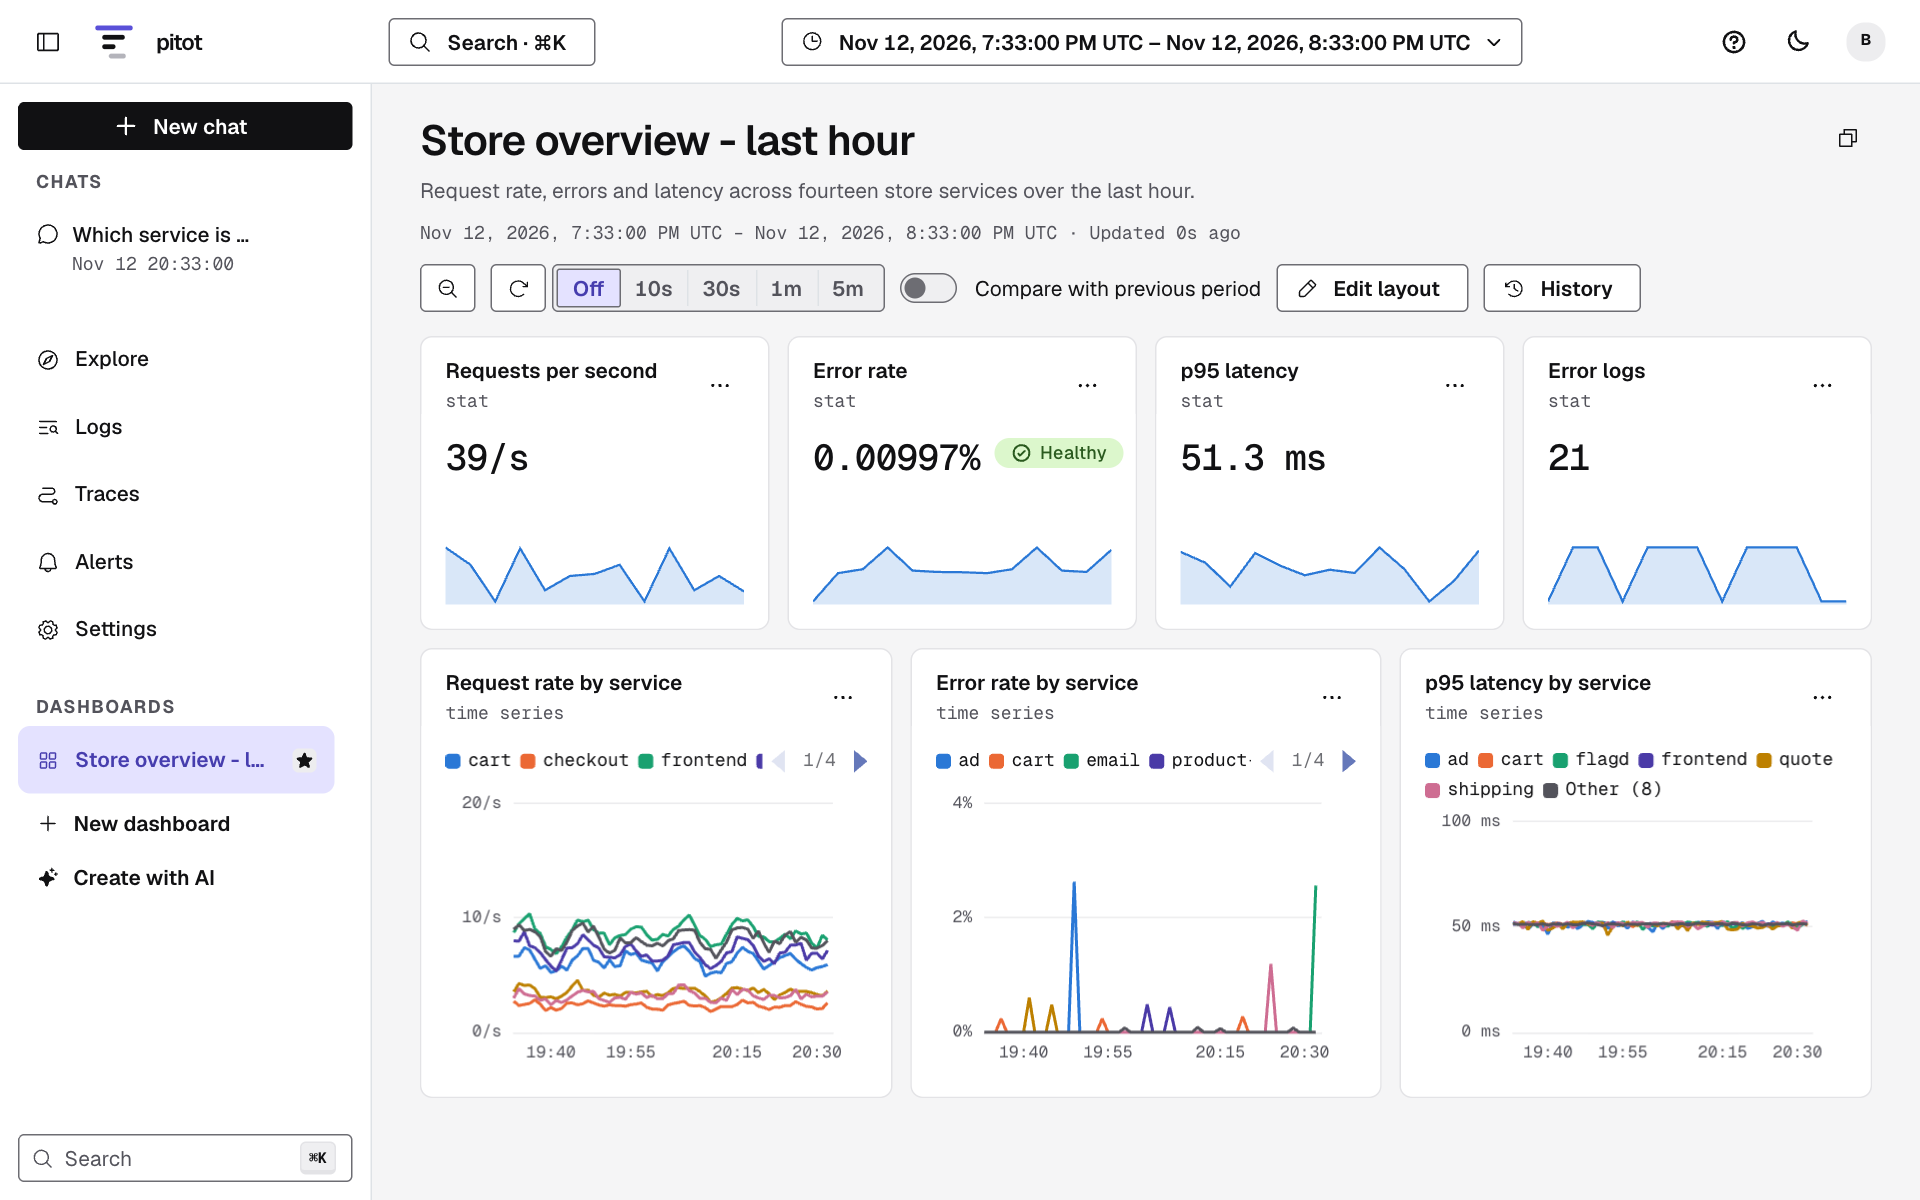
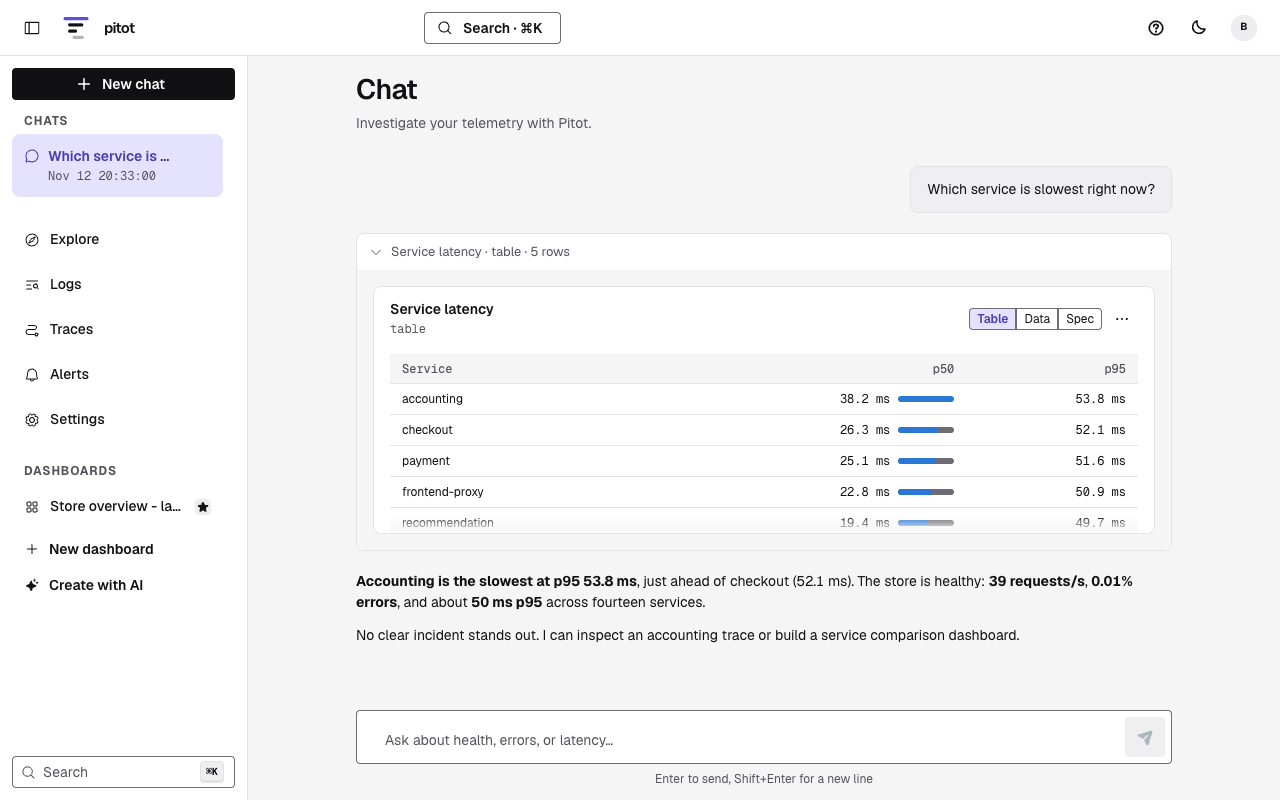
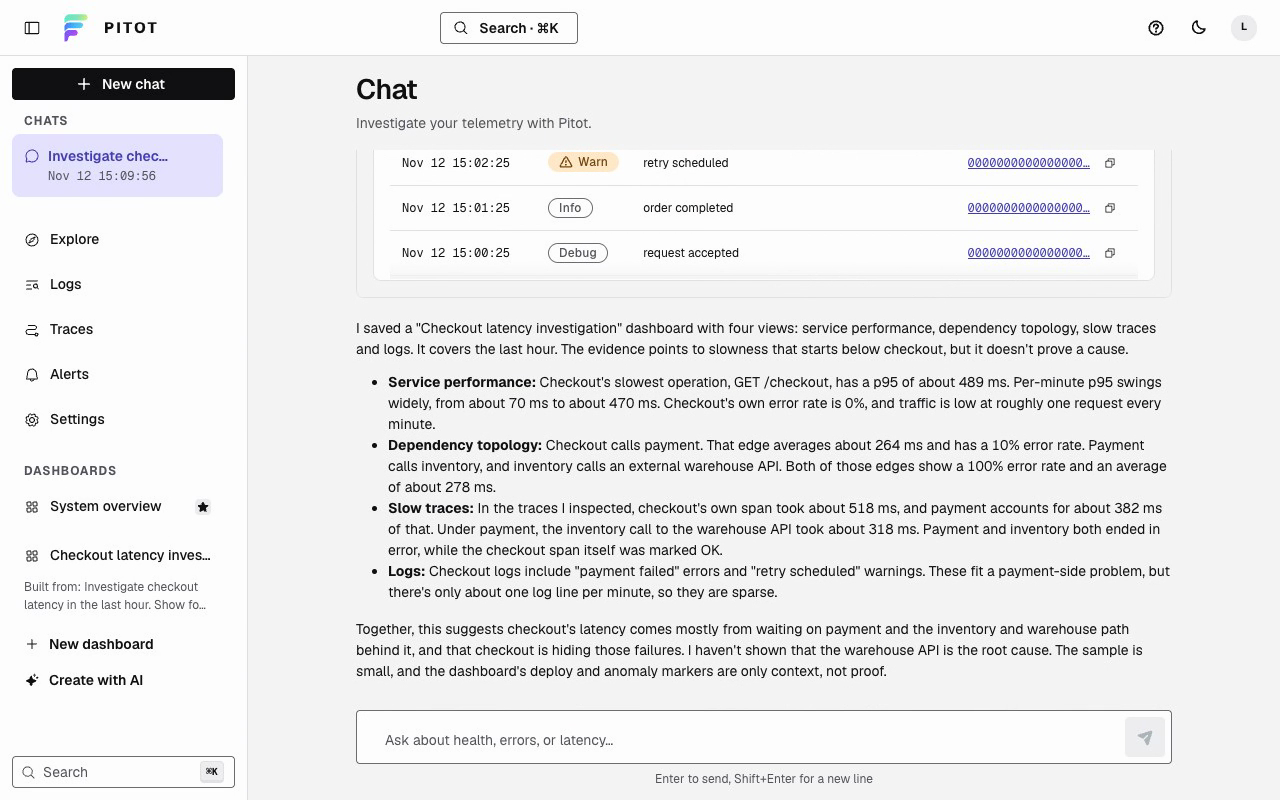
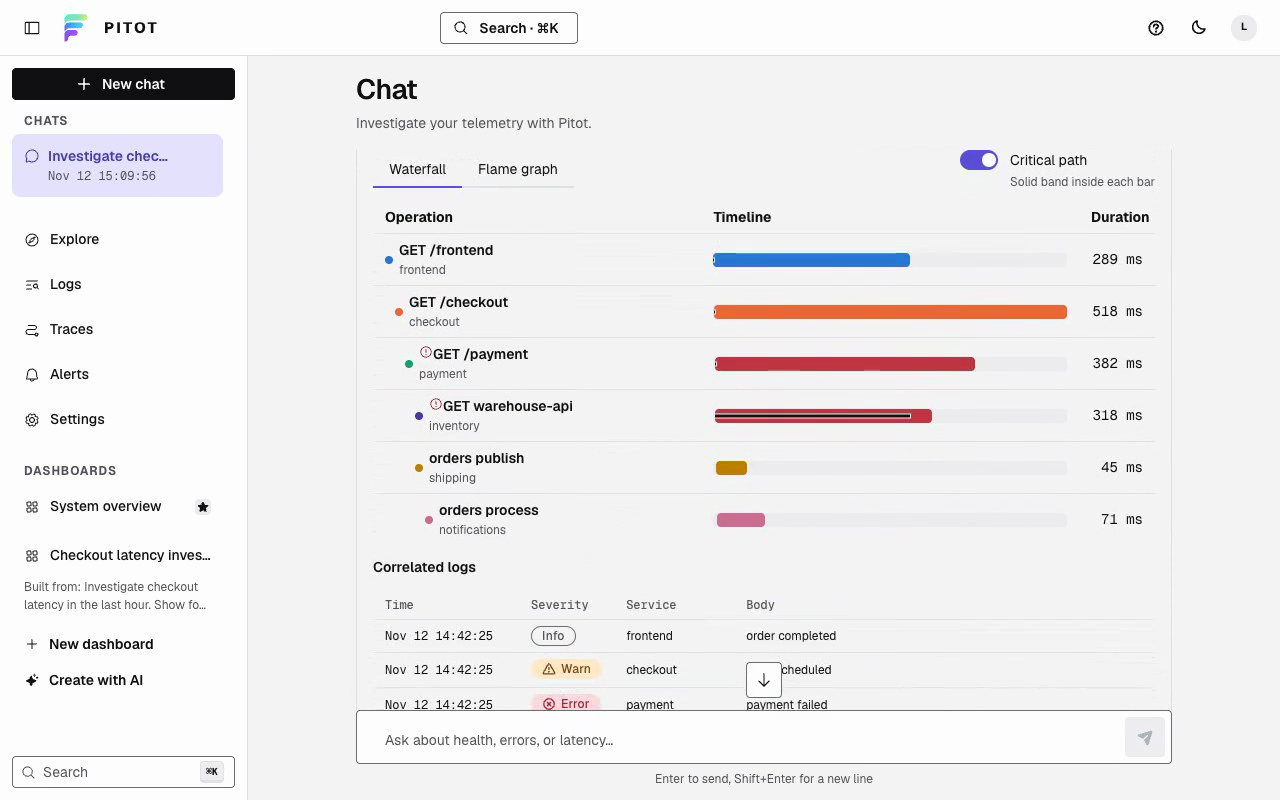
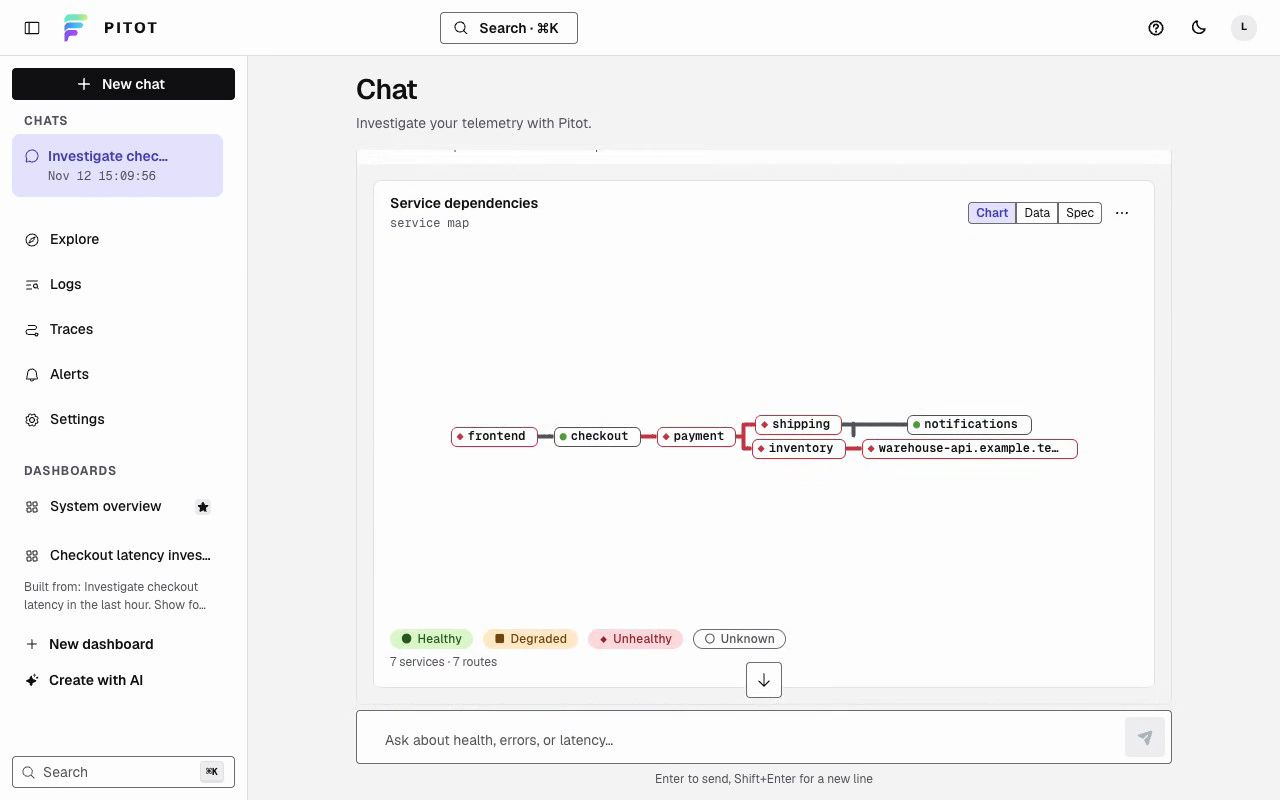
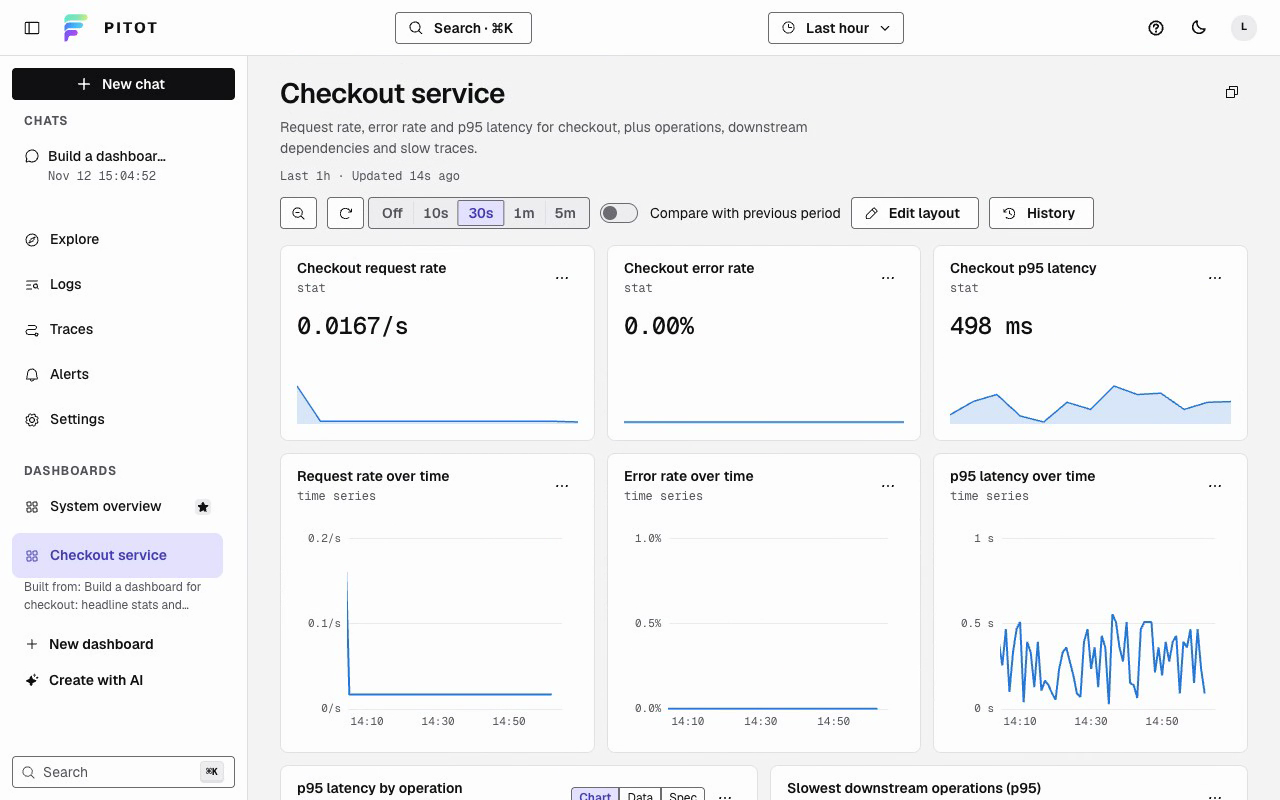
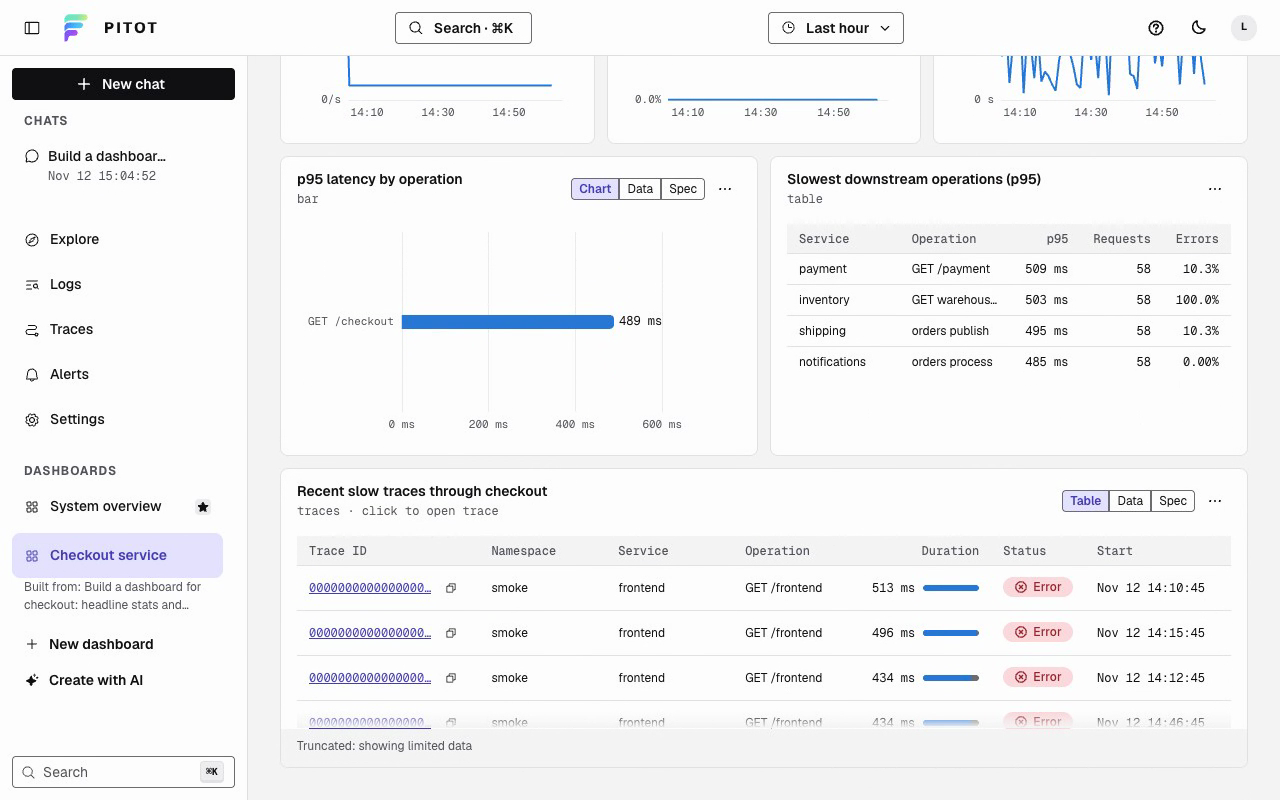
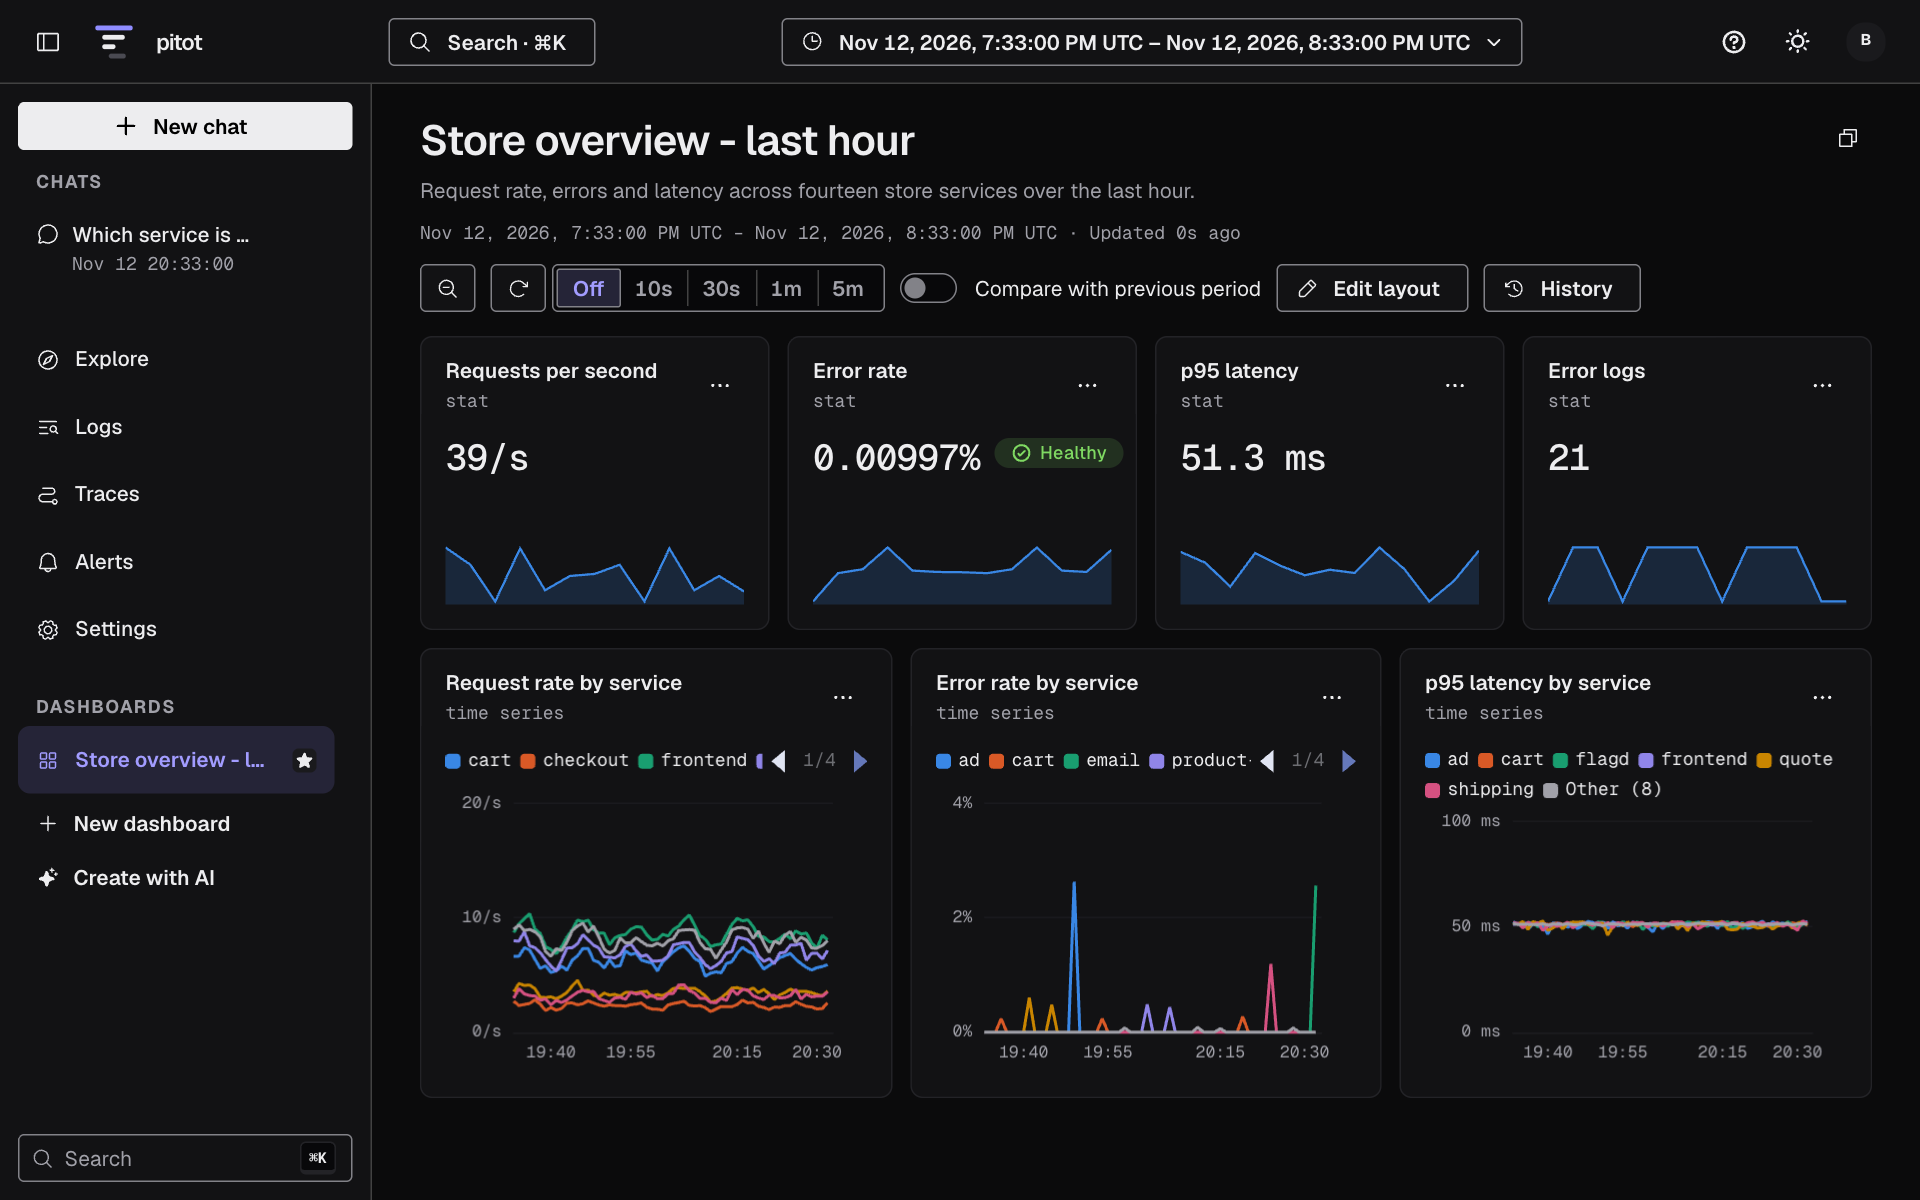
Point your OpenTelemetry exporters at one port and get traces, logs, metrics, dashboards, alerts, and an AI investigator, with no storage cluster to babysit. Pitot accepts OTLP over gRPC and HTTP, keeps everything in a single data directory as Parquet files you own, and lets you query with Explore and PitotQL even when no AI provider is configured. Ask the built-in agent which service is slowest right now and it runs typed queries across traces, logs, and metrics, then explains the evidence inline. Describe a dashboard in one sentence and it drafts, checks, and saves panels for request rate, error rate, p95 latency, service dependencies, slowest operations, and recent errors. Alerts watch service error rate, latency, throughput, and log volume. Prefer your own assistant? A remote MCP endpoint lets Claude Code or any MCP client search logs, inspect traces, query telemetry, and create dashboards after you approve its scopes through OAuth in the browser. Sign in with single-use login links or an OIDC provider, choose OpenAI or Anthropic for chat, and set how many days of telemetry to keep, 30 by default. Pitot runs as one node, which suits a single machine's worth of telemetry rather than fleet-scale clusters. Running on a dedicated VPS on RepoCloud with guaranteed CPU, RAM, and SSD, full root SSH access, and a browser serial console. Apache-2.0 licensed.
Benefits
- One Process, One Data Directory
- Ingest, storage, queries, alerts, the agent, MCP, and the browser client all run in one process on port 7520, so there is no collector, ClickHouse cluster, or object store to operate.
- Telemetry Stays On Your Disk
- Authoritative Parquet files stay on your own disk, unlike Datadog, Honeycomb, or Grafana Cloud, where a vendor stores your traces, logs, and metrics, so retention and access remain your decisions.
- Investigate Without Query Languages
- The built-in agent turns plain-language questions into typed queries over all three signals and shows its evidence inline, while Explore and PitotQL keep working when no AI provider key is set.
- Benchmarked At 507,311 Items Per Second
- The project's own ingest benchmark accepted 507,311 mixed spans, logs, and metric points per second for 306.8 seconds on one eight-vCPU Hetzner server running version 2026.11.0-alpha, without any cluster.
Features
- OTLP gRPC and HTTP Ingest
- Standard OTLP exporters or an OpenTelemetry Collector send traces, logs, and metrics to port 7520 with a bearer ingest token that Pitot reveals once during first-boot setup.
- Parquet Storage, DuckDB Analytics
- Authoritative telemetry is stored as local Parquet with indexed trace reads and compaction while reads continue, and DuckDB provides analytics with query state that can be rebuilt.
- Built-In Investigation Agent
- Chat uses an Anthropic or OpenAI key to query telemetry and answer in plain language; with no provider set, chat is disabled while every other feature still works.
- MCP Server for Agents
- A remote /mcp endpoint with OAuth registration serves MCP over Streamable HTTP, exposing typed tools such as query_telemetry, search_logs, inspect_trace, preview_panels, and create_dashboard to external agents.
- Dashboards and Alerts
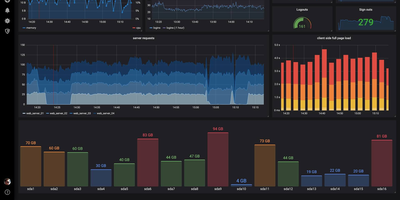
- Dashboards cover traces, logs, and metrics, and alerts watch service error rate, latency, throughput, and log volume; both are listed as preview capabilities in the current alpha.
- Docker and Native Install
- Run labstack/pitot from Docker Hub or GHCR, or install a checksum-verified binary for Linux or macOS on amd64 or arm64; configuration is environment-only and read once at startup.