Stars
Forks
Watchers
Developer links
Logchef
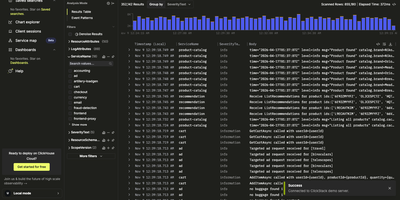
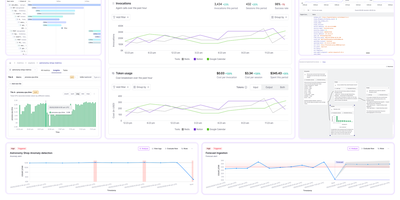
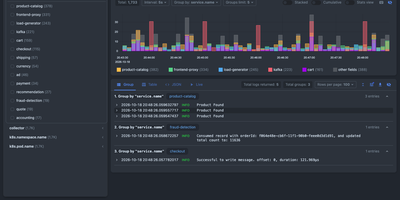
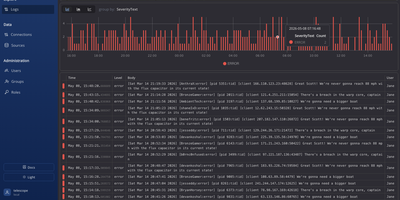
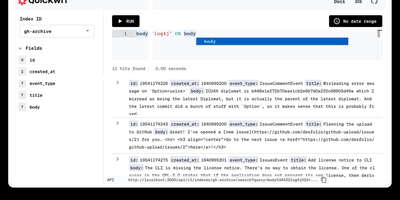
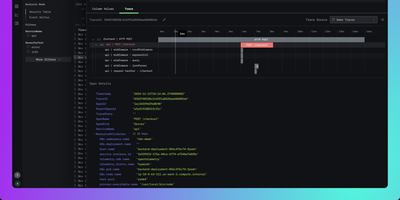
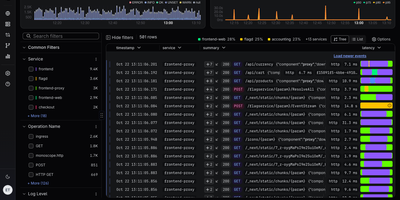
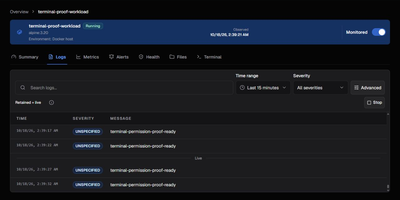
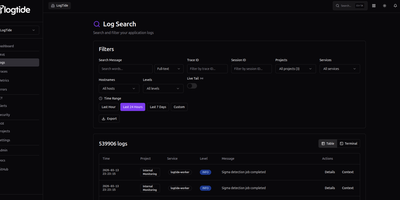
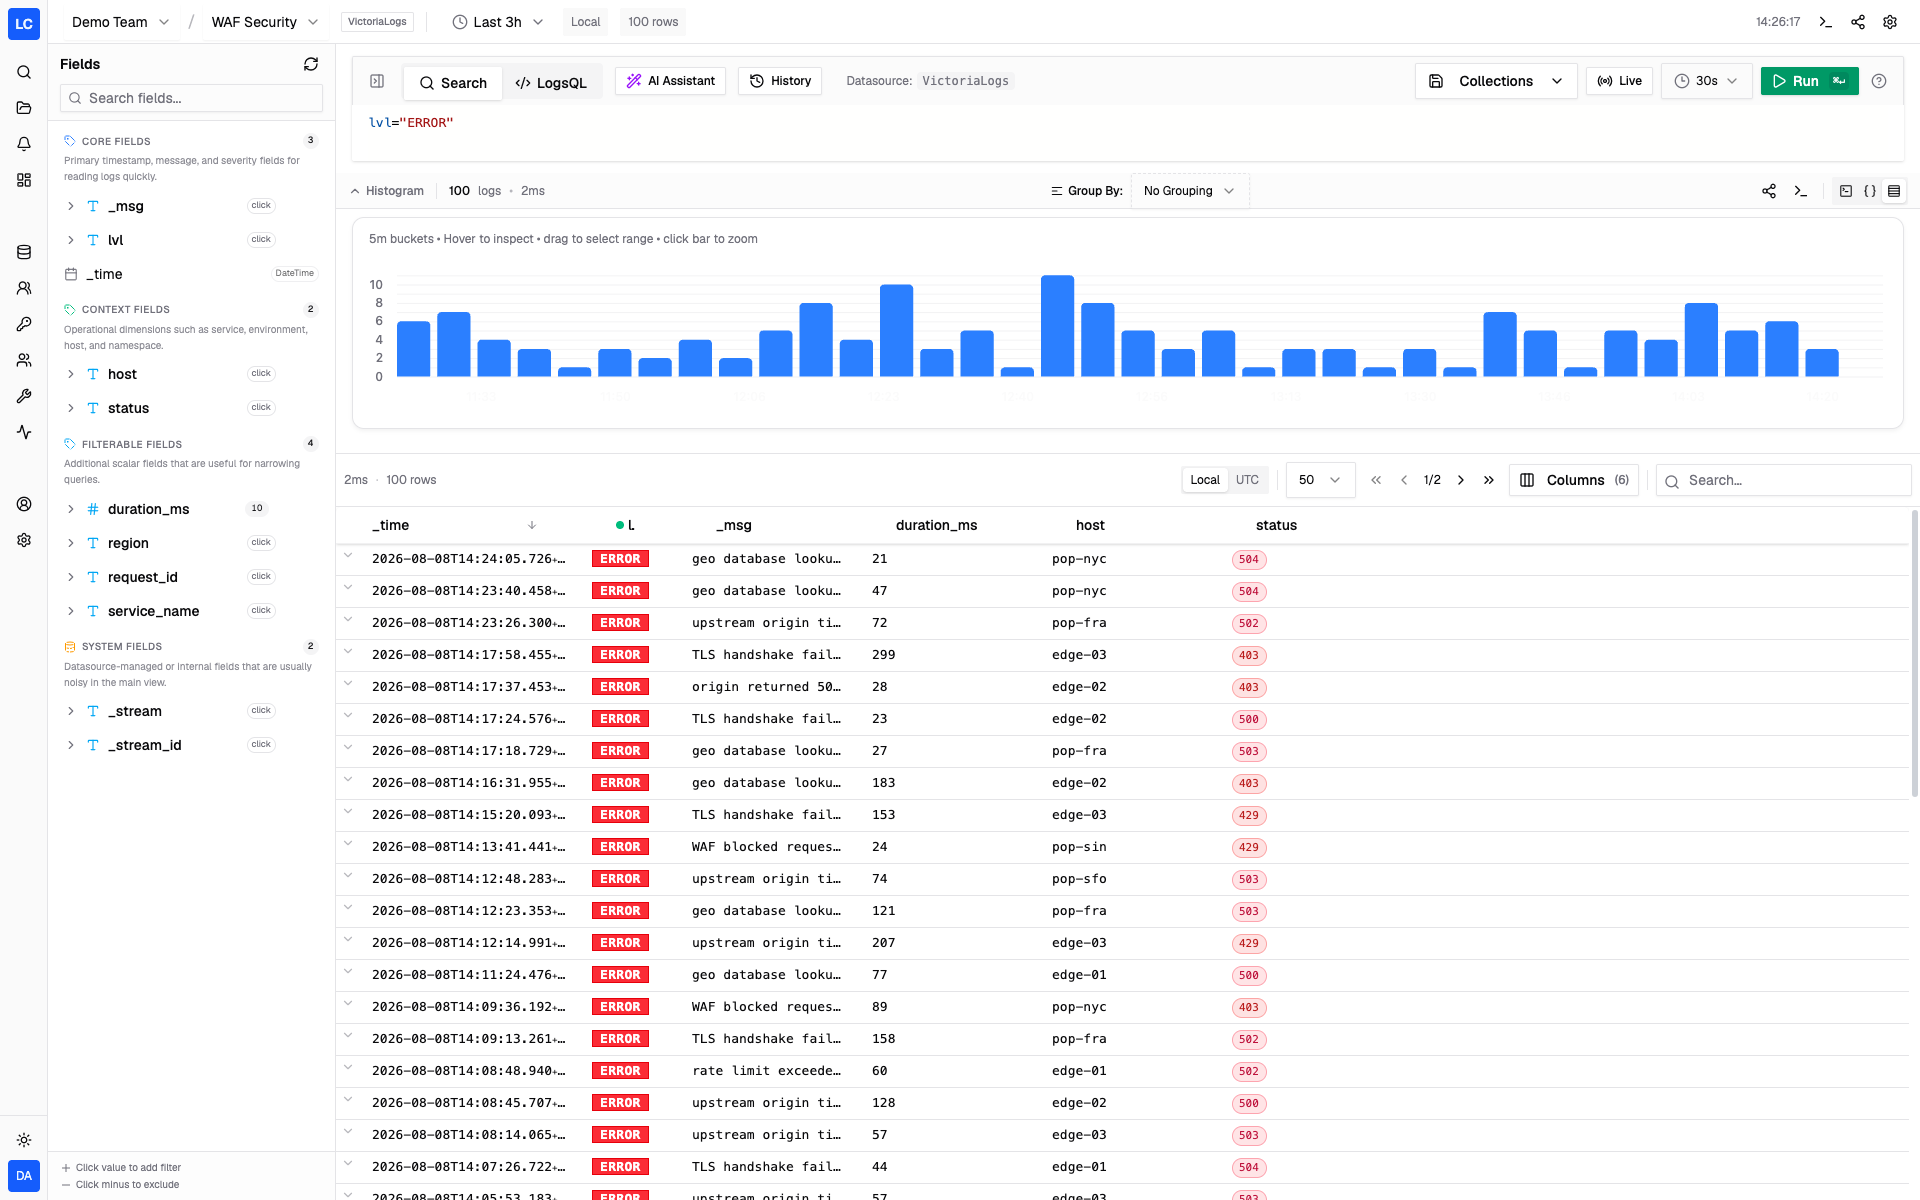
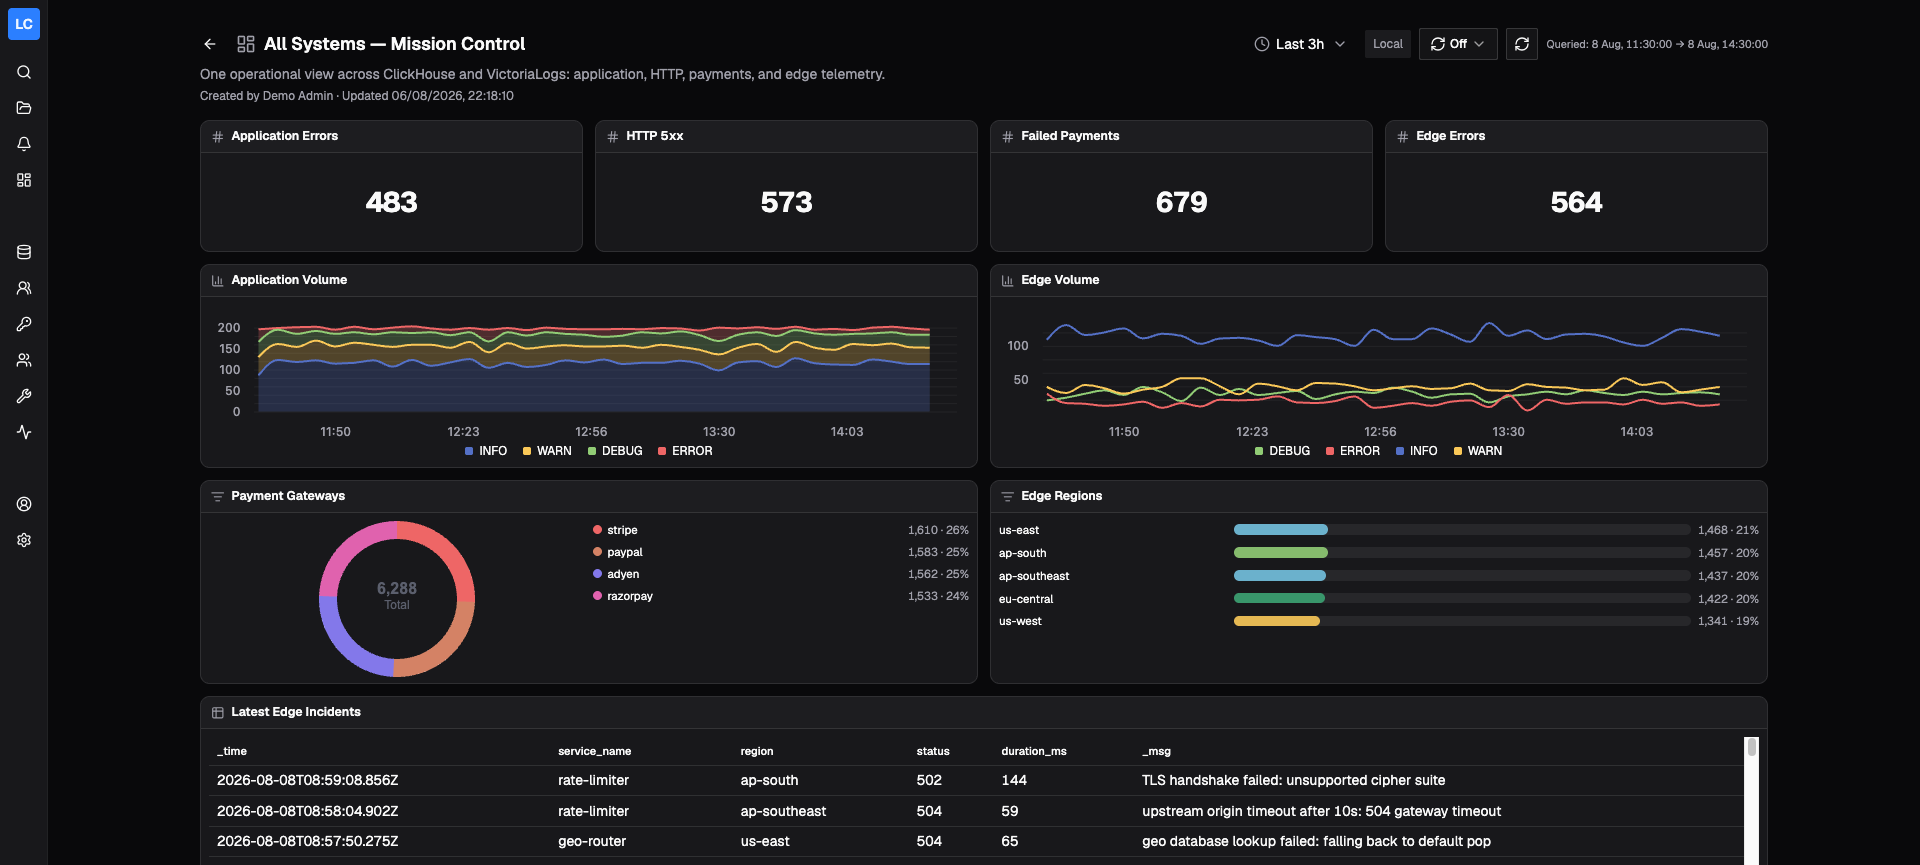
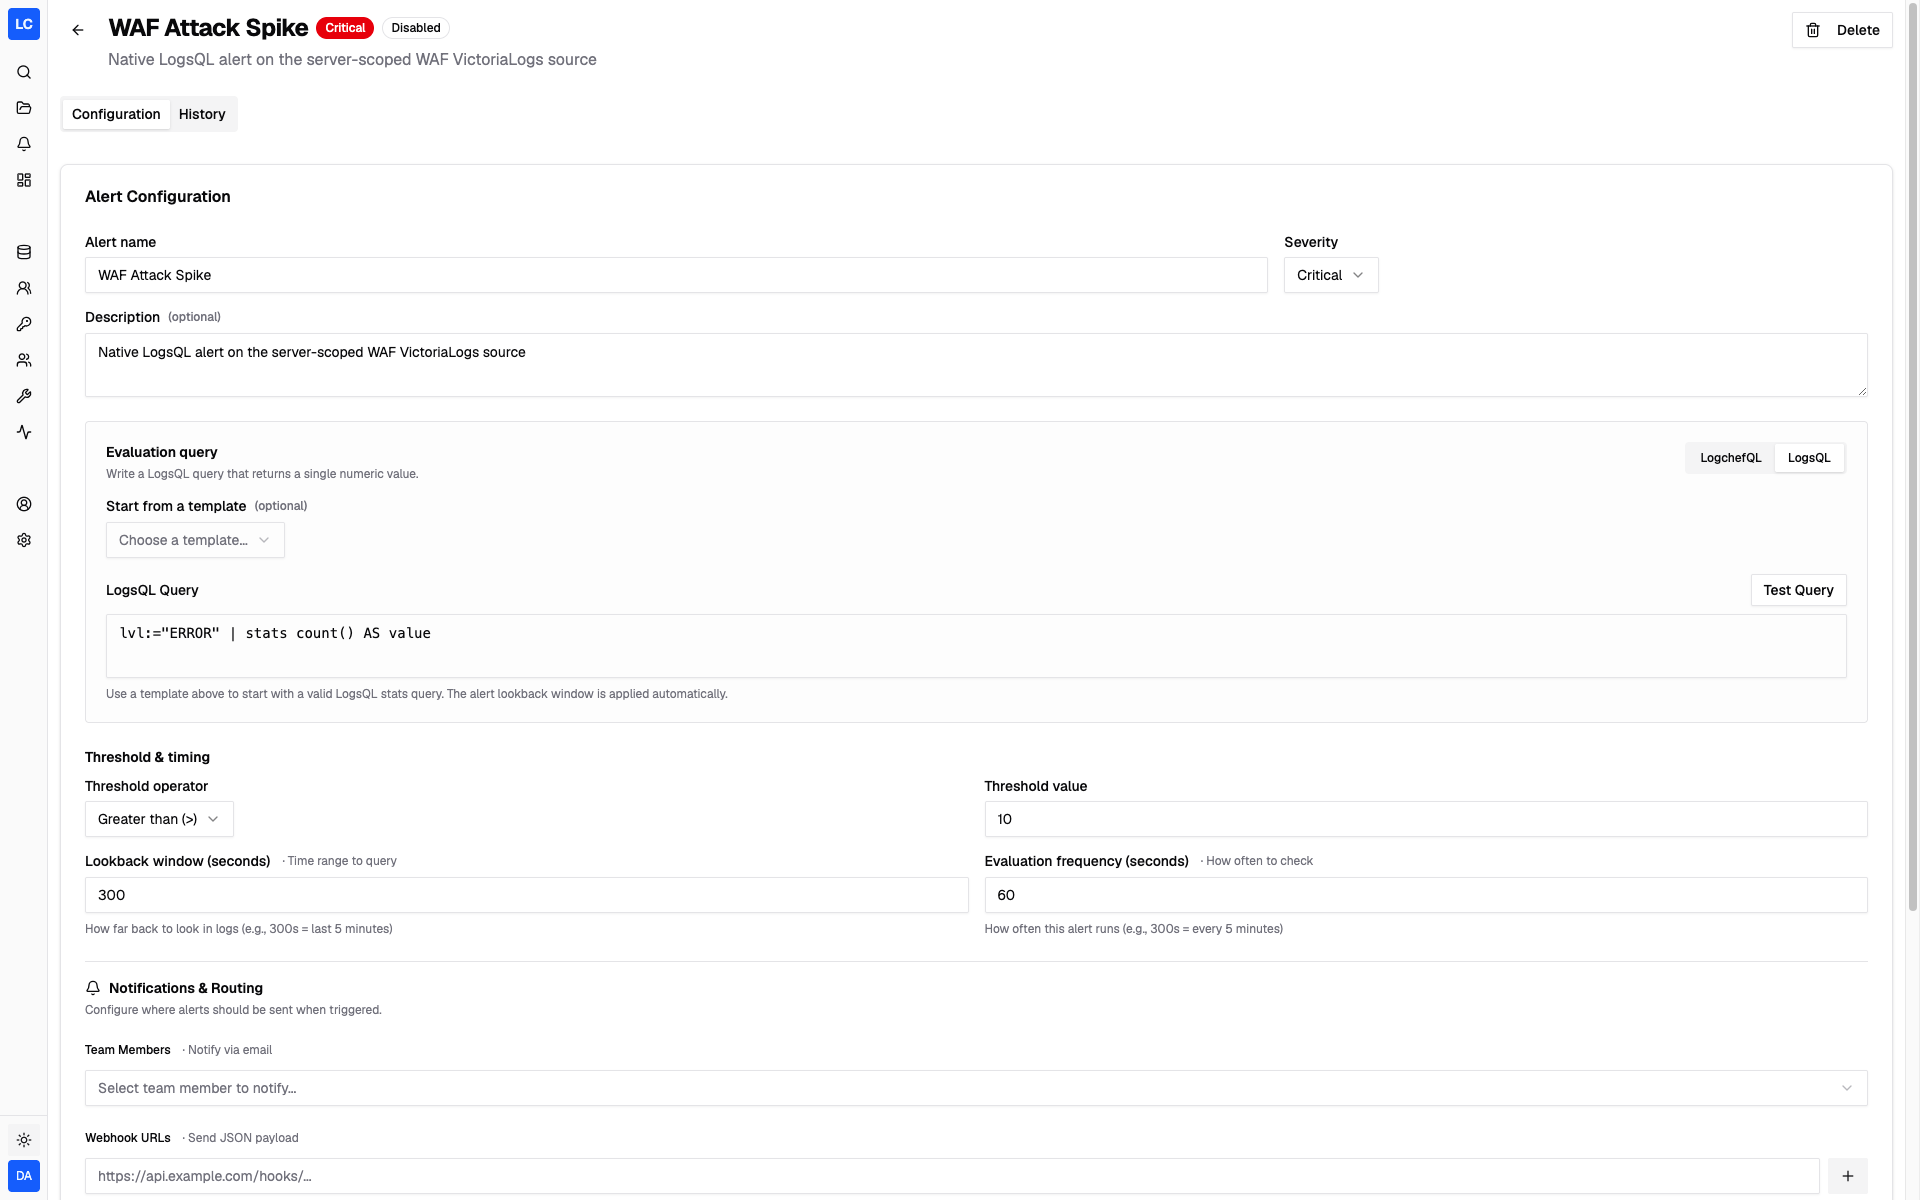
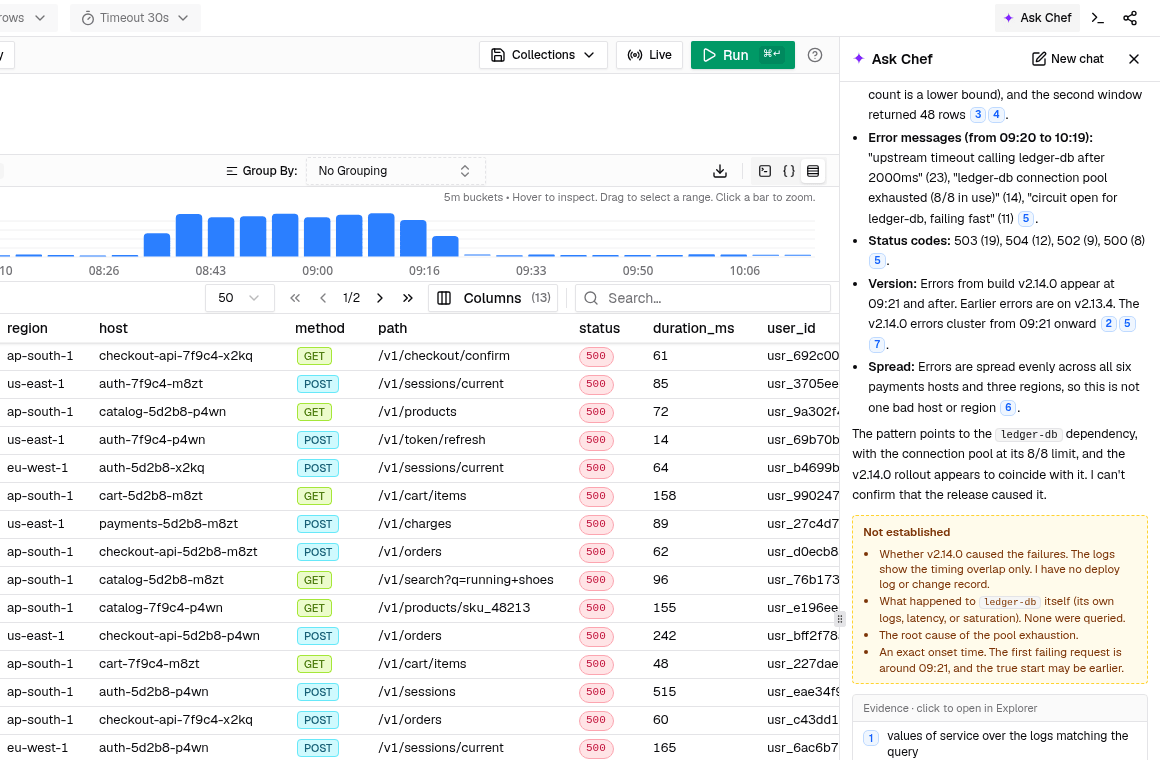
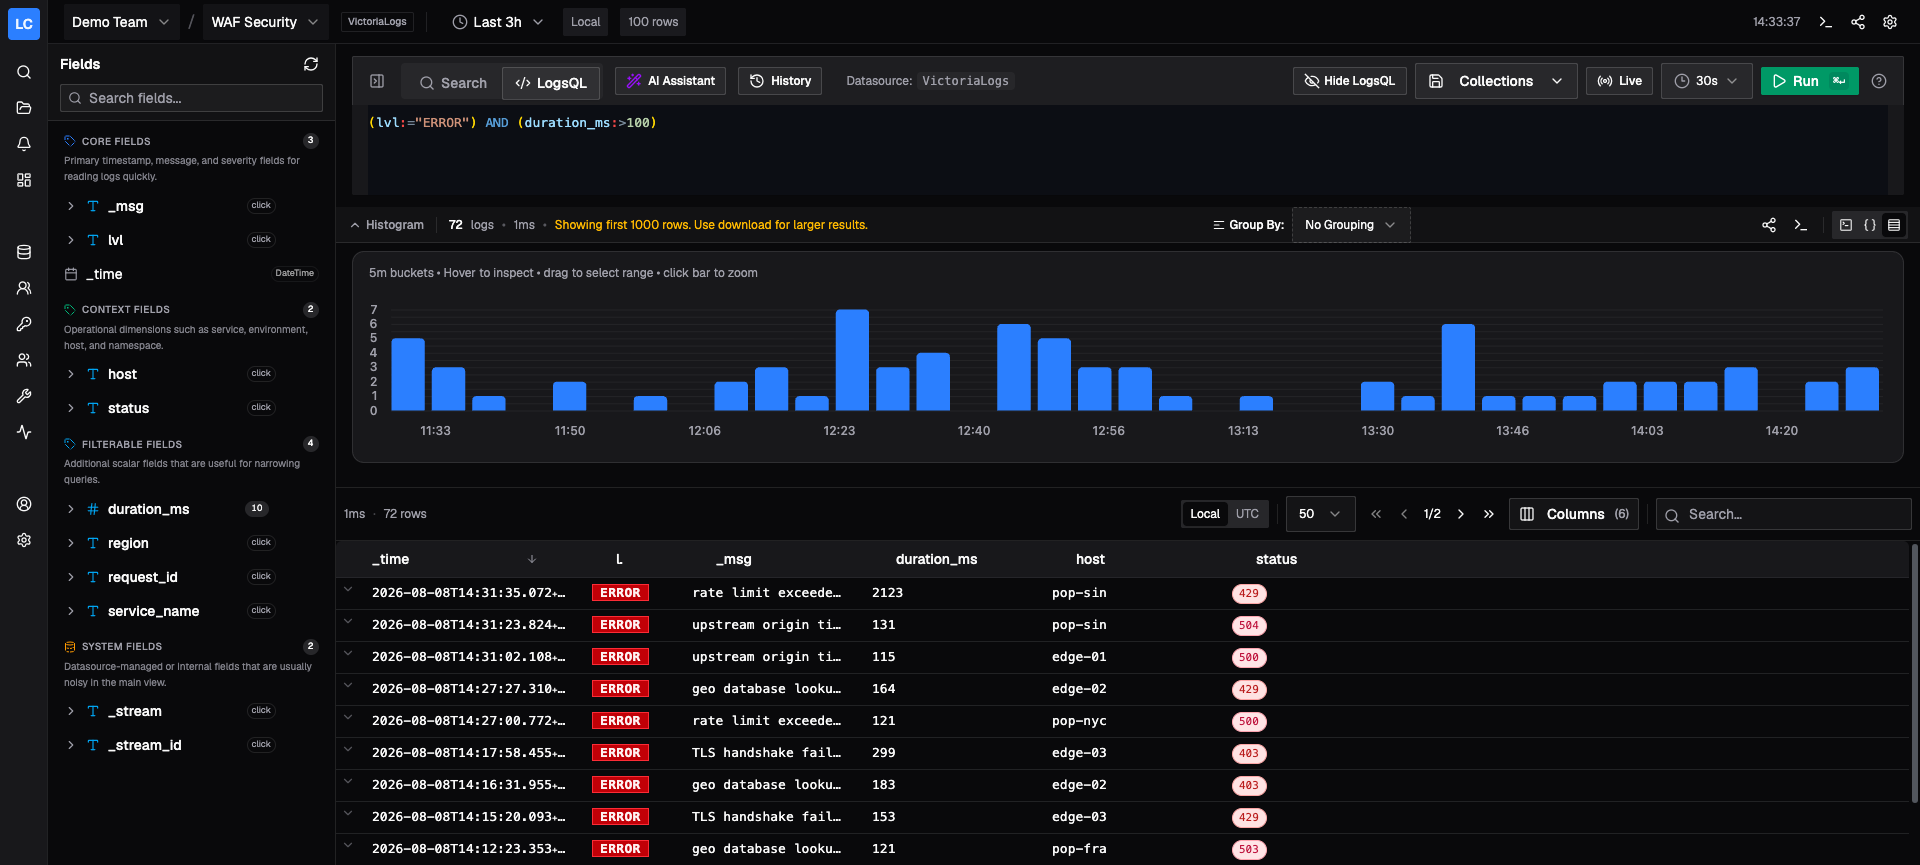
Logchef gives engineering teams a self-hosted workspace to search, live tail, chart, and alert on logs stored in ClickHouse or VictoriaLogs. Queries start in the explorer with LogchefQL or a native SQL or LogsQL editor, beside a field sidebar with value counts, a histogram, and a sortable results table. Live tail streams matching rows as they arrive. Dashboards combine ClickHouse and VictoriaLogs panels on one grid, with time series, stat, breakdown, and table views that can be dragged and resized. Scheduled alerts run a query on a set frequency, compare it with a threshold, then email team members or post JSON to webhooks. An AI assistant turns plain-language questions into queries, and Ask Chef investigates an incident, citing the rows behind each statement and listing what remains unproven. Teams, users, and roles decide who can see each datasource, with OIDC or built-in email and password sign-in. A command-line client queries, explains, and tails logs from the terminal, and a built-in MCP endpoint serves AI assistants. Running on a dedicated VPS on RepoCloud with guaranteed CPU, RAM, and SSD, full root SSH access, and a browser serial console. AGPL-3.0 licensed.
Benefits
- One Workflow Across Backends
- The same search workflow works on ClickHouse and VictoriaLogs, with native SQL or LogsQL one click away when a query needs full control.
- Follow Incidents Live
- Live tail streams matching rows into the explorer as they arrive, so on-call engineers watch an incident unfold instead of refreshing queries by hand.
- Alerts Without Extra Tools
- Scheduled alert rules run a query on a set frequency, compare the result with a threshold, and notify teammates by email or send JSON to a webhook.
- Questions In Plain Language
- An AI assistant converts natural-language questions into queries, and Ask Chef summarizes findings with evidence links and a list of what remains unproven.
Features
- Field Explorer Sidebar
- Browse core, context, and filterable fields with value counts, then click a value to add or exclude it in the query.
- Mission Control Dashboards
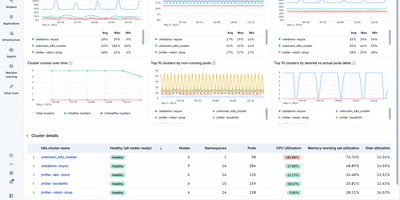
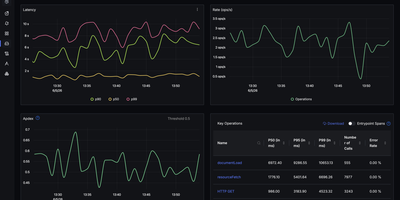
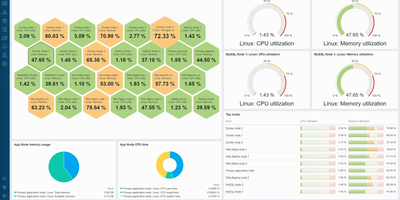
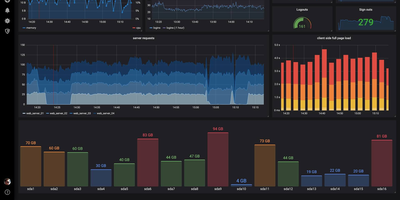
- Combine ClickHouse and VictoriaLogs panels on one resizable grid, using time series, stat, breakdown, and table visualizations.
- Alert Rule Editor
- Write a LogchefQL or LogsQL evaluation query, set severity, threshold, lookback window, and frequency, then test the query before saving.
- Teams And Access Control
- Organize users into teams with role-based access to each datasource, and sign in through OIDC or built-in email and password.
- Terminal And MCP Access
- Query, explain, tail, and diagnose from a command-line client, or connect AI assistants through the built-in MCP endpoint with OAuth sign-in.
- Histogram And Table Views
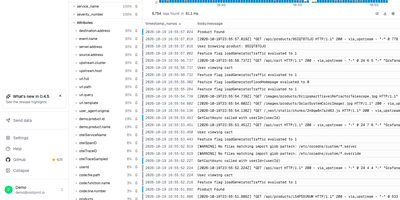
- Switch between a compact log view and a column table, with a histogram where dragging selects a time range and clicking a bar zooms.