Categories
Self-Hosted DevOps Dashboard Uptime Monitoring Server Monitoring Infrastructure Management Network VisualizationStars
Forks
Watchers
Developer links
CoreObs
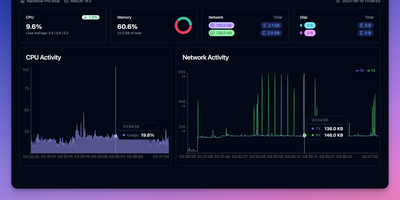
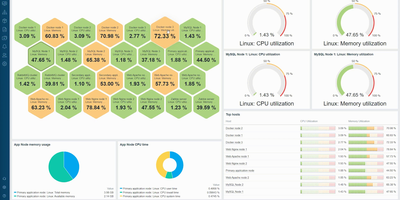
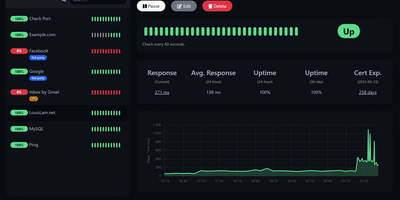
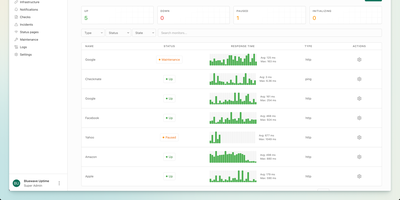
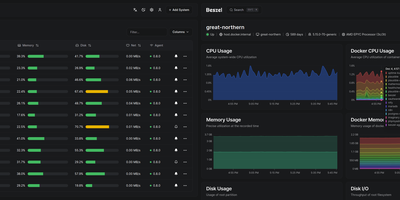
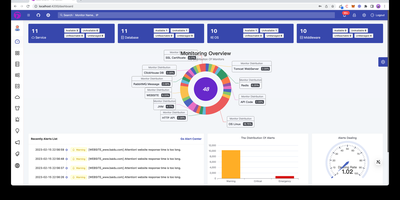
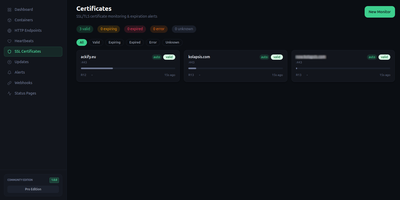
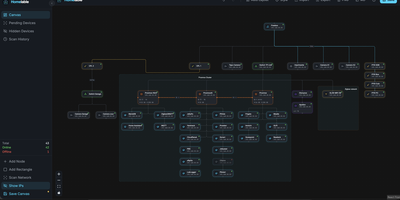
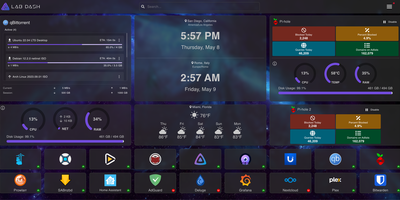
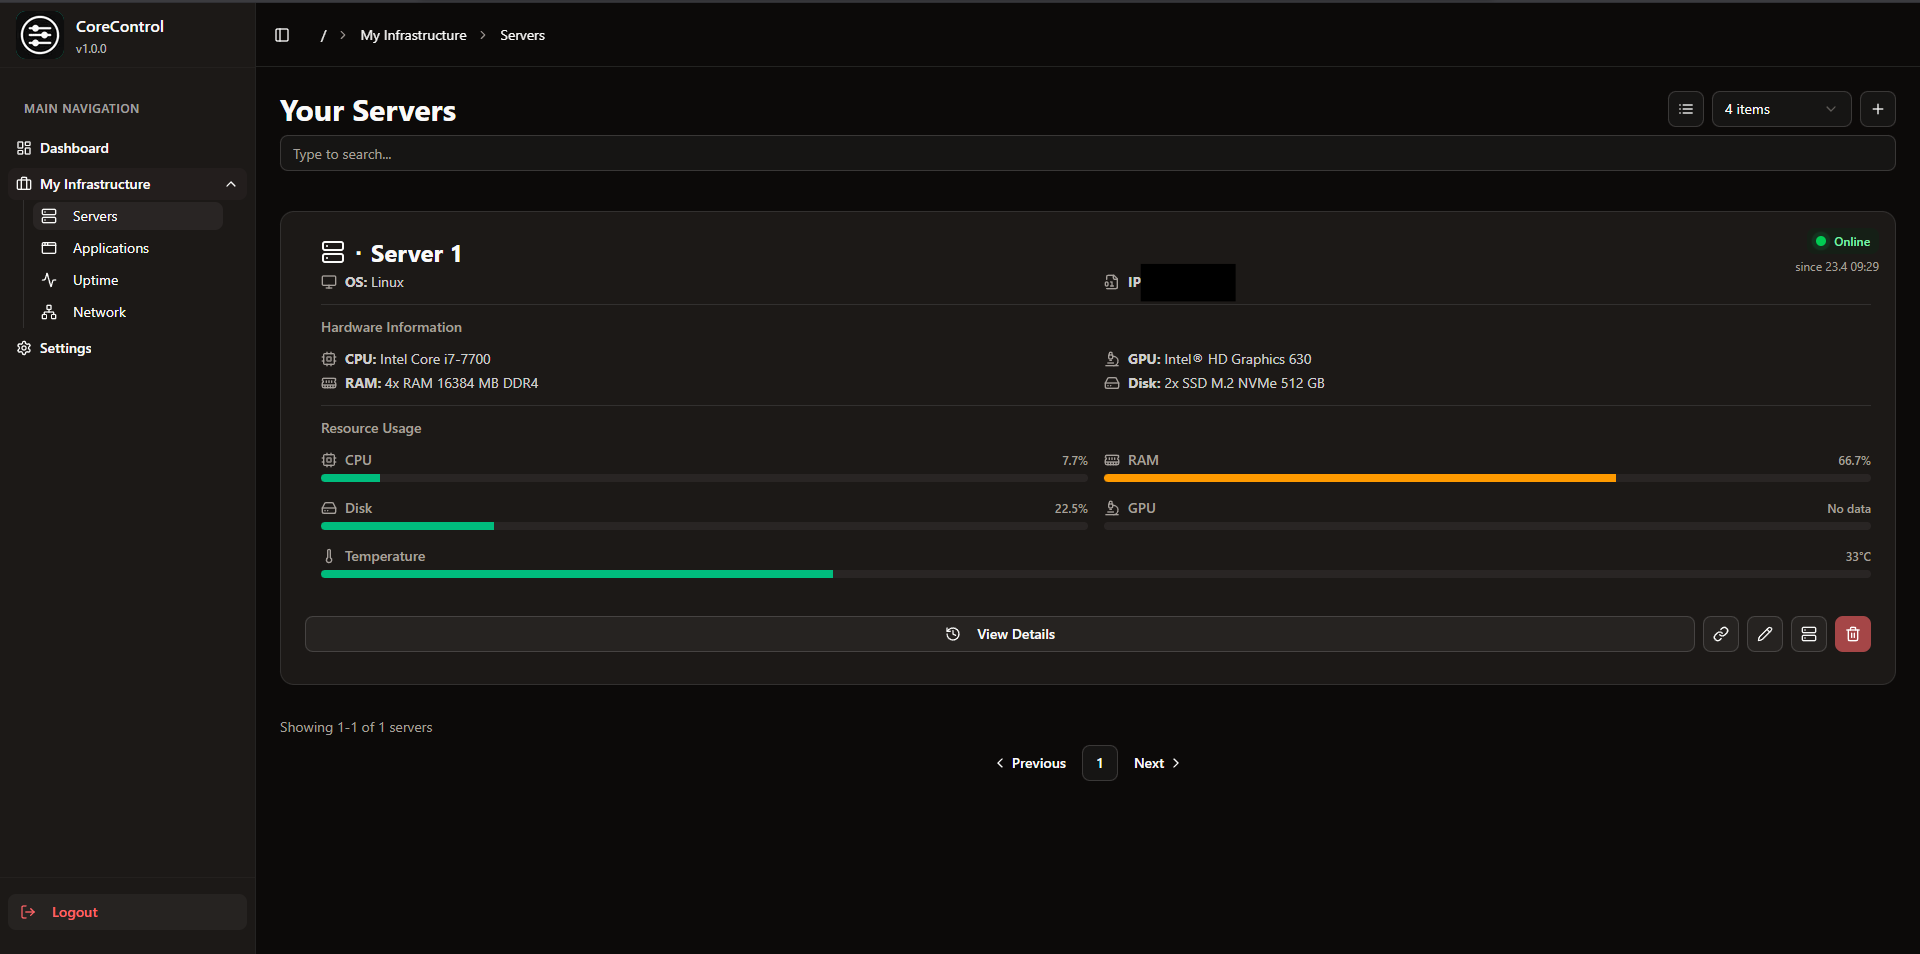
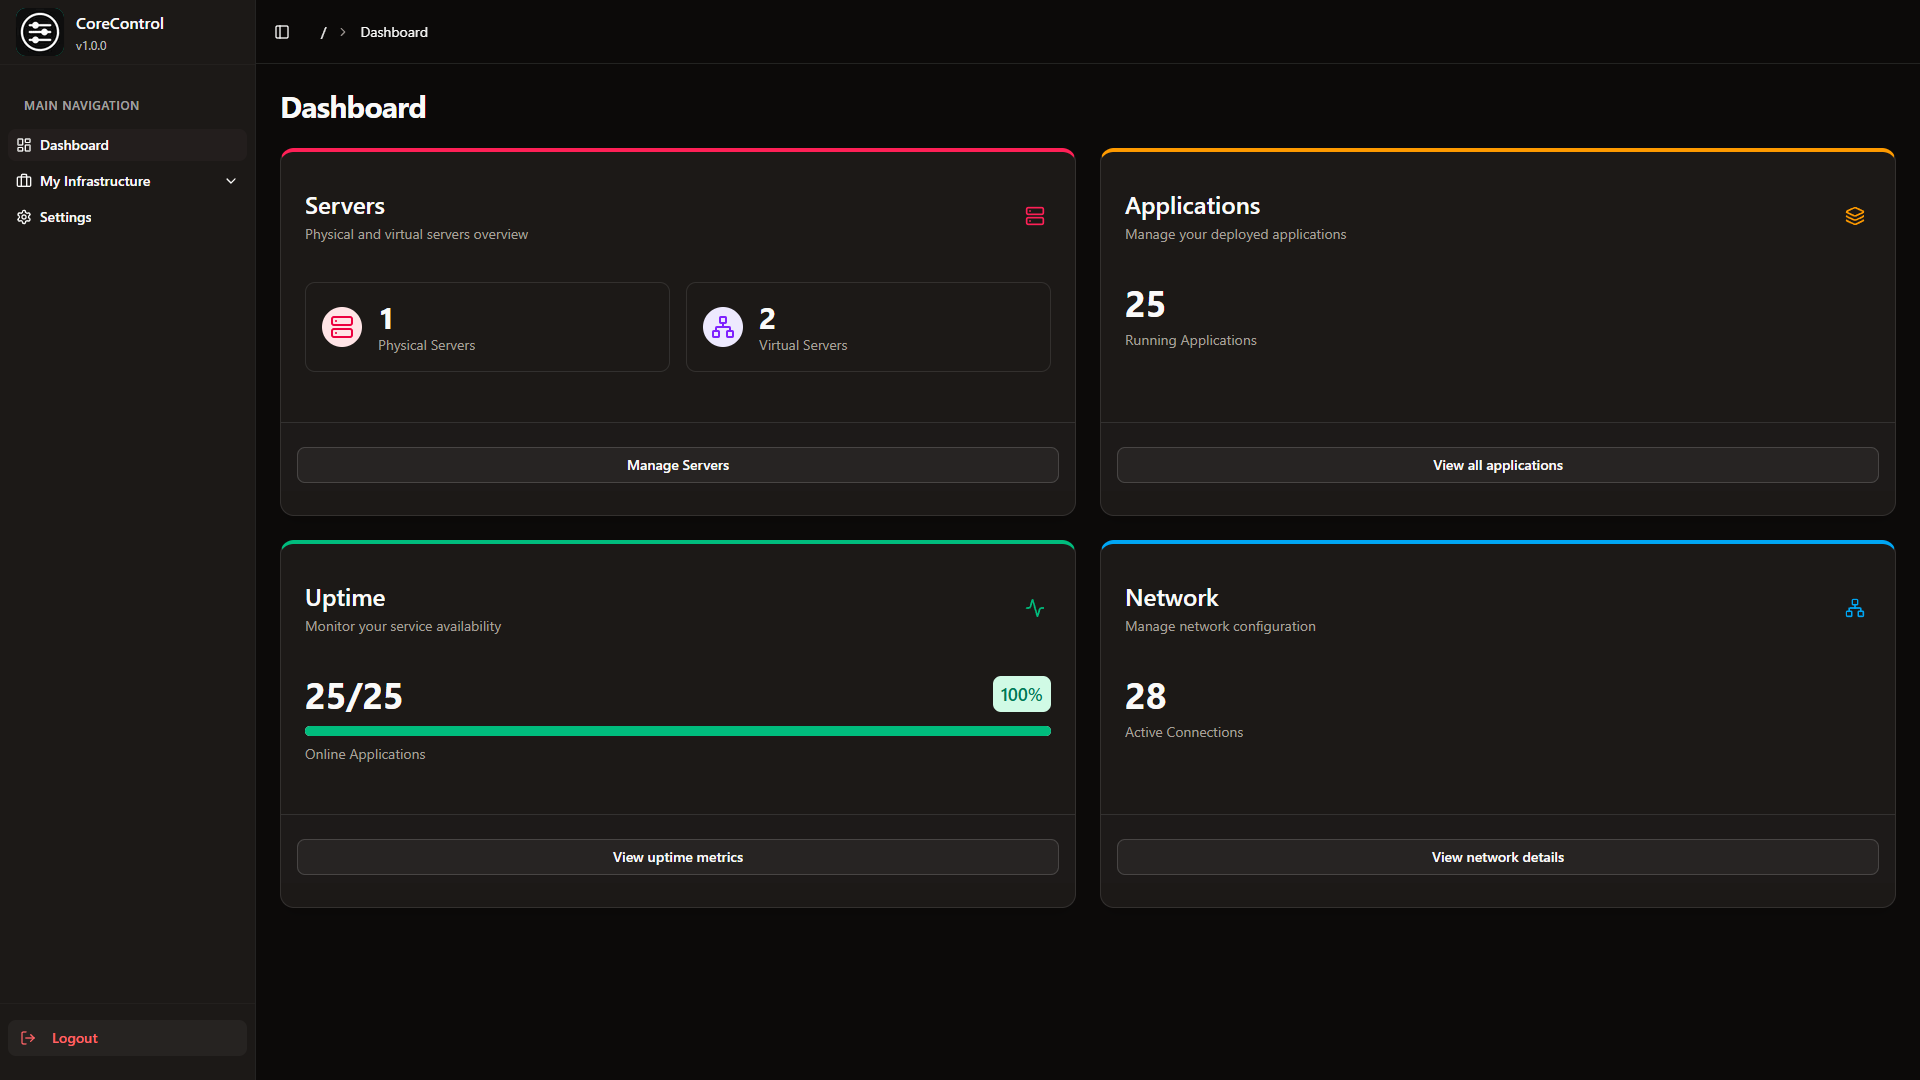
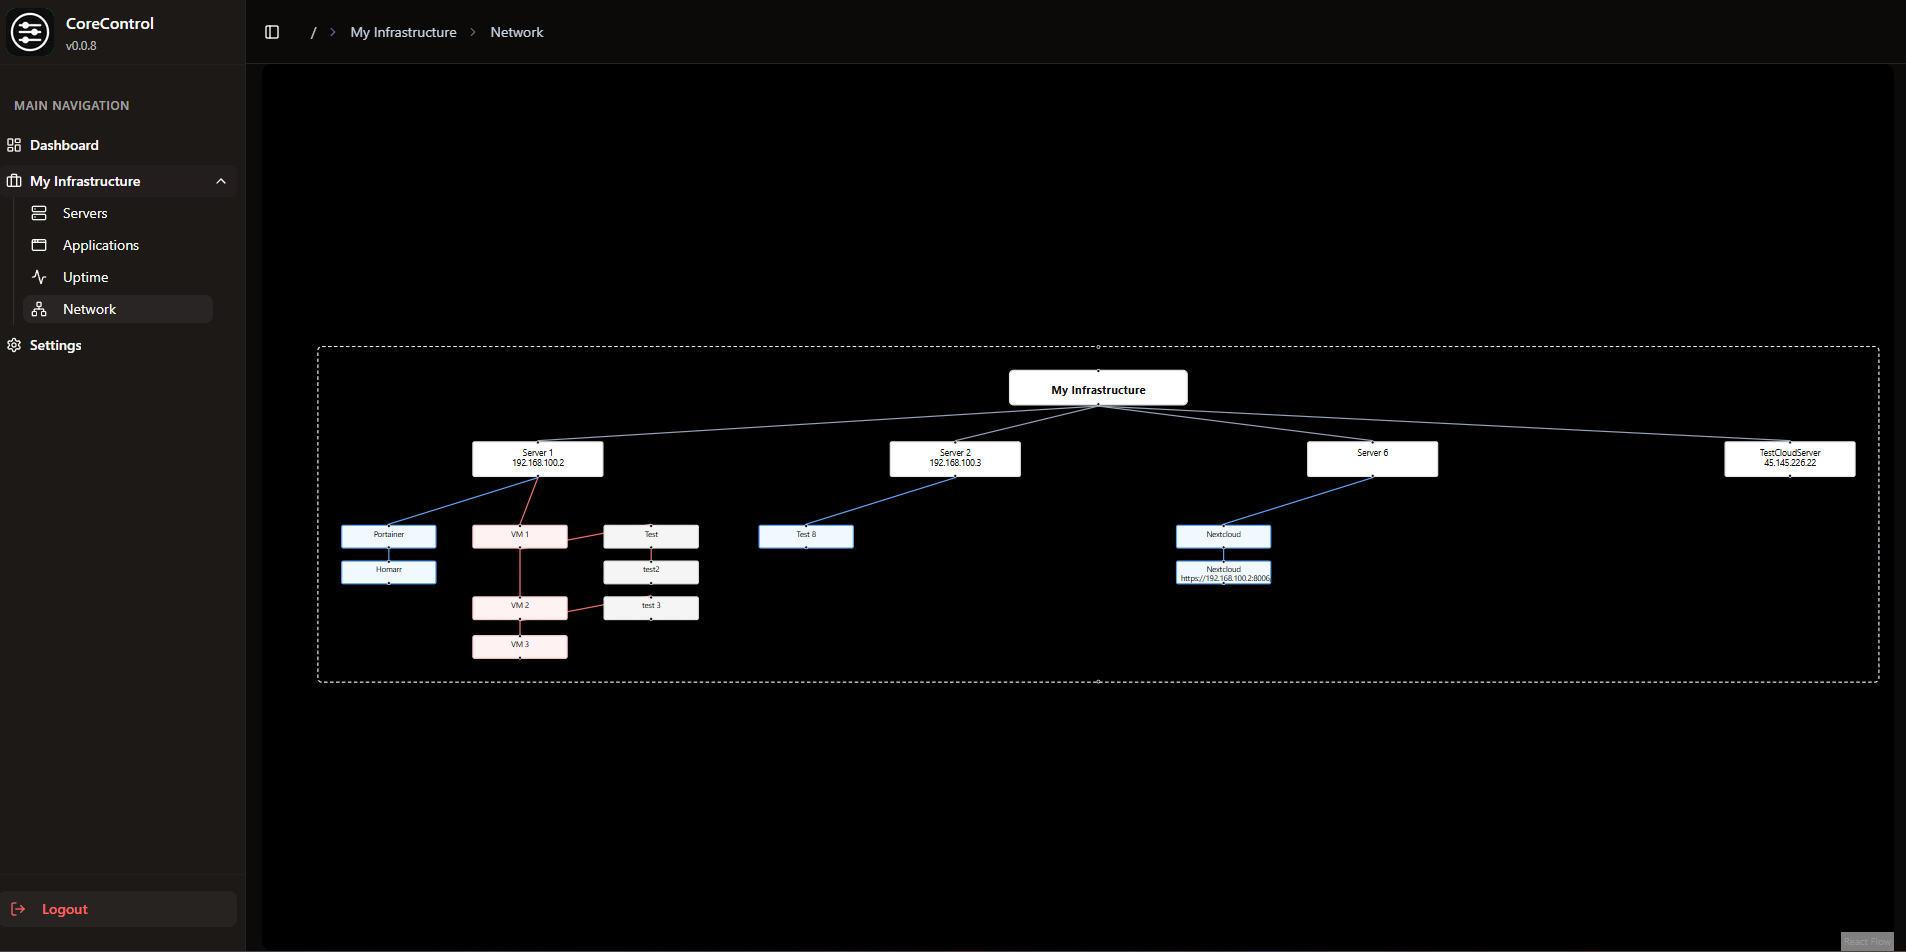
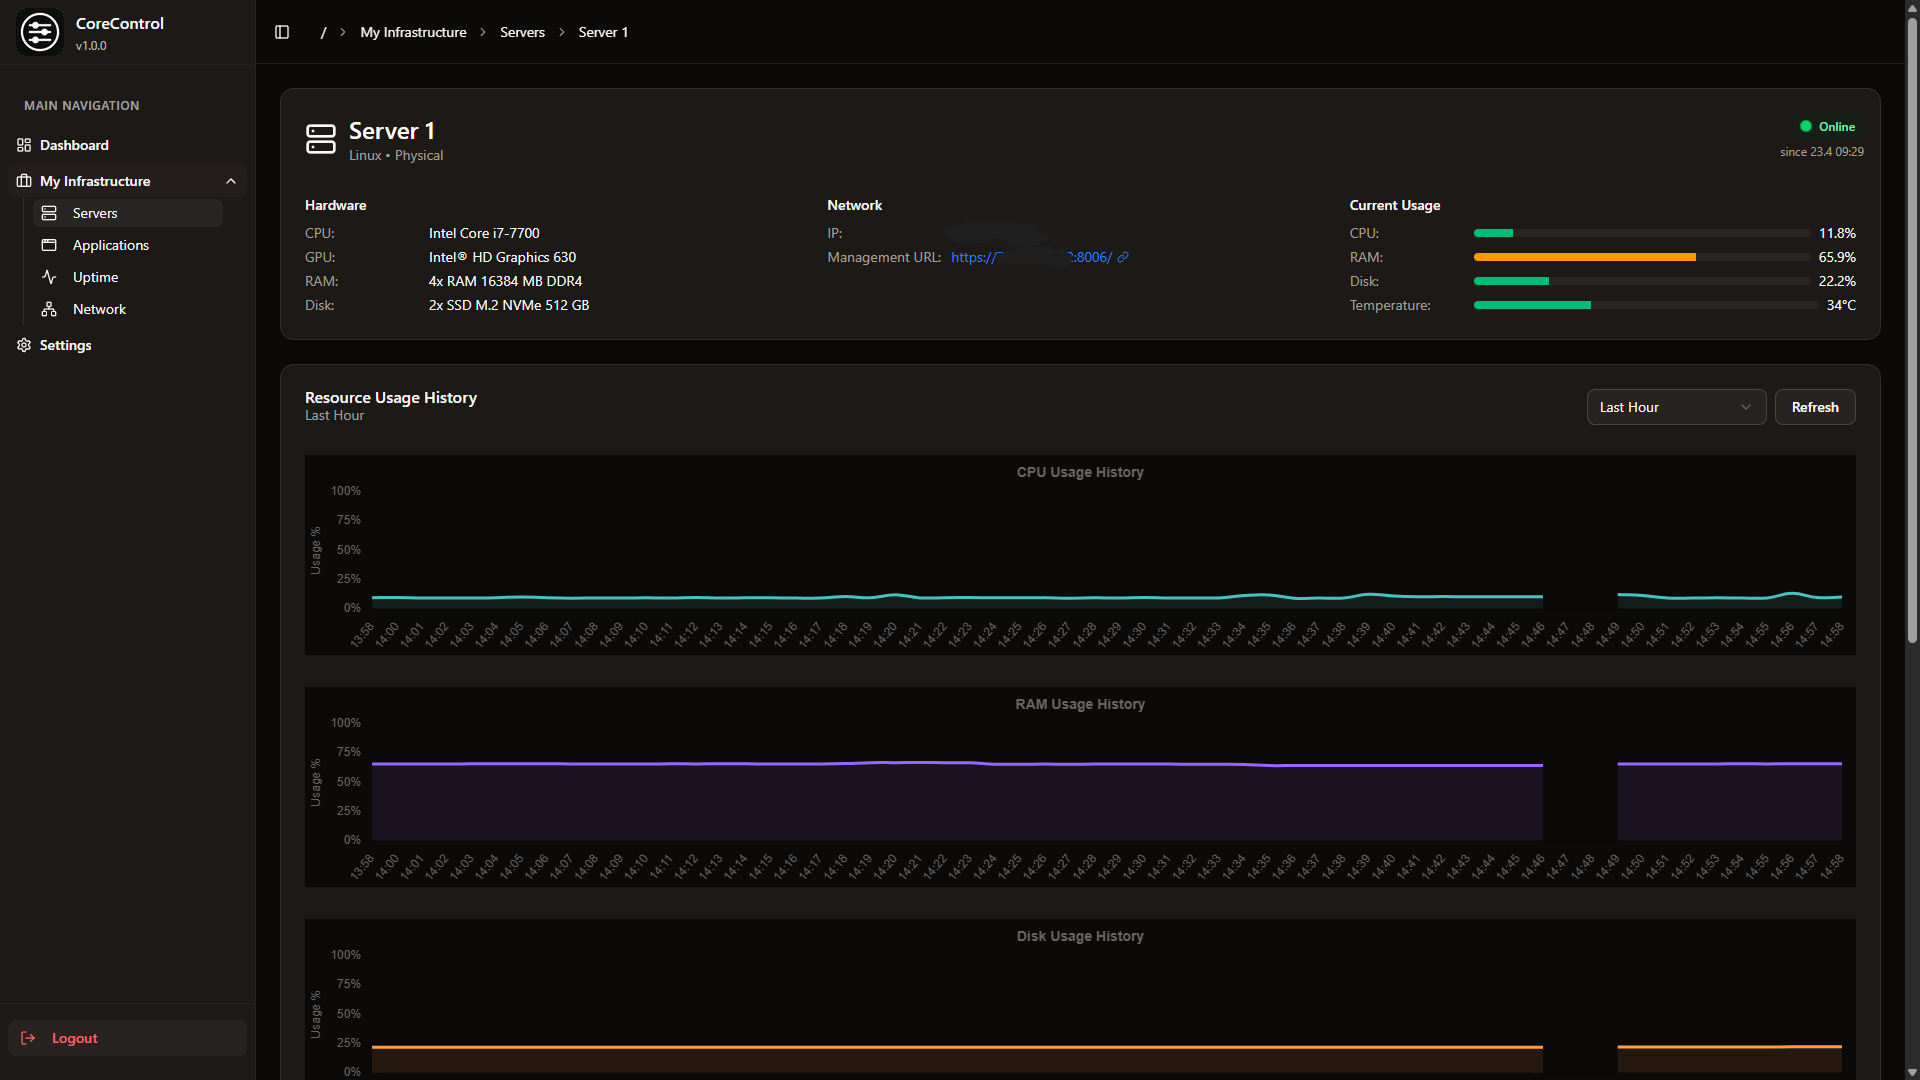
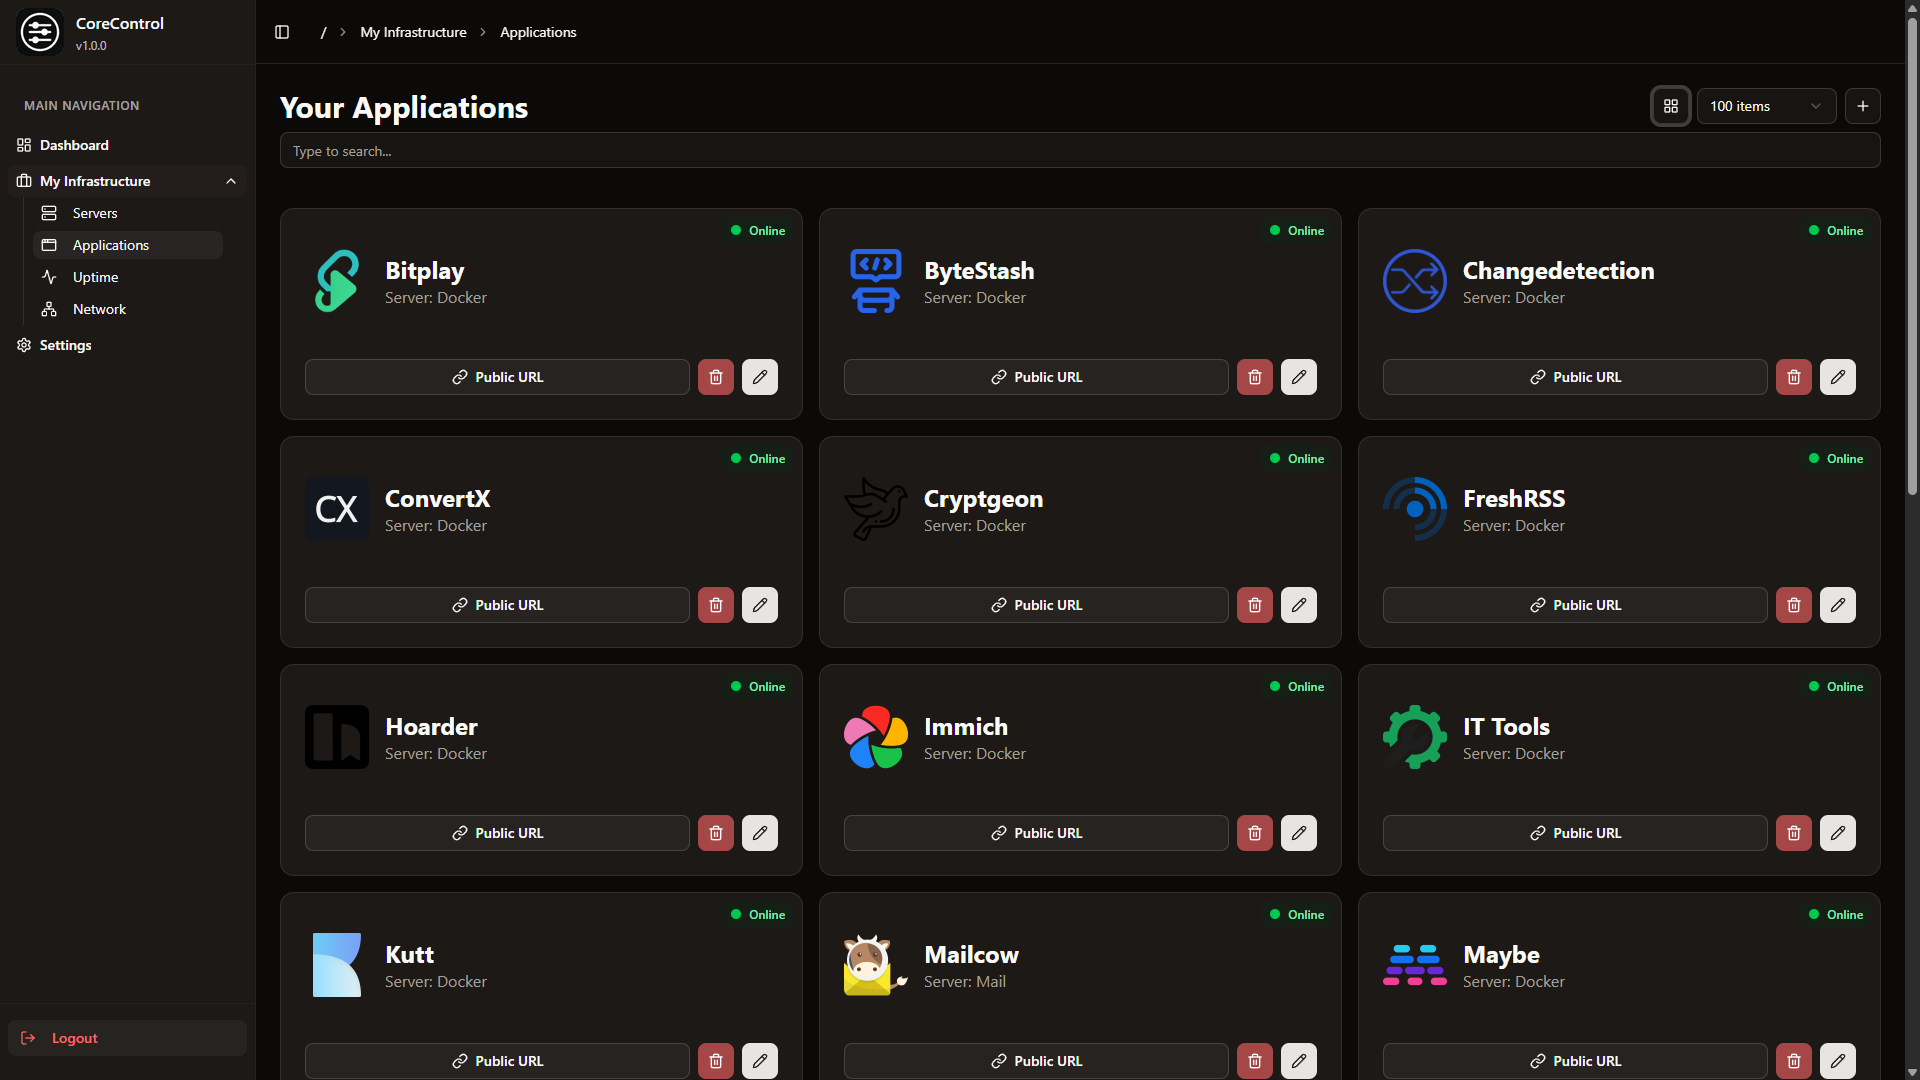
CoreObs delivers a unified self-hosted dashboard that replaces the typical combination of Uptime Kuma, Homer, and separate monitoring tools with a single interface for managing your entire server infrastructure. The Next.js frontend with shadcn components provides a modern dark-themed UI displaying server hardware metrics collected by a lightweight Go agent that leverages Glances for hardware abstraction — streaming real-time per-core CPU load, RAM utilization, NVIDIA GPU statistics, disk usage, system uptime, and load averages via WebSocket connections. The application registry tracks all self-hosted services with configurable uptime monitoring, availability history charts, and instant notifications through Discord, Telegram, Pushover, and email when services go down or recover. Quick-access links provide one-click navigation to each application's management panel directly from the dashboard. The network visualization module built on React Flow enables creating visual topology maps of your infrastructure with drag-and-drop nodes representing servers, switches, and services connected by labeled edges. Server data can be organized with tags, copied between entries, and monitored with configurable pagination and compact view modes. Deploy via Docker Compose with three containers — the Next.js web interface, the Go monitoring agent, and PostgreSQL 17 for persistent storage. Running on a dedicated VPS on RepoCloud with guaranteed CPU, RAM, and SSD, full root SSH access, and a browser serial console. MIT licensed.
Benefits
- Unified Server Infrastructure Dashboard
- Combines hardware monitoring, application uptime tracking, service bookmarks, and network topology visualization in a single interface replacing multiple separate self-hosted tools.
- Real-Time Hardware Metrics Streaming
- Streams per-core CPU load, RAM utilization, NVIDIA GPU statistics, disk usage, and system uptime from a lightweight Go agent using Glances for cross-platform hardware abstraction.
- Application Uptime Monitoring
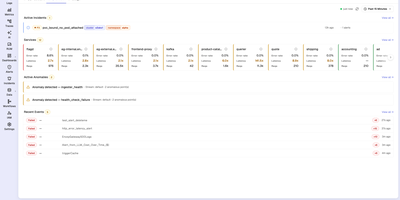
- Tracks availability of all self-hosted services with configurable check intervals, history charts, and instant notifications via Discord, Telegram, Pushover, and email on status changes.
- Visual Network Topology Maps
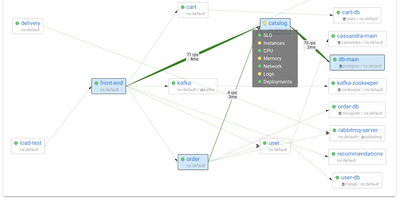
- Creates drag-and-drop infrastructure diagrams using React Flow with nodes for servers, switches, and services connected by labeled edges for documenting network architecture.
Features
- Server Hardware Monitoring
- Go agent with Glances integration streaming CPU, RAM, GPU, disk, and uptime metrics to the dashboard via WebSocket with per-core granularity.
- Application Uptime Tracking
- Monitors self-hosted service availability with configurable URLs, history charts, compact views, and multi-channel notifications on state changes.
- Network Flowcharts
- React Flow-based visual editor for creating infrastructure topology diagrams with draggable nodes, connection edges, and exportable layouts.
- Service Quick Access
- Organizes self-hosted applications with direct management links, categorization tags, and selfh.st icon integration for visual identification.
- Docker Compose Deployment
- Three-container architecture with Next.js web frontend, Go monitoring agent, and PostgreSQL 17 database deployable via single Docker Compose file.