Stars
Forks
Watchers
Developer links
HyperDX
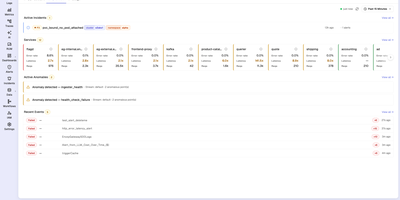
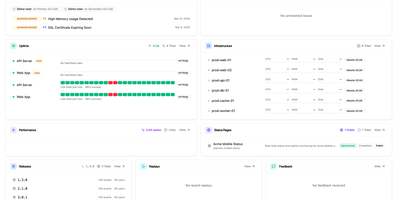
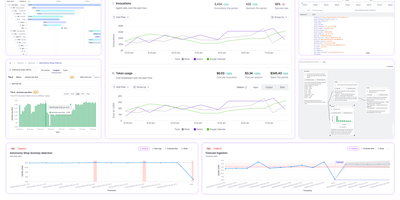
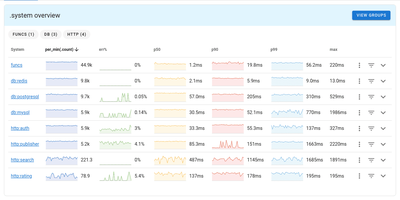
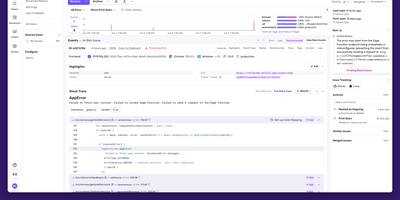
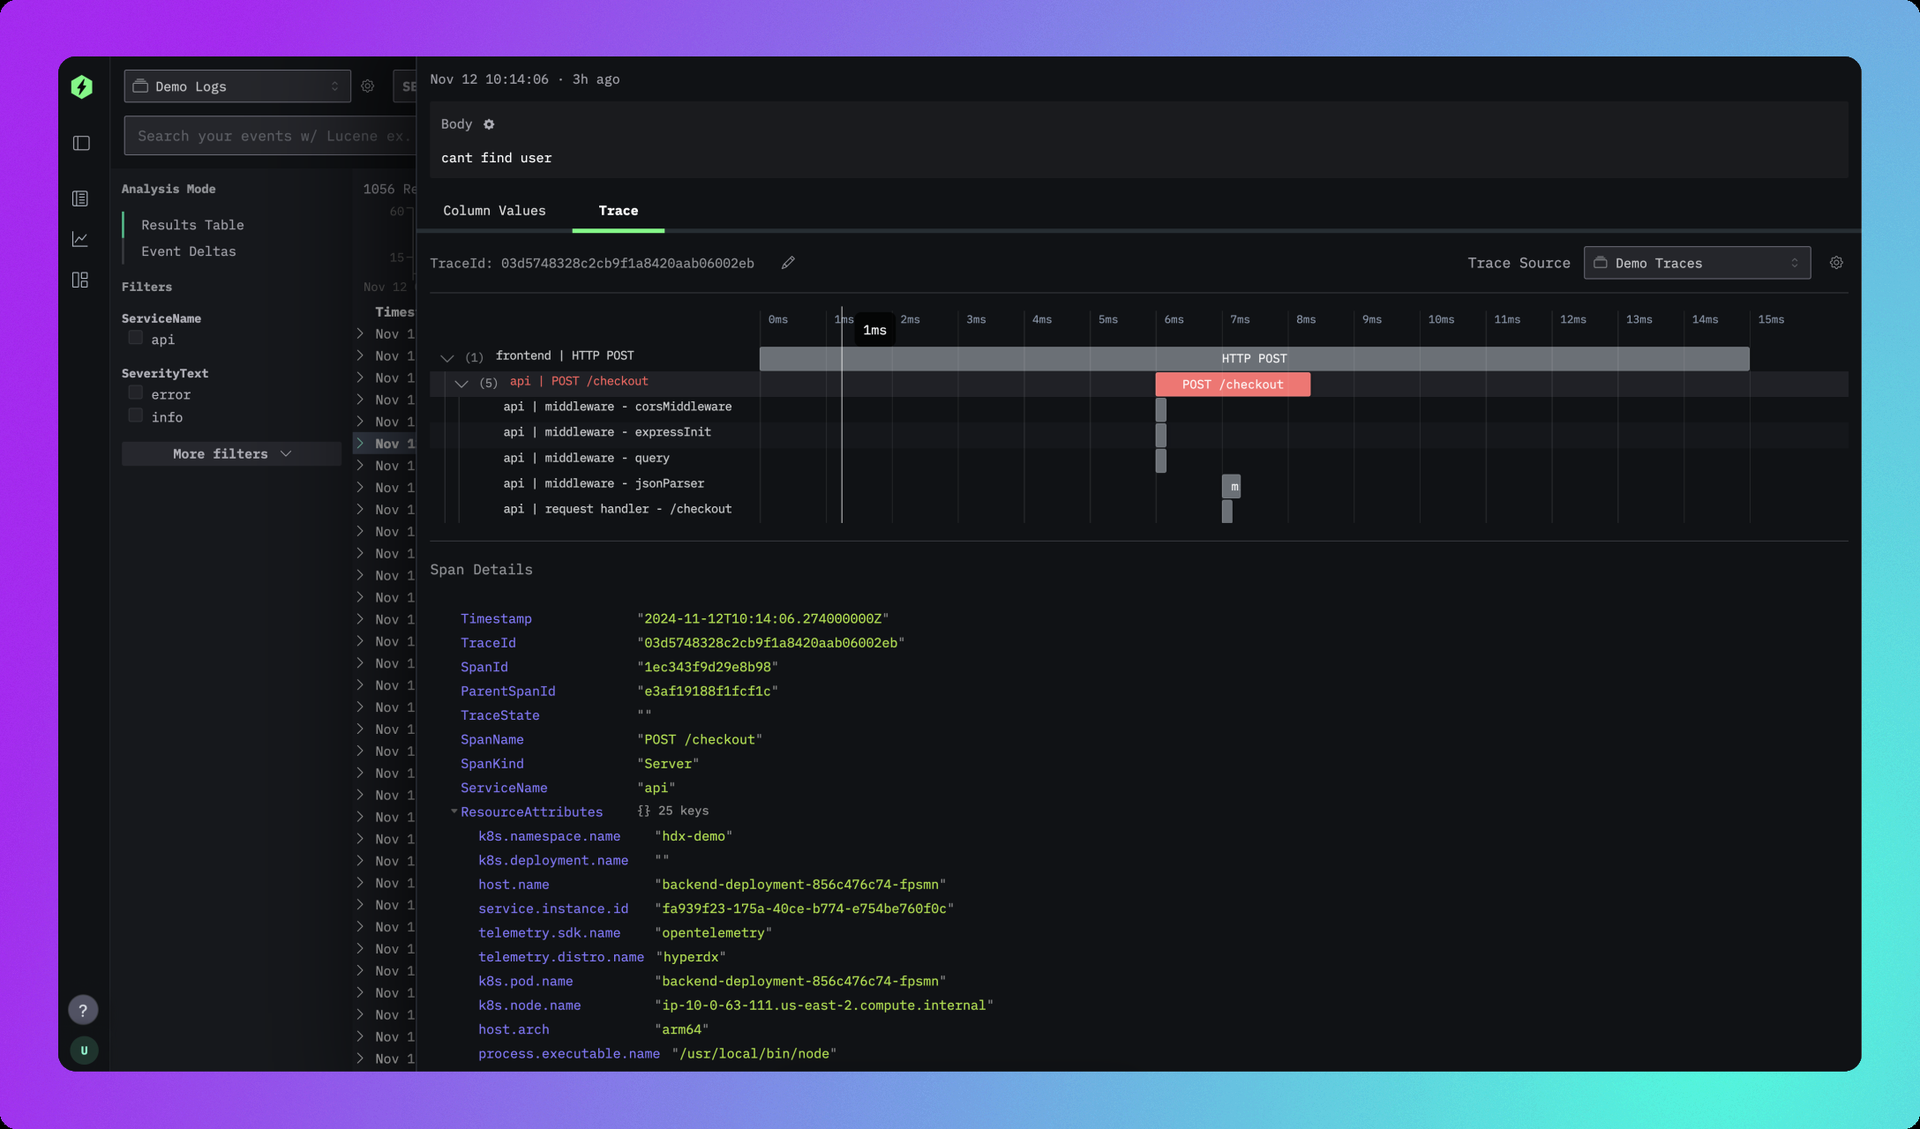
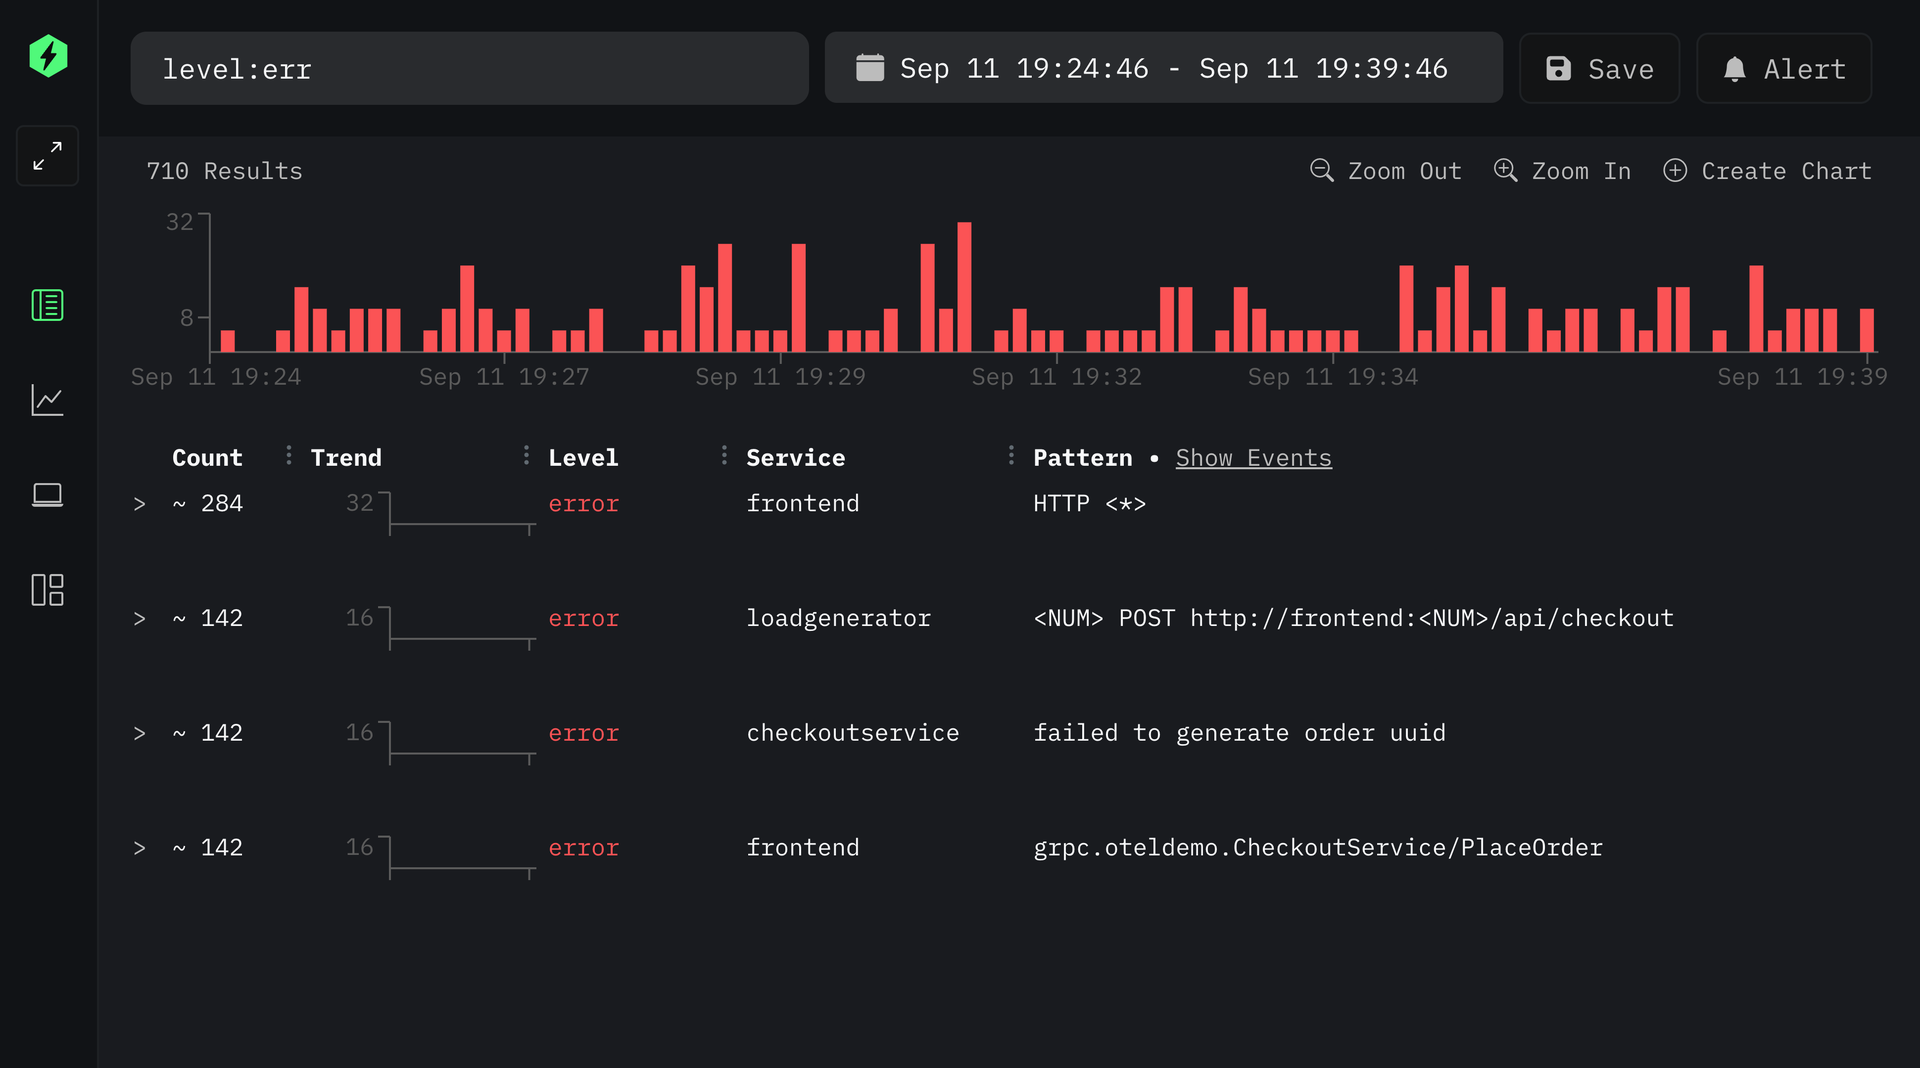
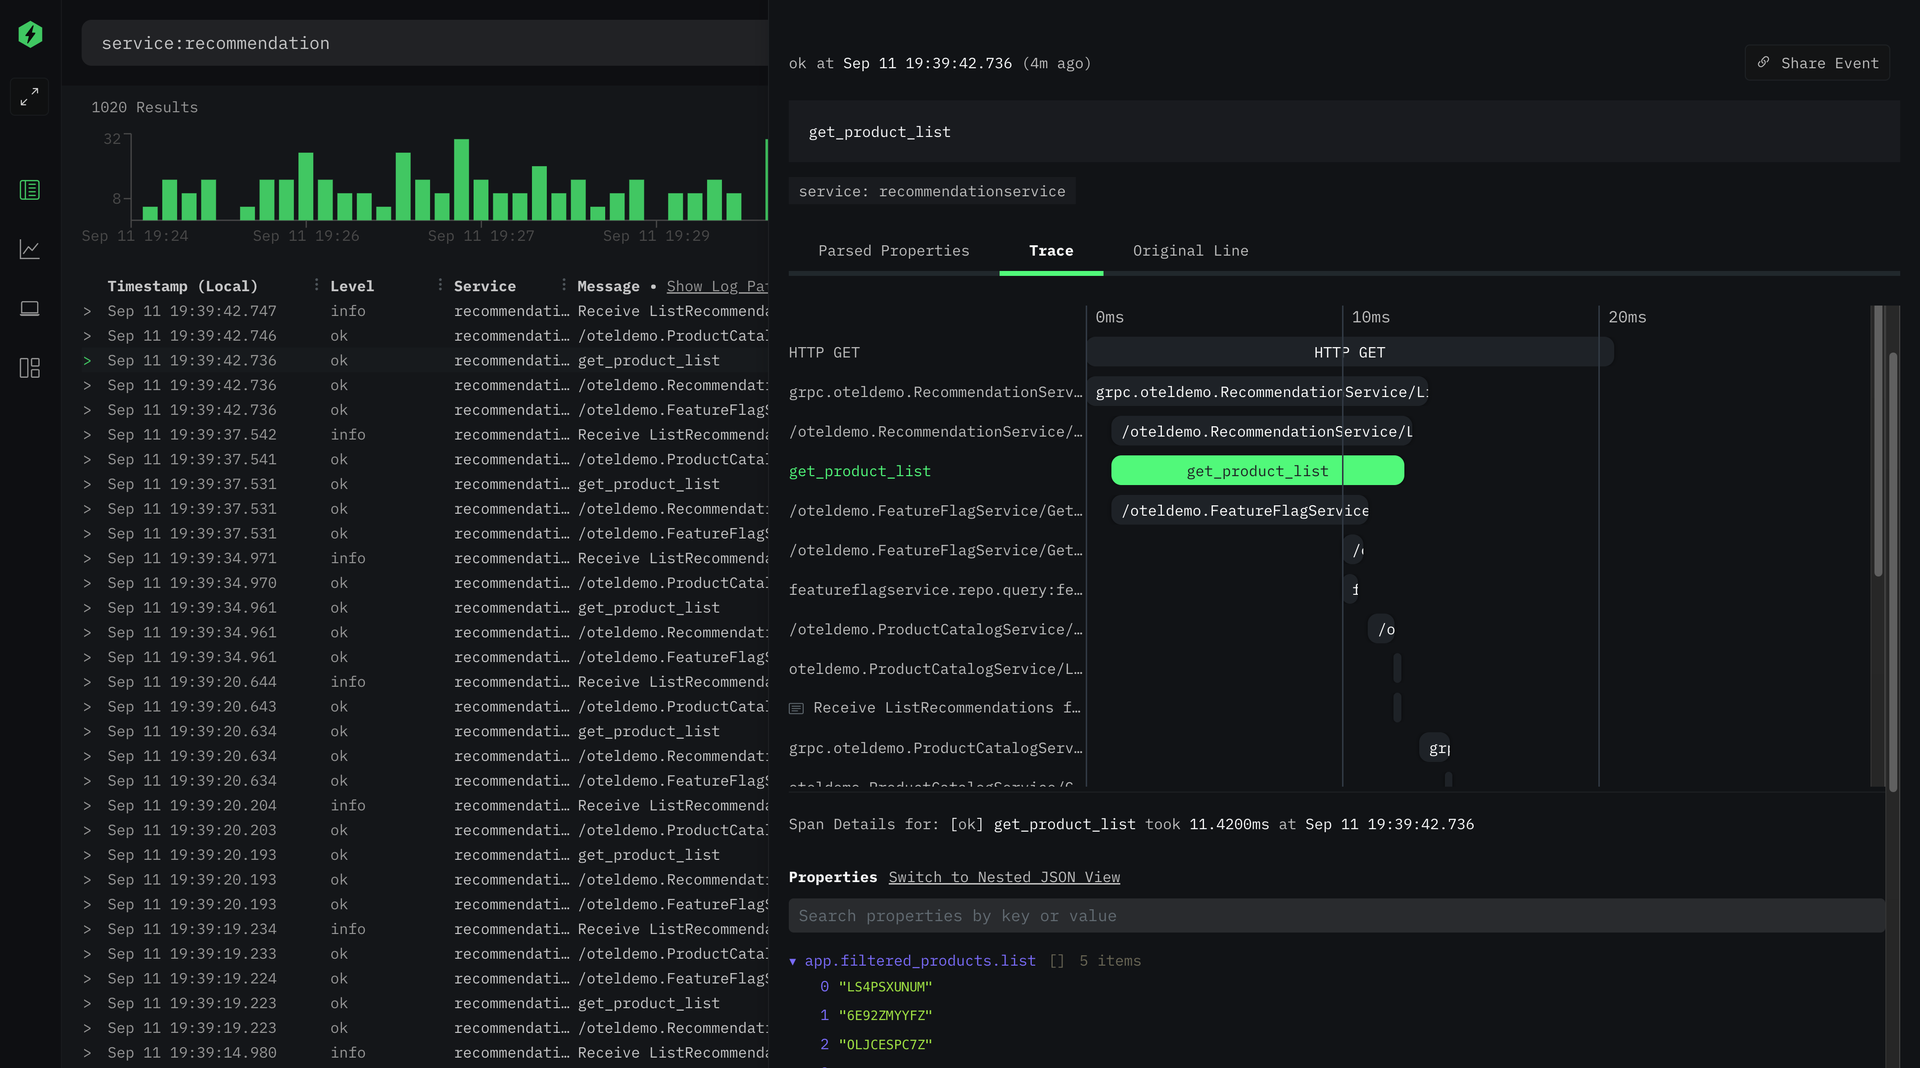
HyperDX correlates logs, metrics, traces, session replays, and errors in a single interface so engineers can resolve production incidents in minutes instead of hours. Nearly 10,000 GitHub stars reflect its role as the integrated UI layer for the ClickStack blueprint endorsed by ClickHouse. The platform connects to any ClickHouse cluster as its storage backend, working with existing table structures without requiring data migration or proprietary ingestion formats. An intuitive Lucene-like search syntax supports full-text queries and property filtering like level:err or service.name:api without needing SQL, while native JSON string querying and event delta analysis surface anomalies in high-cardinality datasets. One-click cross-signal correlation lets you jump from a log line to its distributed trace, from a slow span to associated logs, or from a frontend session replay to the backend errors it triggered. The OpenTelemetry Collector accepts telemetry via OTLP on gRPC port 4317 and HTTP port 4318, supporting automatic instrumentation for Node.js, Python, Java, Go, Ruby, and browser applications. APM tracks HTTP request latency, database query duration, and external service calls with trace waterfall visualizations. Configurable alerts trigger via webhook, Slack, PagerDuty, or email when thresholds are breached. Deploys via Docker Compose with ClickHouse, MongoDB, Redis, and the OpenTelemetry Collector. Running on a dedicated VPS on RepoCloud with guaranteed CPU, RAM, and SSD, full root SSH access, and a browser serial console. MIT licensed.
Benefits
- Unified Cross-Signal Observability
- Correlate logs, traces, metrics, session replays, and errors in one interface with one-click navigation between signals to reduce mean-time-to-resolution for production incidents.
- ClickHouse Powered Performance
- Blazing fast searches and visualizations optimized for ClickHouse columnar storage, handling billions of telemetry events with sub-second query response on high-cardinality data.
- Schema Agnostic Flexibility
- Works on top of existing ClickHouse schemas without requiring data migration, proprietary ingestion formats, or changes to your current table structures and materialized views.
- OpenTelemetry Native Ingestion
- Accepts telemetry via OTLP on gRPC port 4317 and HTTP port 4318, supporting automatic instrumentation for Node.js, Python, Java, Go, Ruby, and browser applications.
Features
- Log Search and Analysis
- Intuitive Lucene-like full-text search with property filtering, native JSON querying, live tail streaming, and event delta analysis for anomaly detection.
- Distributed Trace Waterfall
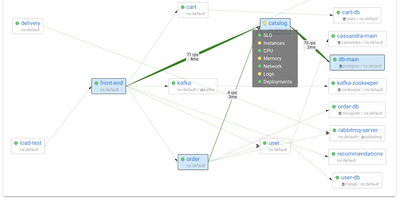
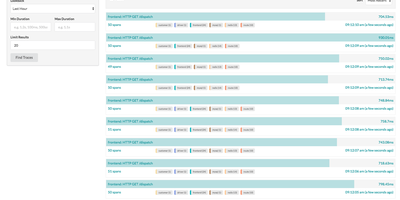
- APM trace visualization shows HTTP request flows across microservices with span-level latency breakdown, database query timing, and external service call tracking.
- Session Replay
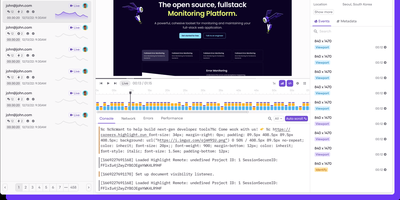
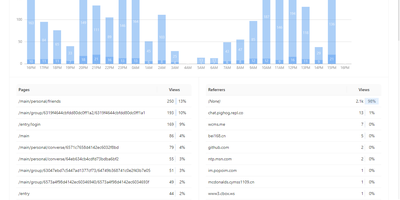
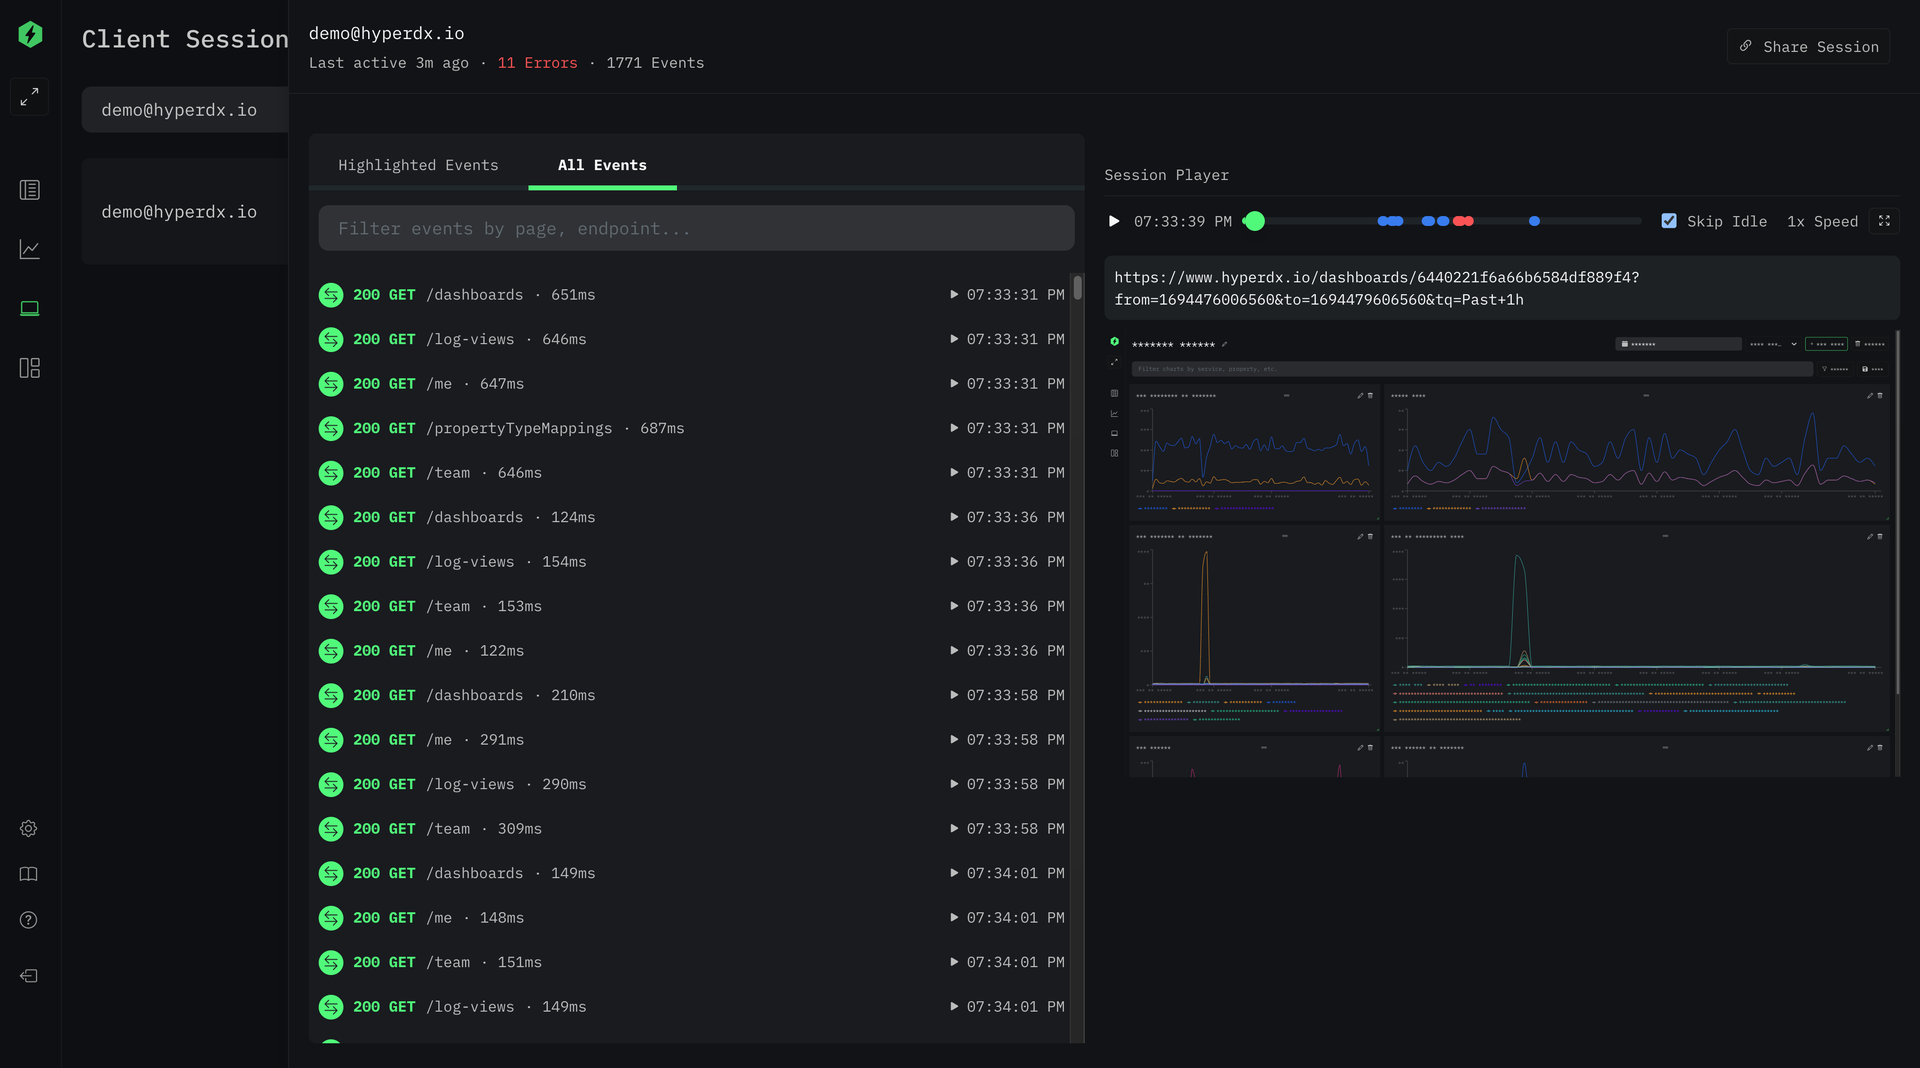
- Records and replays frontend user sessions with click tracking, console errors, and network request correlation to connect user experience with backend telemetry.
- Dashboards and Alerting
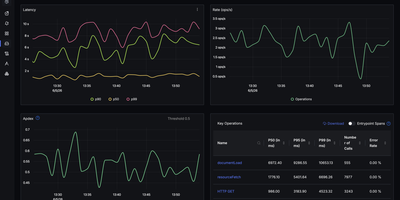
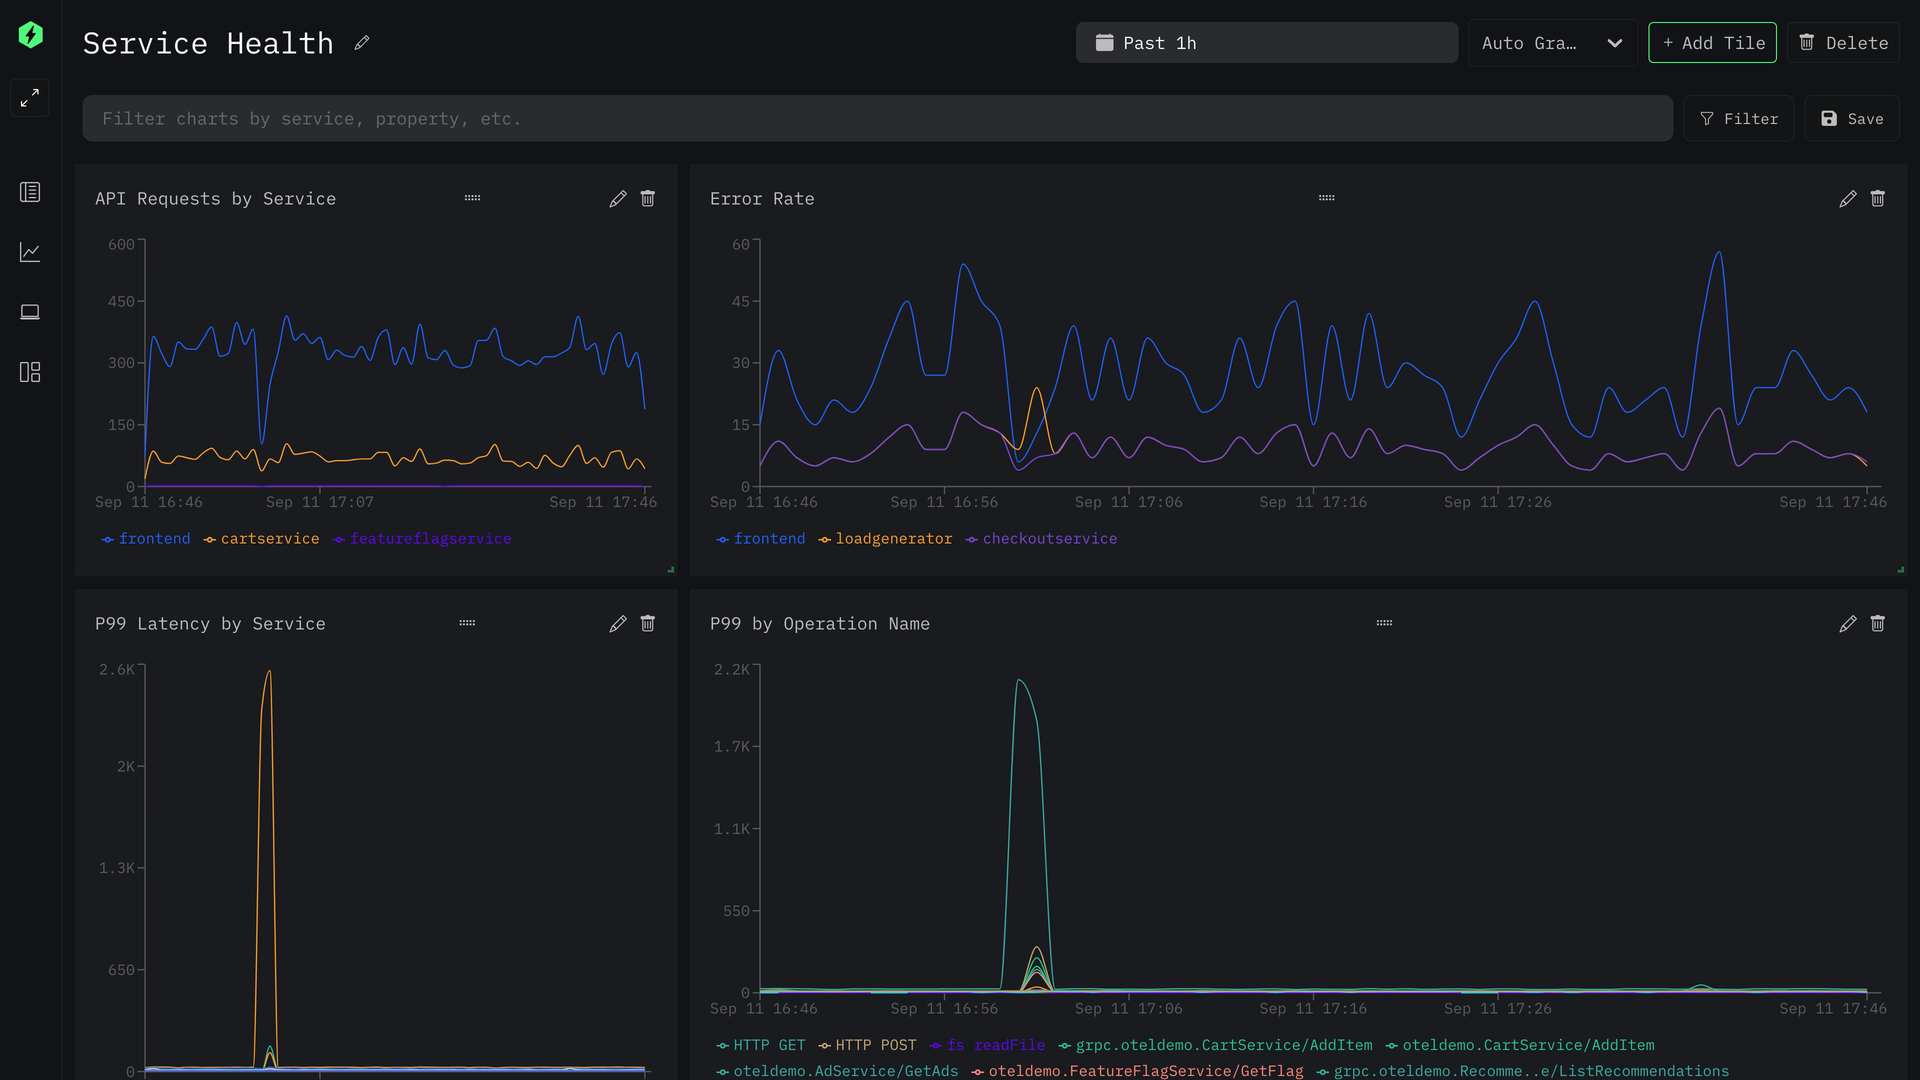
- Build custom dashboards for high-cardinality events without complex query languages, and configure alerts via webhook, Slack, PagerDuty, or email on threshold breaches.
- Programmatic Search API
- REST API endpoint at POST /api/v2/search enables external scripts, CI pipelines, and backend services to query raw log and trace rows with the same optimizations as the UI.