Stars
Forks
Watchers
Developer links
Checkmate
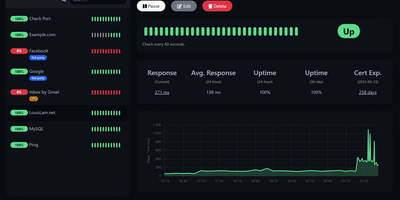
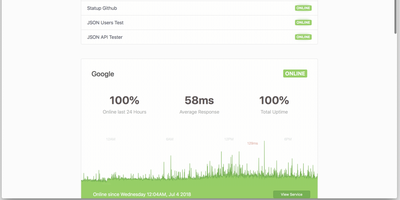
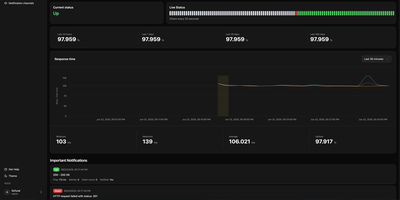
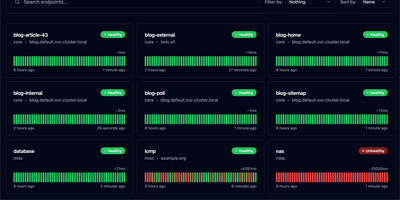
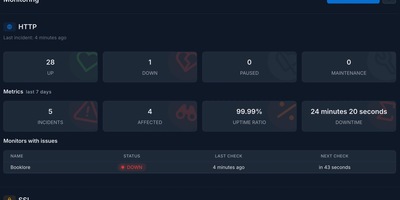
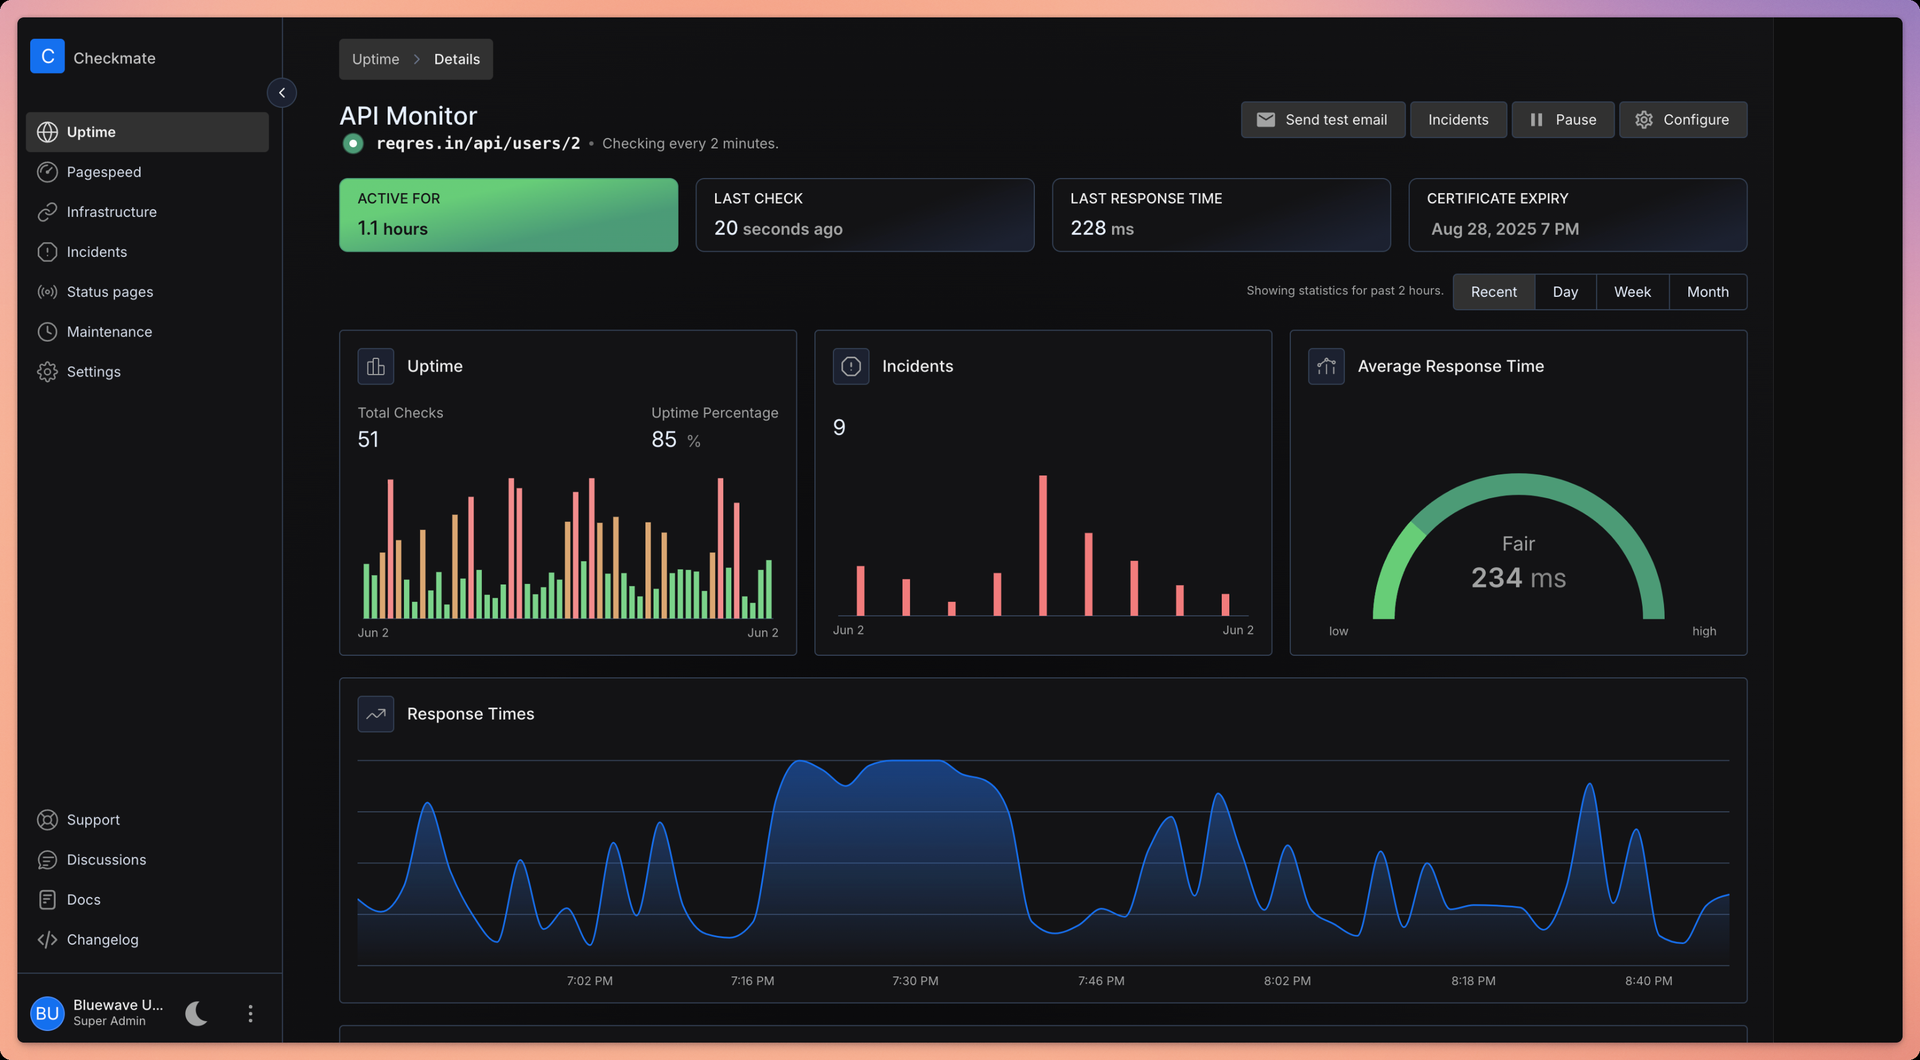
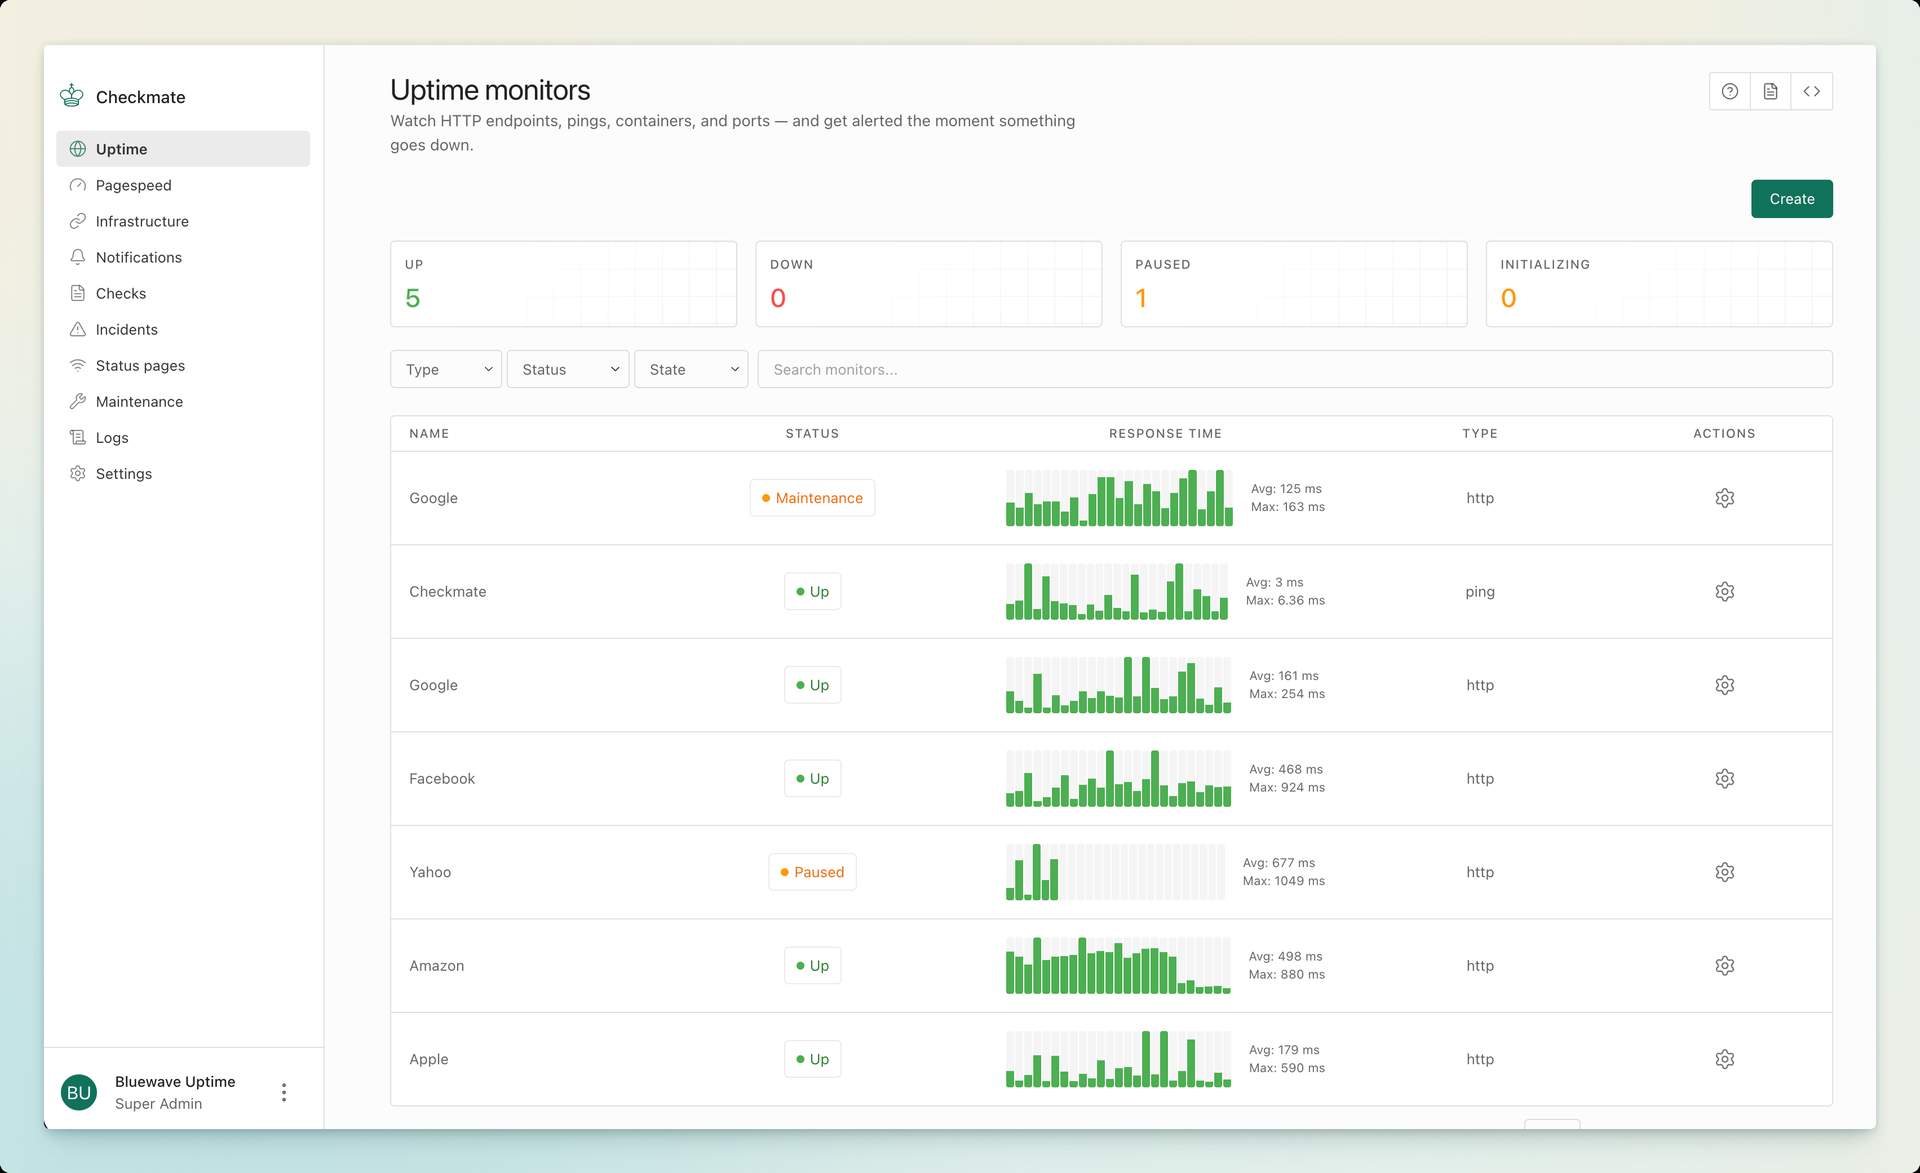
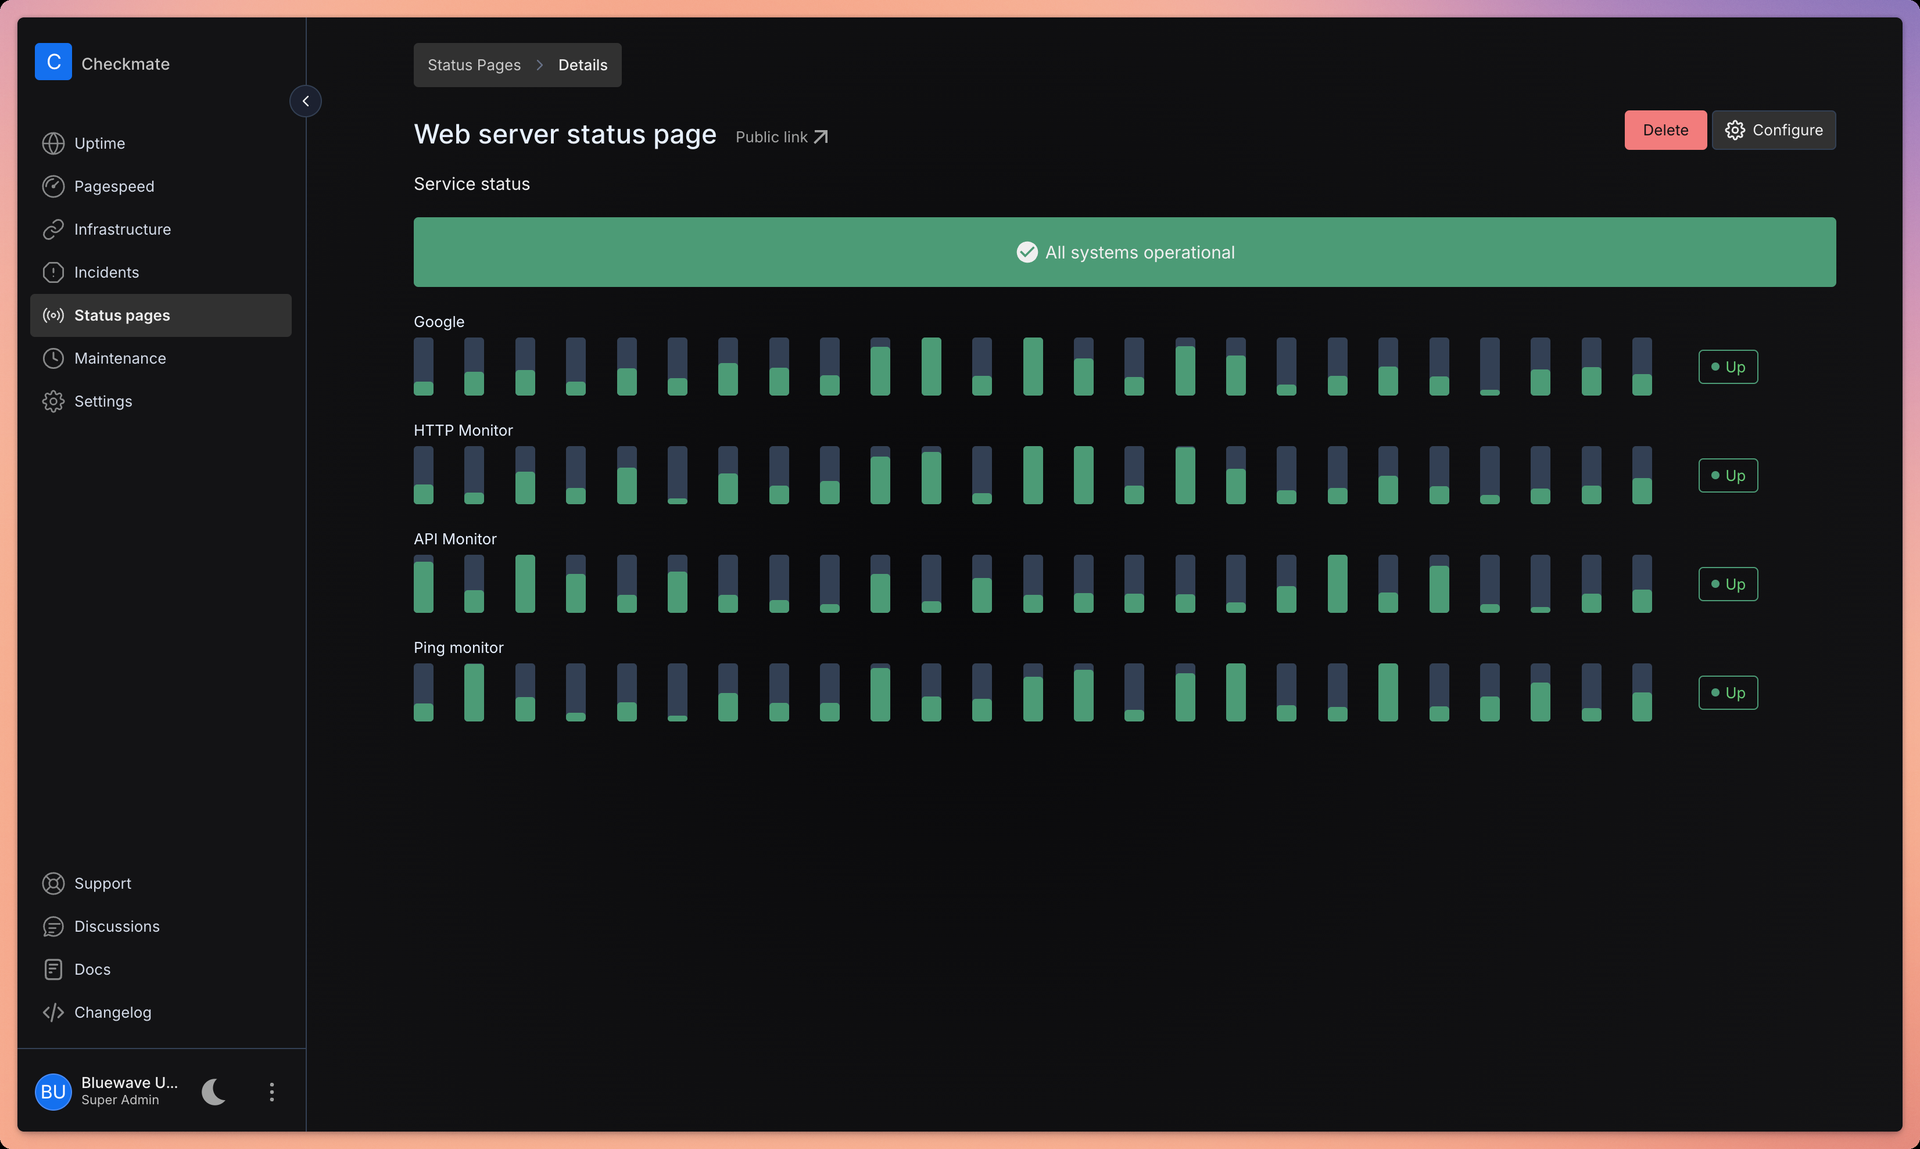
With 10,400 GitHub stars, 153 contributors, and no per-monitor pricing to worry about, Checkmate delivers comprehensive infrastructure monitoring from a single self-hosted dashboard — tracking uptime, page speed, server hardware, Docker containers, and even game servers without sending a byte of telemetry off your network. Ten monitor types cover HTTP, ping, TCP, gRPC, WebSocket, DNS, SSL certificate expiry, Docker container health, Lighthouse page speed with Core Web Vitals tracking, and game server status for over 100 server types including Minecraft and CS2. The Globalping integration enables geo-distributed monitoring from six continents, running ping and HTTP checks from Africa, Asia, Europe, North America, South America, and Oceania with results plotted on an interactive map. The optional Capture agent written in Go collects CPU, RAM, disk usage, temperature, and network metrics from any Linux, Windows, Mac, or Raspberry Pi host. Public status pages ship with four built-in themes and custom branding support, showing per-service uptime bars and incident history on a single shareable URL. Alert notifications reach teams through email, Discord, Slack, PagerDuty, Microsoft Teams, Telegram, Matrix, ntfy, Twilio SMS, and webhooks. Deploy via a single Docker Compose file requiring roughly 1 GB RAM — up and running in under five minutes on any Docker host. Running on a dedicated VPS on RepoCloud with guaranteed CPU, RAM, and SSD, full root SSH access, and a browser serial console. AGPLv3 licensed.
Benefits
- Zero Per-Monitor Pricing Limits
- Monitor unlimited endpoints without artificial caps or usage-based billing, replacing services like UptimeRobot, Pingdom, and BetterUptime that charge per monitor or per check interval.
- Ten Monitor Types Unified
- HTTP, ping, TCP, gRPC, WebSocket, DNS, SSL, Docker, page speed, and game server monitoring consolidated in a single dashboard with unified alerting and incident management.
- Geo-Distributed Network Checks
- Globalping integration runs checks from six continents with results visualized on an interactive world map, detecting regional outages that single-location monitoring misses entirely.
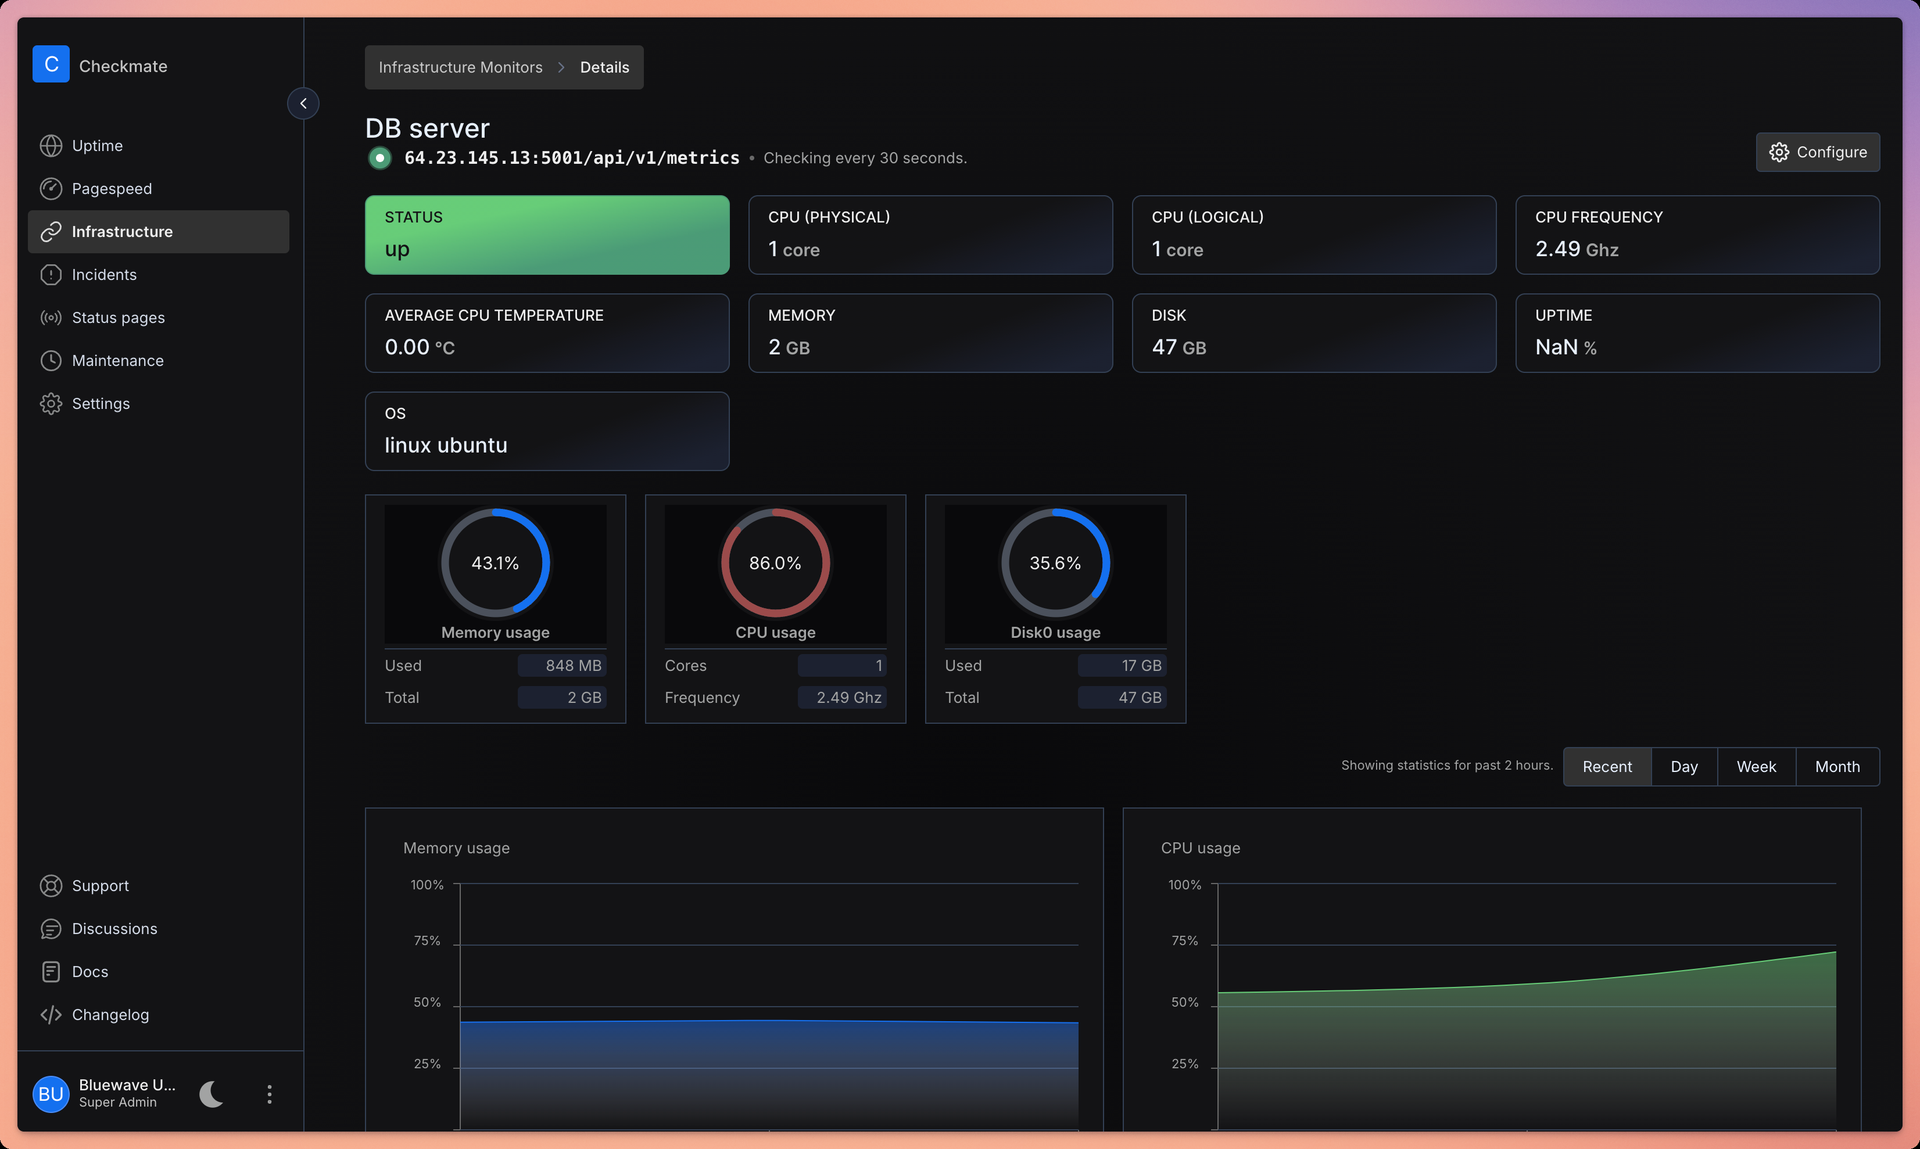
- Hardware Metrics via Agent
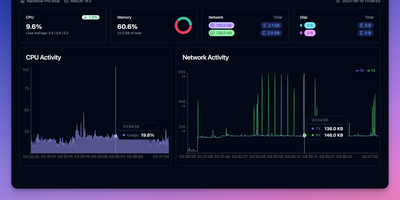
- The lightweight Capture agent written in Go monitors CPU, RAM, disk, temperature, and network on Linux, Windows, Mac, and Raspberry Pi without requiring SNMP or complex configuration.
Features
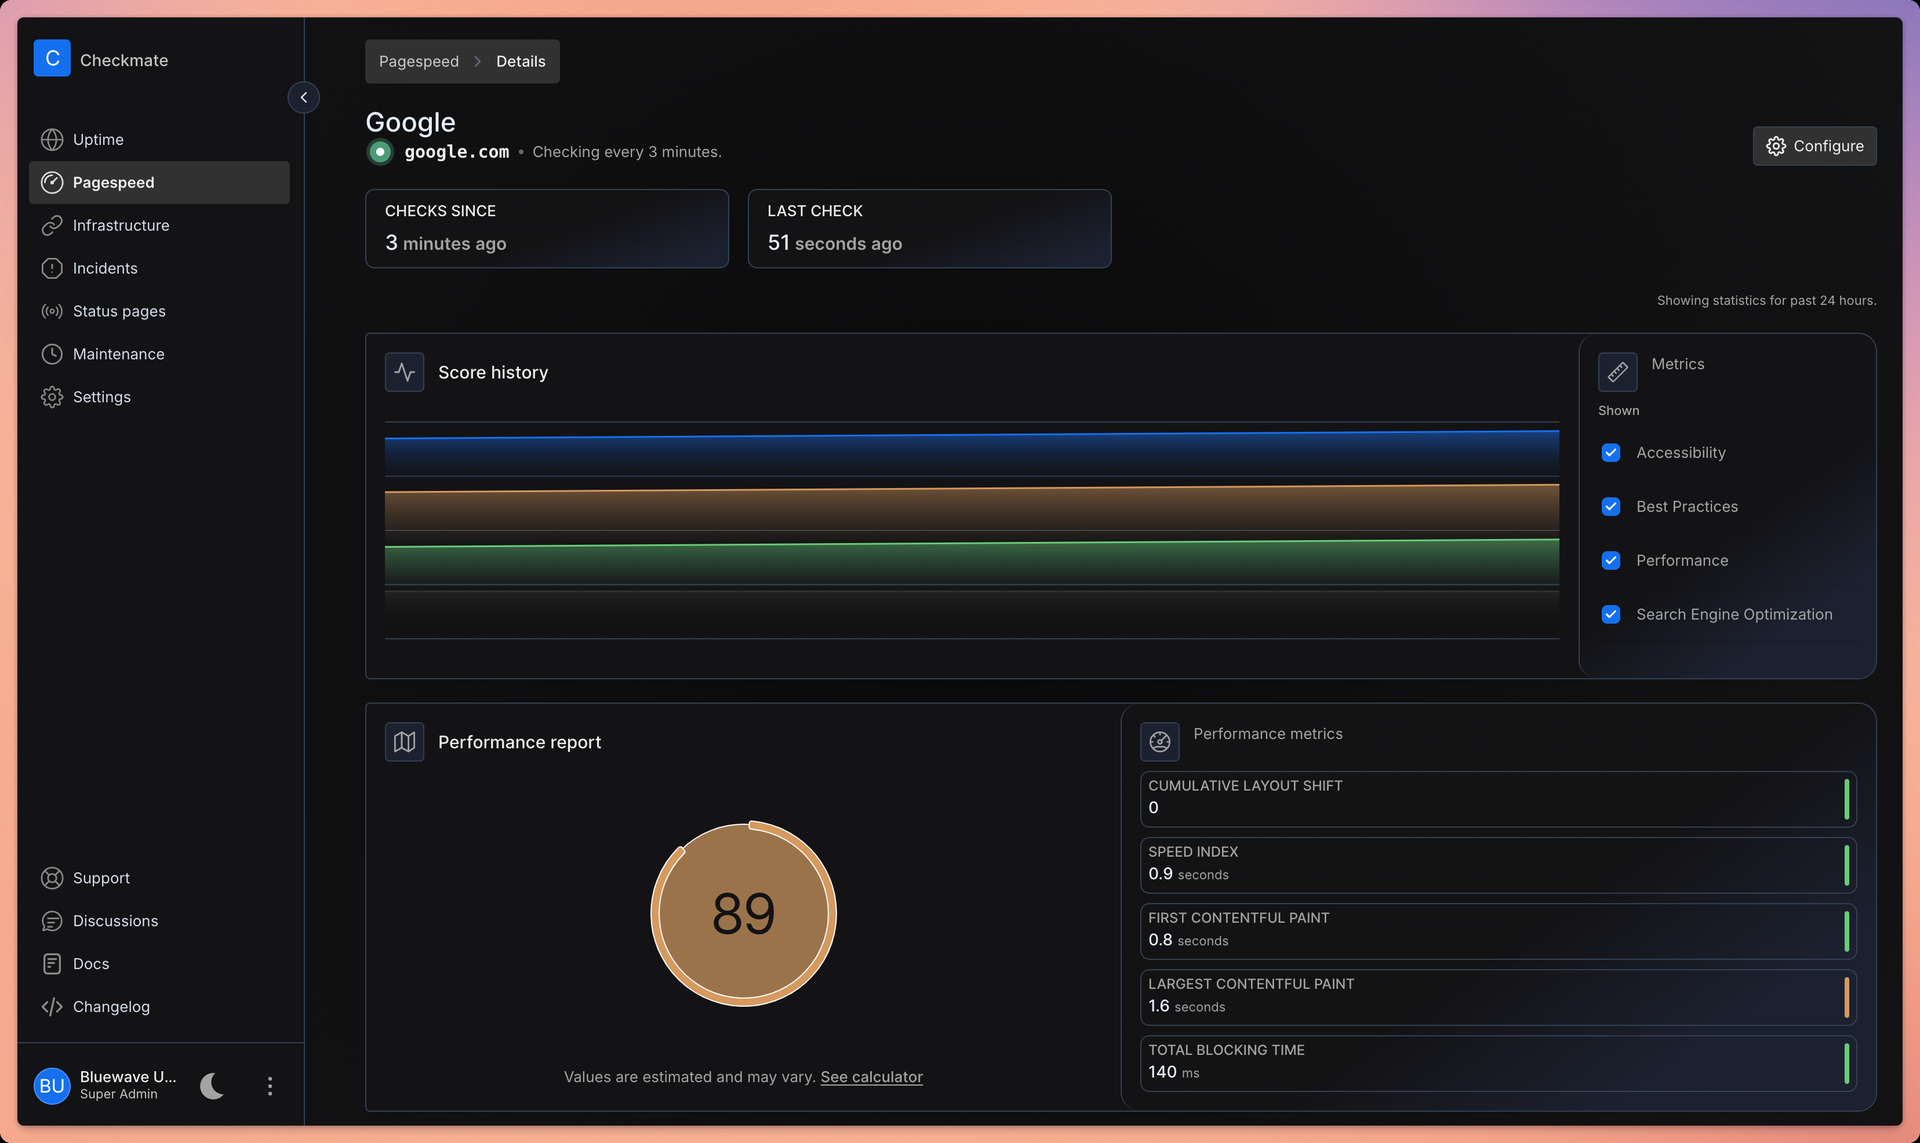
- Lighthouse Page Speed
- Automated Lighthouse runs track Performance, Accessibility, SEO, and Best Practices scores alongside Core Web Vitals including LCP, FCP, and CLS over time.
- Public Status Pages
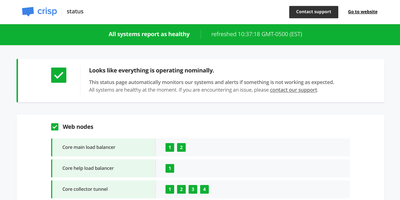
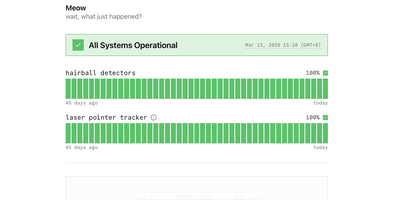
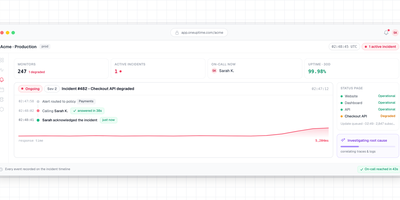
- Customizable branded status pages with four built-in themes display per-service uptime bars, incident history, and scheduled maintenance announcements on a shareable URL.
- Multi-Channel Alerting
- Notifications through email, Discord, Slack, PagerDuty, Microsoft Teams, Telegram, Matrix, ntfy, Twilio SMS, and webhooks with configurable thresholds and escalation.
- Docker Container Monitoring
- Tracks container health status, resource usage, and restart events for all containers on connected Docker hosts without requiring Kubernetes or complex orchestration.
- Game Server Tracking
- Monitors over 100 game server types including Minecraft, CS2, Valheim, and ARK with player counts, server metadata, and availability checks.