Kula
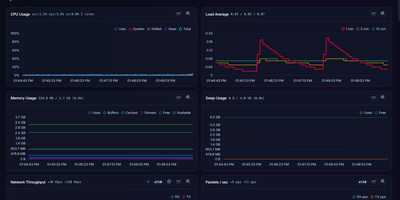
Kula watches a Linux server every second and turns CPU, memory, disks, network, containers, and applications into a live dashboard you can open before trouble becomes downtime. Follow total and per-core CPU, load averages, memory and swap pressure, disk I/O, filesystem space, temperatures, GPU load, and network throughput as charts update live in the browser. Drag to zoom into history, switch to focus or TV mode for a wall display, and check the System Info page when you need the hardware story behind a spike. Watch Docker, Podman, and cgroup containers beside host metrics, then add PostgreSQL, MySQL or MariaDB, nginx, and Apache monitoring or define custom metrics for the odd service only your team understands. Scrape the Prometheus endpoint into an existing observability stack, open the terminal UI over SSH for a quick live read, or ask the optional local Ollama assistant to discuss charts without sending data to a cloud service. Protect the dashboard with optional Argon2id logins and multiple users, schedule storage snapshots, and keep the whole tool working on closed networks with no external calls. Running on a dedicated VPS on RepoCloud with guaranteed CPU, RAM, and SSD, full root SSH access, and a browser serial console. AGPL-3.0 licensed.
CoreObs
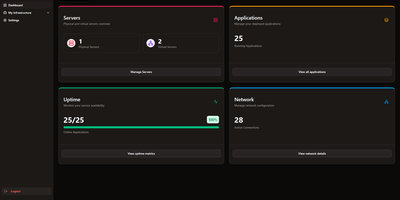
CoreObs delivers a unified self-hosted dashboard that replaces the typical combination of Uptime Kuma, Homer, and separate monitoring tools with a single interface for managing your entire server infrastructure. The Next.js frontend with shadcn components provides a modern dark-themed UI displaying server hardware metrics collected by a lightweight Go agent that leverages Glances for hardware abstraction — streaming real-time per-core CPU load, RAM utilization, NVIDIA GPU statistics, disk usage, system uptime, and load averages via WebSocket connections. The application registry tracks all self-hosted services with configurable uptime monitoring, availability history charts, and instant notifications through Discord, Telegram, Pushover, and email when services go down or recover. Quick-access links provide one-click navigation to each application's management panel directly from the dashboard. The network visualization module built on React Flow enables creating visual topology maps of your infrastructure with drag-and-drop nodes representing servers, switches, and services connected by labeled edges. Server data can be organized with tags, copied between entries, and monitored with configurable pagination and compact view modes. Deploy via Docker Compose with three containers — the Next.js web interface, the Go monitoring agent, and PostgreSQL 17 for persistent storage. Running on a dedicated VPS on RepoCloud with guaranteed CPU, RAM, and SSD, full root SSH access, and a browser serial console. MIT licensed.
Domain Locker
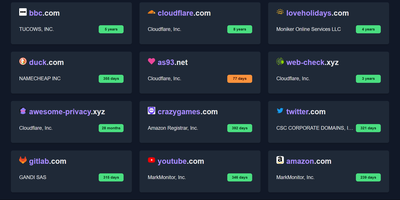
Domain Locker provides an all-in-one domain portfolio dashboard that consolidates expiration tracking, DNS records, and infrastructure health across every registrar you use. Add your domains to automatically harvest registration dates, name servers, SSL validity windows, IP allocations, and subdomains without manual data entry. Customizable notification rules broadcast renewal warnings and configuration change alerts through webhooks, email, Telegram, Slack, or WhatsApp before services experience unintended downtime. Interactive timeline views map renewal deadlines and calculate historical acquisition costs against annual operating expenses to clarify portfolio valuations. Built-in monitoring tools ping endpoints to record response latencies, HTTP status codes, and server availability metrics for every registered address. Audit logs preserve historical snapshots of DNS modifications, WHOIS adjustments, and registrar migrations to simplify infrastructure troubleshooting across teams. Integrated tags and resource associations organize personal blogs, client projects, and staging environments into isolated workspaces with role-based permissions and two-factor authentication. Running on a dedicated VPS on RepoCloud with guaranteed CPU, RAM, and SSD, full root SSH access, and a browser serial console. MIT licensed.
Bytedesk
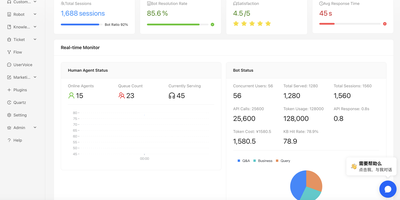
Support teams handling website live chat, email queues, and social messaging channels gain a unified, AI-assisted helpdesk in Bytedesk. Incoming conversations from web widgets, mobile SDKs, WhatsApp, WeChat, and email flow into a single agent workbench equipped with skill-group routing, VIP priority rules, and automatic human handoff. Customer-facing AI agents connect to Ollama, DeepSeek, OpenAI, Qwen, and Zhipu models to answer recurring inquiries using retrieval-augmented generation (RAG) over internal knowledge bases and FAQ libraries, complete with function calling and Model Context Protocol (MCP) tool execution. Complex escalations convert into SLA-tracked tickets with custom approval workflows, or transition directly into browser-based WebRTC video calls, screen sharing sessions, and FreeSwitch voice call center queues. Supervisors track real-time queue depth, bot resolution rates, token usage, automated AI quality scores, and customer satisfaction surveys from the analytics dashboard. Native client SDKs for Web, iOS, Android, Flutter, UniApp, WordPress, and WooCommerce make embedding customizable chat widgets straightforward across any storefront. Running on a dedicated VPS on RepoCloud with guaranteed CPU, RAM, and SSD, full root SSH access, and a browser serial console. AGPL-3.0 licensed.
ServerKit
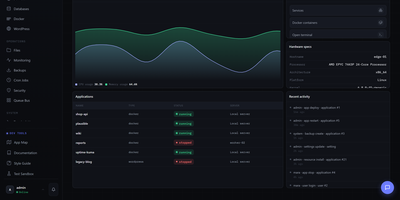
ServerKit delivers a server control panel that fits on a small VPS while managing everything from Docker containers to mail servers. The Python/Flask backend exposes 1,519 REST endpoints across 107 blueprints with full OpenAPI documentation at /api/v1/docs, while the React frontend spans 65 screens in a 1.75MB gzipped bundle served entirely from your own infrastructure. Docker management includes full container lifecycle control, Docker Compose project orchestration, real-time log streaming, and terminal access. Database panels cover MySQL/MariaDB and PostgreSQL with user management, browser-based query consoles, and automated backups to S3, Backblaze B2, or local storage. Nginx virtual host management automates Let's Encrypt certificate provisioning with hardened TLS 1.2+ configurations and Cloudflare-aware setups. The Go-based cross-platform agent enables multi-server fleet management with HMAC-SHA256 authentication over a WebSocket gateway, supporting Linux, Windows, and macOS across amd64 and ARM64 architectures. Fleet monitoring provides cross-server heatmaps, metric comparison charts, alert thresholds, anomaly detection, and capacity forecasting. A built-in marketplace distributes 106 one-click application templates using a declarative YAML schema with Docker Compose stacks. The extension system allows community plugins for Kubernetes management, Redis browsers, and WordPress site orchestration. Running on a dedicated VPS on RepoCloud with guaranteed CPU, RAM, and SSD, full root SSH access, and a browser serial console. MIT licensed.
Xalgorix
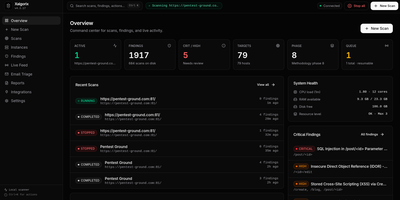
Xalgorix delivers AI-driven penetration testing that proves vulnerabilities exist rather than guessing, pairing an autonomous LLM agent with an independent exploit verifier that re-exploits every finding before it reaches your report. The 22-phase methodology mirrors how a skilled human pentester works through an engagement, covering reconnaissance, subdomain enumeration, port scanning, web crawling, parameter fuzzing, SQL injection testing, XSS detection, authentication bypass, API testing, and more. Select all phases or pick specific ones per target. The platform ships with 85+ offensive security tools preinstalled (nmap, nuclei, httpx, subfinder, katana, ffuf, gobuster, sqlmap, masscan, dalfox, feroxbuster) plus 14 built-in agent tools for browser automation, terminal execution, and note-taking. Connect your own LLM provider (OpenAI, Anthropic, DeepSeek, Gemini, Groq, Ollama, or MiniMax) so no scan data or target information leaves your infrastructure. The web dashboard on port 9137 provides live WebSocket telemetry showing tool calls, agent reasoning, and findings as scans progress. A findings index with CVSS scoring and severity filters organizes results, and branded PDF reports include your company name and logo. Wildcard and multi-target scans handle red team attack-surface mapping, while source-code scanning audits repositories directly without requiring a deployed target. A REST API enables scripted scans and SIEM pipeline integration, and webhooks push notifications to Discord or Telegram. Running on a dedicated VPS on RepoCloud with guaranteed CPU, RAM, and SSD, full root SSH access, and a browser serial console. Apache 2.0 licensed.
Synaplan
Instead of a separate chatbot for each channel, Synaplan runs one self-hosted AI assistant for your team, website visitors, WhatsApp line, and inbox, and shows what every reply cost. In the web app, connect OpenAI, Anthropic, Gemini, Groq, Mistral, xAI, Hugging Face, or local Ollama. Each kind of work gets its own model, from chat and image to video and audio, and every answer carries a Free, Low, Mid, or High cost badge. A planner splits a big request into a task graph and sends each step to the model that fits. On your website, one script tag adds a chat widget, and a human operator can take over any conversation live. On WhatsApp Business and email, the assistant replies on the channel where the question arrived. Behind every channel sits one knowledge base: upload PDFs, Word and Excel files, or images with OCR, and semantic search feeds them into answers. Saved tasks run on demand or on a schedule, approvals pause any action that writes, and watched pages mail you a diff when a URL changes. Connections reach Microsoft 365, Dropbox, Nextcloud, ownCloud, WebDAV, CalDAV, Jira, and Confluence. An MCP server and an Anthropic-compatible endpoint let Claude, Cursor, and Claude Code use your instance. Users and groups share folders and assistants, and admins see usage and health. Running on a dedicated VPS on RepoCloud with guaranteed CPU, RAM, and SSD, full root SSH access, and a browser serial console. Apache-2.0 licensed.
Wiki-Go
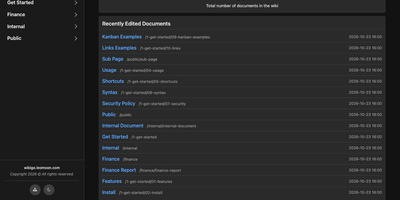
Wiki-Go turns a folder of Markdown files into a searchable team wiki with page history, comments, and access rules, and never asks you to run a database. Pages live in a nested tree with a sidebar and breadcrumbs, and an editor with a preview toggle handles emoji shortcodes, highlighted code, LaTeX math, Mermaid diagrams, collapsible sections, GitHub-style alerts, and embedded YouTube, Vimeo, or MP4 video. Full-text search supports exact phrases in quotes and term inclusion or exclusion, and highlights each match. Each save keeps a revision, up to a configurable limit, and any stored version can be restored later. Attachments such as PDFs, spreadsheets, images, and archives sit beside the page they belong to. Drop a Kanban board into any document for drag-and-drop task tracking with nested tasks, or build a categorized link library that fills in page metadata automatically. Signed-in users comment in Markdown, and admins can remove comments. Admin, editor, and viewer roles, user groups, path-based public or private rules, and an optional private-wiki mode decide who sees what. Branding comes from a custom logo, banner, and favicon, shortcodes such as stats insert live site statistics, and readers can switch between dark and light themes or print any page. A REST API opens content to scripts, and a community tool imports Notion exports. Running on a dedicated VPS on RepoCloud with guaranteed CPU, RAM, and SSD, full root SSH access, and a browser serial console. GPL-3.0 licensed.
Atomic
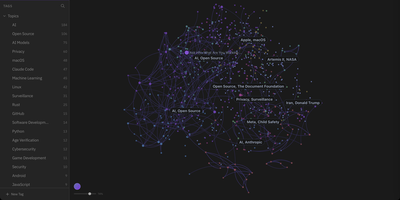
Atomic transforms collections of personal Markdown notes into an AI-augmented knowledge graph by breaking documents down into semantically linked conceptual units. Users capture thoughts, research excerpts, and web clippings as modular notes that the system automatically chunks, embeds, and categorizes with hierarchical tags. An interactive force-directed canvas maps out the entire knowledge base, positioning related ideas closer together based on embedding cosine similarity rather than manual folder hierarchies. Built-in vector search queries across text embeddings directly within SQLite, retrieving precise contextual snippets in response to natural language prompts. The automated wiki engine synthesizes disparate notes into comprehensive reference articles equipped with verifiable inline citations back to original source materials. Integrated conversational agents leverage retrieved knowledge context to answer research questions, surface contradictions across past entries, and draft structured daily briefings. External AI tools can read, search, and update stored knowledge through an embedded Model Context Protocol server endpoint. Running on a dedicated VPS on RepoCloud with guaranteed CPU, RAM, and SSD, full root SSH access, and a browser serial console. MIT licensed.

Fugleramme
Garden birdsong as a framed collage: Fugleramme draws the species heard right now as hand-cut illustrations from 1800s natural-history plates, for an e-ink panel, a TV, or any browser. The birds come from BirdNET-Go, which can listen on the same machine or elsewhere on the network, so the microphone can stay near the birds while the frame hangs in the living room. Nearly 1200 cut-outs cover over 650 species, none of them AI-generated, and each bird is sized by its real body mass, larger ones toward the centre. The page redraws only when the birds change. Heard nothing in the lookback window? A bare perch appears. Collage mode shows everything heard within a window from 15 minutes to all time, latest-bird mode changes only when a different species calls, and newest-arrival mode holds until a new species turns up. An optional spotlight puts the latest bird in the middle. Spiral or voids layouts rearrange the sheet, and a species limit keeps the most heard or the rarest. Names sit beside the birds or in a poster-style numbered key, in two languages at once from over 40, and a star flags a bird the station has never heard before for its first 24 hours. A web admin page covers display, detector address, and optional password sign-in. Running on a dedicated VPS on RepoCloud with guaranteed CPU, RAM, and SSD, full root SSH access, and a browser serial console. MIT licensed.
ZenNotes
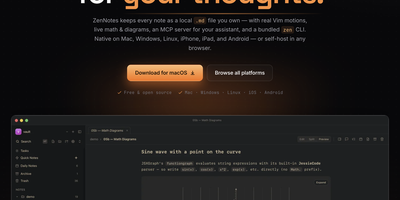
With over 2,200 GitHub stars and a philosophy that your notes should be files you own rather than rows in a database, ZenNotes is the keyboard-first Markdown editor that runs as a self-hosted web app backed by a Go server accessible from any browser on your network. Every note is a plain .md file in a vault directory you mount, with zero proprietary lock-in. Modal editing with real Vim motions, leader-key flows, and a command palette keeps your hands on the keyboard through edit, split, and preview modes. The rendering engine handles KaTeX math, Mermaid diagrams, TikZ graphics, and JSXGraph plots directly from Markdown syntax alongside wiki links and callout blocks. A first-party MCP server ships in the box with one-click integration for Claude Desktop and Cursor, letting AI assistants read and write the same Markdown files on disk without sync layers or duplicate copies. The bundled zen CLI provides note creation, search, tagging, task toggling, and piped capture with JSON output for shell scripting. Board views render plain CSV files as Kanban columns. Daily notes, quick capture, archive, and trash round out the vault workflow. The Go backend serves the browser frontend on port 7878 with token-based authentication, configurable browse roots, TLS proxy support, and file permission hardening at 0600/0700 defaults. Deploy via the multi-arch Docker image for linux/amd64 and linux/arm64. Running on a dedicated VPS on RepoCloud with guaranteed CPU, RAM, and SSD, full root SSH access, and a browser serial console. MIT licensed.
OpenMES
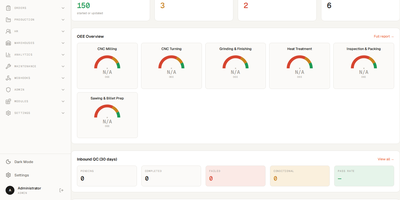
Admins, supervisors, and operators each get their own screens in OpenMES, a free self-hosted manufacturing execution system for small factories. Drag work orders across weekly, daily, hourly, and monthly planner views, and any order that stock cannot cover gets flagged. Automatic scheduling drafts a feasible plan from shift calendars, maintenance, and material shortages, and nothing changes until a supervisor applies it, with undo. Work orders carry partial batches, reusable process templates, and priority scores built from customer tier, planned quantity, and hours until due, and CSV or Excel imports bulk-load orders, materials, and recipes. Operators work from touch-optimized tablet queues, where one tap starts, completes, or reports an issue, even offline, and a critical issue halts production automatically. When a machine stops, MQTT, Modbus TCP, or OPC UA signals record the downtime automatically, and the same signals drive good and reject counters and OEE. At goods-in, an inbound inspection records pass or fail criteria and a disposition such as accept, rework, scrap, or quarantine. Material lots track received and available quantities with hold and release status, and the production cost report splits each finished order into material, labor, and additional costs, with CSV export. Supervisors follow the shift on a live monitor. Webhooks, a REST API, and hook-based modules connect OpenMES to ERP systems and custom code. Running on a dedicated VPS on RepoCloud with guaranteed CPU, RAM, and SSD, full root SSH access, and a browser serial console. AGPL-3.0 licensed.
Azimutt
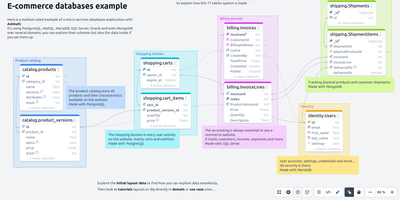
Inheriting a sprawling database with hundreds of undocumented tables usually means weeks of guesswork, unless you open it in Azimutt to visually map schemas, trace relationships, and inspect live rows in one workspace. Instead of dumping every table onto a cluttered canvas that crashes your browser, the visual explorer starts clean so you can search across entity names, column types, and SQL comments to reveal only the tables relevant to your investigation. Clicking foreign-key or primary-key indicators expands incoming and outgoing relations step by step, while the graph path-finder automatically calculates the shortest join route between any two distant entities. When debugging production issues or answering support tickets, you can query live records across PostgreSQL, MySQL, MariaDB, SQL Server, Oracle, SQLite, MongoDB, Couchbase, Snowflake, and BigQuery, then click directly through foreign keys in the result rows to follow data lineage visually. Architects and developers also design new schemas at typing speed using Azimutt Markup Language (AML), attach contextual markdown notes, tags, and memos to saved layouts for team onboarding, and run automated schema analysis that flags missing primary keys, implicit foreign keys, inconsistent column types, and oversized tables. Running on a dedicated VPS on RepoCloud with guaranteed CPU, RAM, and SSD, full root SSH access, and a browser serial console. MIT licensed.
PotatoMesh
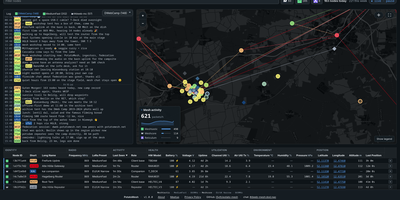
When your community asks what its LoRa mesh is doing right now, PotatoMesh answers with a live map, chat log, and node table built from the traffic your own radios hear. It is a self-hosted dashboard for Meshtastic, Meshcore, and Reticulum networks, with no MQTT clutter. Each node gets a detail page charting battery, voltage, channel utilization, temperature, humidity, and air quality over the past week, plus the neighbors it hears with signal strength and the trace routes it appears in. New nodes and telemetry reports pop up in the chat as they arrive, and a charts page follows telemetry and packets per hour across the whole network. Federation finds other PotatoMesh communities automatically and plots them on a world map with active-node counts per protocol. Ingestors feed the dashboard from radios over serial, TCP, Bluetooth, or passive UDP, and several can report to one instance. Open browsers update live, a Prometheus endpoint exports metrics, and Markdown pages publish your rules, contact details, or legal notice. Add a stop-sign emoji to a node's name to hide it, or switch on private mode to drop the chat entirely. Running on a dedicated VPS on RepoCloud with guaranteed CPU, RAM, and SSD, full root SSH access, and a browser serial console. Apache-2.0 licensed.
Tapflow
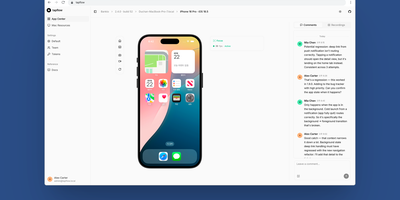
Tapflow puts your team's iOS simulators and Android emulators in every teammate's browser, so QA stops queueing for the one Mac that happens to have the right build installed. A relay server you host serves the dashboard and API, stores your builds and recordings, and keeps accounts and device control on infrastructure you own. Agents on your Macs connect out to the relay and drive the simulators already installed there, injecting touches directly without WebDriverAgent or any cloud device pool. From the browser you tap, swipe, and pinch at about 30 frames per second, open deeplinks from the QA toolbar, sync the clipboard both ways, hear device audio, and cut the network to see how the app copes offline. The App Center takes .app.zip and .apk uploads and tracks each build from backlog to done, and sessions can be recorded and shared before the relay purges them after about 72 hours. CI pipelines and AI agents get a screenshot endpoint and scoped access tokens, deterministic YAML flows replay checks with a JUnit report, and roles keep viewers, QA, developers, and admins in their lanes. Running on a dedicated VPS on RepoCloud with guaranteed CPU, RAM, and SSD, full root SSH access, and a browser serial console. MIT licensed.
Circuit Breaker
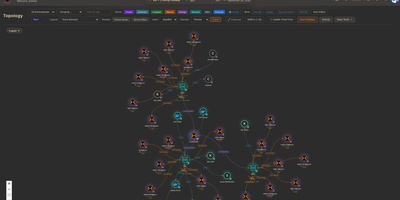
Mapping every physical server, virtual machine, container, and network link across a sprawling homelab into a live interactive canvas, Circuit Breaker gives infrastructure operators real-time topology visualization, IP address management, and rack elevation modeling on a single screen. Operators can switch between hierarchical, concentric, cortex ring, radial, and force-directed graph layouts where animated edges reflect link speeds and color-coded status rings display live hardware health. Automated discovery scans local subnets using nmap, SNMP, and ARP while querying Proxmox VE clusters, TrueNAS storage pools, and UniFi controllers, staging newly detected nodes in a review queue before adding them to the map. For multi-site labs or isolated VLANs, lightweight remote agents connect outbound over Noise-encrypted links after fingerprint approval to report host telemetry and run scoped network scans without opening inbound firewall ports. Rack diagrams let administrators drag servers into U slots with cabling overlays using a built-in catalog covering Dell, HPE, Supermicro, Ubiquiti, MikroTik, Synology, and APC gear alongside live iDRAC, iLO, and UPS metrics. Role-based access control, OIDC single sign-on, TOTP multi-factor authentication, encrypted full-state snapshots, and a SHA-256 hash-chained audit log keep multi-user operations accountable. Running on a dedicated VPS on RepoCloud with guaranteed CPU, RAM, and SSD, full root SSH access, and a browser serial console. MIT licensed.
DCM
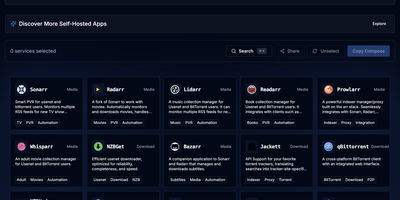
DCM is a visual builder that eliminates docker-compose copy-paste anxiety for home server enthusiasts. The TypeScript and Next.js web interface on port 7576 presents a curated catalog of popular self-hosted applications organized into categories: media management with Jellyfin, Plex, Sonarr, Radarr, and Prowlarr; dashboards like Homarr and Heimdall; databases including PostgreSQL, MariaDB, MongoDB, and Redis; monitoring stacks with Grafana and Prometheus; download clients like qBittorrent and NZBGet; security tools including Vaultwarden; storage solutions like Nextcloud; and home automation via Home Assistant. Select any combination of containers and DCM generates both compose.yaml and .env files with correct volume mounts, environment variables, PUID/PGID ownership, network modes, and port mappings — ready to paste into your terminal. Automatic port conflict detection identifies clashing services and reassigns ports before you ever hit a deployment error. The Template Gallery ships predefined multi-container stacks for common setups: media servers, development environments, database clusters, and monitoring solutions — some incorporating ten or more services in a single template. Built as a static Next.js export served from a 62 MB multi-arch Docker image supporting amd64, arm64, and arm/v7, DCM runs on everything from rack servers to Raspberry Pis. Share generated configurations via URL or download them locally. Running on a dedicated VPS on RepoCloud with guaranteed CPU, RAM, and SSD, full root SSH access, and a browser serial console. AGPL-3.0 licensed.
Budget Board
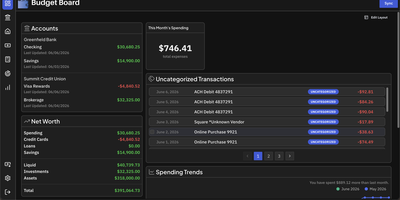
Budget Board is an open-source personal finance dashboard built to replace Mint by unifying checking accounts, credit cards, property assets, monthly category budgets, and long-term savings goals under your own roof. Households can connect their financial institutions through SimpleFIN for North American banks or LunchFlow for international accounts so balances and daily transactions sync automatically on a configurable schedule. If you prefer offline statement management, the bulk CSV importer parses custom date and amount formats while mapping rows directly to your accounts. Once transactions arrive, you can train the built-in machine learning auto-categorizer on your historical spending with a customizable confidence threshold, or define deterministic rules that match merchant descriptions, dates, and amounts. Monthly budget cards track hierarchical parent and child categories against spending limits, and the goals workspace calculates progress toward paying down debt or building an emergency fund. Interactive trends charts let you filter cash flow, net worth, and category breakdowns across custom date ranges and accounts. Multi-user households can secure their financial records with local two-factor authentication or external OpenID Connect single sign-on, alongside localized date and currency formatting in English, German, French, and Simplified Chinese. Running on a dedicated VPS on RepoCloud with guaranteed CPU, RAM, and SSD, full root SSH access, and a browser serial console. AGPL-3.0 licensed.