GoCron
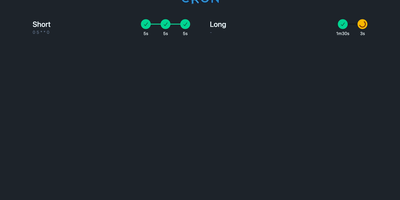
Configuring recurring cron jobs via version-controlled YAML manifests becomes seamless with GoCron, giving systems engineers and DevOps administrators a responsive web console to orchestrate scheduled commands with hot-reloading and sandboxed execution. Administrators can declare schedules using standard five-field cron syntax, establish global default configurations, and inherit execution timeouts, retry policies, and environment variable expansions across individual tasks. The interactive web interface provides immediate visibility into upcoming runs, past execution durations, status badges, and expandable terminal output logs stored in local SQLite databases. Operators can trigger ad-hoc job runs on demand, cancel stalled processes, and utilize a built-in sandboxed terminal utility governed by strict command whitelists. Automated health check webhooks dispatch HTTP notifications to external monitoring services upon job initiation, successful completion, or unexpected execution failure. The container environment bundles common server utilities including Restic, BorgBackup, and Rclone, streamlining automated offsite database backups and cloud storage synchronization routines without additional dependencies. Dynamic configuration reloading automatically detects filesystem modifications to YAML manifests without restarting the daemon, ensuring zero-downtime schedule updates. Running on a dedicated VPS on RepoCloud with guaranteed CPU, RAM, and SSD, full root SSH access, and a browser serial console. MIT licensed.
UptimeKuma
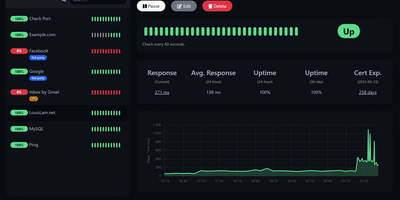
Sixty-thousand-plus GitHub stars make Uptime Kuma the most popular self-hosted monitoring tool - MIT-licensed, Node.js, and the standard replacement for UptimeRobot, Pingdom, and Freshping. It watches a dozen monitor types: HTTP(S) endpoints with keyword and JSON-query content validation, TCP ports, ICMP ping, DNS records, WebSockets, Docker containers via the socket, Steam game servers, MQTT brokers, gRPC services, and push-based heartbeats for cron jobs and internal workers. Checks run at intervals as tight as 20 seconds - versus UptimeRobot's 5-minute free tier - with unlimited monitors and unlimited data retention. When something fails, alerts fan out through 90+ notification channels: Slack, Discord, Telegram, email with LiquidJS templating, PagerDuty, OpsGenie, ntfy, Gotify, Matrix, and dozens more via native providers plus the Apprise library. Unlimited public or password-protected status pages - mappable to specific domains and organized into monitor groups - communicate health to customers, with maintenance windows that suppress alerts during planned work. The reactive dashboard graphs response times, tracks SSL certificate expiry with advance warnings, supports proxies and 2FA, and ships in dozens of languages. One Docker container with a SQLite volume covers an entire infrastructure.
Komari
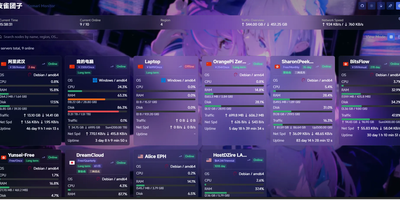
Komari turns a scattered fleet of VPS boxes into one clean status wall that shows which servers are alive, struggling, or about to expire. Every node reports CPU, GPU, memory, swap, disk, load, network speed, traffic totals, and uptime to a real-time dashboard, with history views from ten minutes to thirty days or any custom range. Flip between a card grid and a table, search by name, region, or operating system, and tag each machine with its price, billing cycle, and days until renewal. Latency tasks send ICMP, TCP, or HTTP probes and plot the results in per-node charts. Offline alerts wait out a per-node grace period before firing, expiry reminders warn before a plan lapses, and Webhook and custom JavaScript channels deliver them. A multi-tab browser terminal that reattaches after disconnects, remote command execution, and a remote file manager with an editor let you fix problems without leaving the panel. Agents install with a script, a binary, Docker, or an auto-discovery key for batch rollouts, and administrators can switch an agent's version remotely. Plugins run on an embedded JavaScript runtime and can add scheduled jobs, HTTP hooks, static pages, and notification channels. Administrators can add two-factor authentication, OAuth sign-in, API keys for a JSON-RPC 2.0 endpoint, themes from a theme market, and backups. Running on a dedicated VPS on RepoCloud with guaranteed CPU, RAM, and SSD, full root SSH access, and a browser serial console. MIT licensed.
VictoriaLogs
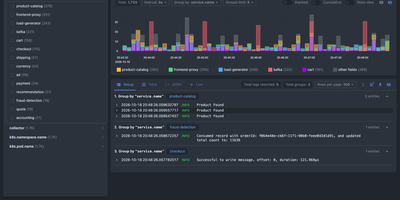
Instead of running an Elasticsearch or Loki cluster, VictoriaLogs stores and searches your logs from a single zero-config server. Ship from Filebeat, Fluent Bit, Fluentd, Logstash, Vector, Promtail, Telegraf, the OpenTelemetry Collector, or the Datadog Agent. Syslog, journald, and Splunk endpoints work too. Query with LogsQL: word, phrase, and prefix filters combine with pipes that extract fields from raw lines and compute stats, top values, and facets. See results as a table, grouped by stream, as raw JSON, or as a live tail. Chart them in Grafana, or work from a terminal with vlogscli and pipe output into grep, less, or jq. Events with hundreds of fields are supported. So are high-cardinality fields like trace_id and user_id. Late, out-of-order backfills are accepted. During an incident, stream_context pulls the lines around any match. Tenants are keyed by AccountID and ProjectID headers. vmalert evaluates LogsQL queries as alerting and recording rules. CEF messages sent over Syslog are parsed automatically for SIEM work. Retention defaults to 7 days and can be capped by disk space. Per-day partitions snapshot and copy out with rsync or rclone. Cluster mode splits ingestion, querying, and storage across nodes for logs that outgrow one server. Running on a dedicated VPS on RepoCloud with guaranteed CPU, RAM, and SSD, full root SSH access, and a browser serial console. Apache 2.0 licensed.
Nezha Monitoring
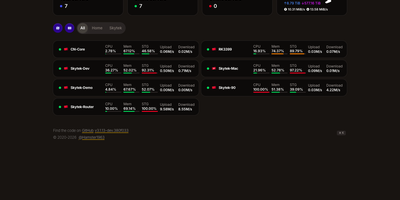
Keep every VPS, home-lab box, NAS, and router you run on one self-hosted dashboard, with a small agent on each machine reporting whether it is up and how hard it is working. Nezha tracks CPU, memory, swap, disk, load, traffic, process counts, and TCP and UDP connections on Linux, Windows, macOS, OpenWRT, and Synology machines, plus GPU and temperature where supported. Servers sort into groups and appear as cards, a list, or a world map, with live charts and, when the optional time-series database is on, 1, 7, and 30 days of history. HTTP GET, ICMP Ping, and TCPing monitors run from the servers you choose, chart latency and packet loss, and warn about HTTPS certificate changes and upcoming expiry. Alert rules watch offline servers, resource use, bandwidth, and cycle traffic limits, then message Telegram, Slack, Matrix, Feishu, DingTalk, or any webhook. A browser terminal and file manager handle quick fixes, while scheduled or alert-triggered tasks run backups, restarts, and scripts across many servers. DDNS updates Cloudflare, Tencent Cloud, or Hurricane Electric records when an agent's IP changes, and NAT traversal publishes a home router or NAS page on your own domain. Admin and user roles, scoped API tokens, and an optional MCP endpoint let people and AI tools list servers and run commands within their permissions. Running on a dedicated VPS on RepoCloud with guaranteed CPU, RAM, and SSD, full root SSH access, and a browser serial console. Apache-2.0 licensed.
Healthchecks
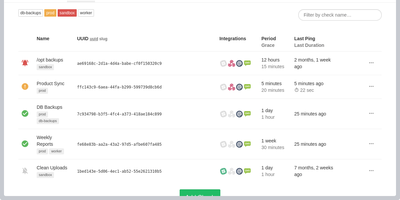
With 10,100+ GitHub stars and 75 releases over a decade of continuous development, Healthchecks is the open-source cron job monitoring service that catches failures your other monitoring tools miss — the jobs that silently stop running, the backups that never completed, the nightly reports that disappeared without error. The dead man's switch architecture requires zero agent installation: your cron jobs, scripts, and services ping a unique URL via HTTP request or email, and Healthchecks alerts you only when a ping does not arrive within the configured Period and Grace Time window. Each check supports cron expression scheduling, optional start, success, and failure signals for measuring execution time, and HTTP body keyword filtering for intelligent alert routing. Twenty-five notification integrations cover every channel teams actually use: Slack, Discord, Microsoft Teams, PagerDuty, Opsgenie, Splunk On-Call, Telegram, Signal, WhatsApp, SMS, email, webhooks, GitHub Issues, Pushover, ntfy, Gotify, Matrix, Mattermost, Zulip, Pushbullet, PagerTree, Spike.sh, and Trello. The web dashboard provides a visual grid showing real-time status with color-coded badges and per-check integration toggles. Monthly, weekly, and daily email reports summarize uptime trends with checks sorted by downtime duration. Team management supports projects with member roles and read-only access. Prometheus metrics expose check health and grace state for Grafana dashboards. WebAuthn and TOTP two-factor authentication secure accounts. Deploy via Docker images available for amd64, arm/v7, and arm64 architectures. Running on a dedicated VPS on RepoCloud with guaranteed CPU, RAM, and SSD, full root SSH access, and a browser serial console. BSD 3-Clause licensed.
Peekaping
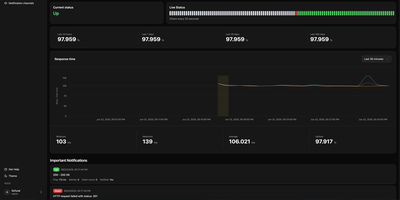
Keep users ahead of outages by consolidating infrastructure monitoring into Peekaping, a unified uptime monitoring and incident communication platform that alerts engineering teams to network and application failures before customers experience disruptions. Users can configure automated synthetic checks across HTTP endpoints, database engines, message queues, and container runtimes to verify response latency, payload integrity, and SSL certificate expiration. When performance thresholds degrade or connections drop, the platform broadcasts structured incident notices across twenty-two notification channels including Slack, Discord, Telegram, PagerDuty, and custom webhooks. Visual dashboards display live heartbeat timelines, historical latency percentiles, and rolling availability scores for each monitored endpoint. System administrators can assemble custom public status pages with custom domains, branded color schemes, and component grouping to inform external stakeholders during planned maintenance or unforeseen service degradations. Teams can schedule recurring maintenance windows to pause alert notifications during routine deployments and generate API tokens to automate monitor creation directly from CI/CD deployment pipelines. Running on a dedicated VPS on RepoCloud with guaranteed CPU, RAM, and SSD, full root SSH access, and a browser serial console. MIT licensed.
Gatus
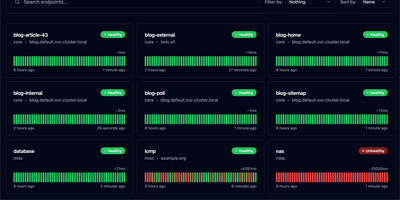
With 11,400+ GitHub stars and active development since 2019, Gatus is the developer-oriented status page and health monitoring tool that ships as a single statically-linked Go binary in a scratch Docker image under 20 MB — deploying in seconds while monitoring your entire infrastructure across 12 protocols from a single YAML configuration file. Define health checks for HTTP, ICMP, TCP, DNS, gRPC, WebSocket, SSH, UDP, SCTP, STARTTLS, and TLS endpoints with conditions that go far beyond simple ping: evaluate response status codes, body content with JSONPath expressions, response time thresholds, certificate expiration days, DNS record values, and IP address ranges. Each endpoint supports independent alerting through Slack, Microsoft Teams, PagerDuty, Discord, Telegram, Twilio, Mattermost, Google Chat, email, Gotify, Pushover, and custom webhook providers with configurable failure thresholds and descriptions. The built-in status page displays uptime badges, response time graphs, and incident timelines with maintenance window support for planned downtime communication. External endpoints accept push-based health reports from services behind firewalls. Prometheus metrics export via the /metrics endpoint enables integration with existing observability stacks. OIDC and Basic Authentication protect the dashboard. PostgreSQL persistence stores historical uptime data. The official Helm chart supports Kubernetes deployment with liveness probes and PVC storage, while a community sidecar auto-generates endpoint configurations from Kubernetes Ingress and HTTPRoute resources. Running on a dedicated VPS on RepoCloud with guaranteed CPU, RAM, and SSD, full root SSH access, and a browser serial console. Apache 2.0 licensed.
Kuvasz
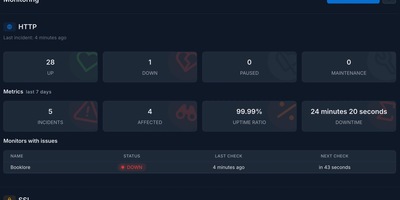
Continuous infrastructure monitoring meets automated SSL expiration tracking in Kuvasz, a self-hosted uptime platform that alerts DevOps teams before outages disrupt production operations. Operators can configure granular health checks across HTTP endpoints, ICMP ping targets, and raw TCP ports with custom polling intervals down to seconds. Automated SSL inspectors track certificate validity, issuing early warning notices before cryptographic chains expire and disrupt production traffic. A push monitoring system receives incoming heartbeat signals from background cron jobs, database backups, and recurring automation scripts, triggering alerts whenever expected pings fail to arrive on schedule. Multi-channel dispatchers route incident notifications through Slack, Discord, Telegram, Microsoft Teams, PagerDuty, and custom webhook payloads with adjustable failure count thresholds to eliminate transient false alarms. Maintenance windows let teams schedule planned downtime through one-off intervals or recurring cron expressions, automatically muting notifications during deployment cycles. Public and private status pages publish categorized system health metrics, historical latency charts, and incident timelines to keep internal stakeholders and end users informed. An integrated Model Context Protocol server allows AI assistants to query monitoring states and toggle checks directly via conversational interfaces. Running on a dedicated VPS on RepoCloud with guaranteed CPU, RAM, and SSD, full root SSH access, and a browser serial console. AGPL-3.0 licensed.
Checkcle
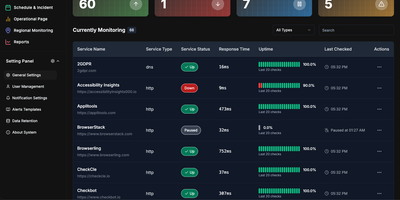
CheckCle provides a complete uptime monitoring and infrastructure observability platform that deploys with a single Docker container and stores all data in embedded SQLite via PocketBase. The Go backend runs three microservices — a service operation engine handling HTTP, HTTPS, DNS, Ping, and TCP checks at configurable intervals, a distributed regional check agent for multi-location network testing, and a server monitoring agent collecting CPU, RAM, disk usage, and network metrics via gRPC. The React frontend built with Vite, TypeScript, Tailwind CSS, and shadcn-ui subscribes to PocketBase WebSocket endpoints for real-time dashboard updates without polling. SSL and domain monitoring tracks certificate issuers, expiration dates, days remaining, and validation status. The incident management system records UP, DOWN, WARNING, and PAUSE states with full history, while scheduled maintenance windows prevent false alerts during planned downtime. Public status pages provide external stakeholders with live service health information. Health heatmaps visualize uptime performance and outage patterns over time. Notification channels include email, Telegram, Discord, and Slack, with multiple alert targets per monitored service. The one-click agent installation script supports Debian, Ubuntu, CentOS, Red Hat, Alpine, and Windows in beta. Docker deployment runs on port 8090 with a single persistent volume at /mnt/pb_data, requiring minimum 1 vCPU and 500MB RAM. On RepoCloud, deploy CheckCle on a dedicated VPS with root SSH access, persistent storage for your monitoring database, and complete control over agent endpoints and notification configurations, all under the MIT license.
OpenStatus
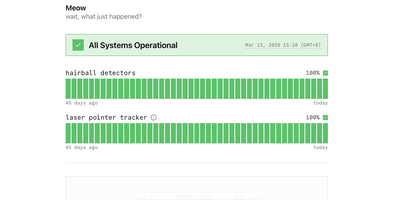
Trusted by Cal.com, WhiteBIT, and Documenso and backed by 8,800+ GitHub stars, OpenStatus delivers the open-source status page and uptime monitoring platform that replaces Atlassian Statuspage, Better Stack, and Instatus with a single self-hosted deployment. The monitoring engine runs Go-based probes across 28 global regions on three cloud providers checking HTTP, TCP, and DNS endpoints in parallel with configurable intervals and multi-region consensus to eliminate false-positive alerts. Status pages ship with custom domain support, password and email-domain access controls, maintenance windows, grouped monitor components, and subscriber notifications via email and RSS. Incident management provides structured status reports with investigating, identified, monitoring, and resolved timeline phases that publish automatically to affected status pages. The monitoring-as-code workflow supports YAML configuration synced through the CLI, a GitHub Actions integration for CI/CD pipelines, and a Terraform provider for infrastructure-as-code deployments. The typed ConnectRPC JSON-over-HTTP API exposes a published OpenAPI specification with a Node SDK for programmatic access, while an MCP server connects AI assistants like Claude, ChatGPT, and Cursor directly to workspace data. The tech stack combines Next.js with shadcn/ui for the dashboard, Hono for the API server, Drizzle ORM over Turso for application data, and Tinybird for analytics. Private monitoring locations deploy as a single 8.5MB Docker image behind firewalls to check internal services. Running on a dedicated VPS on RepoCloud with guaranteed CPU, RAM, and SSD, full root SSH access, and a browser serial console. AGPL-3.0 licensed.
Kener
A polished public status page without Statuspage prices or a heavyweight observability suite: Kener is a status and uptime monitoring system built with SvelteKit and Node.js. It runs 11 monitor types - API, Ping, TCP, DNS, SSL certificate, SQL query, Heartbeat, gRPC, and GameDig game-server checks among them - each with configurable intervals and thresholds. Incident management covers the full lifecycle: structured timelines from investigation through resolution, acknowledgements, and subscriber-visible updates, plus maintenance windows with RRULE-based recurring schedules and automatic status transitions. Notifications reach email, Slack, Discord, and custom webhooks through trigger-based workflows with template-driven messaging. One instance can serve multiple branded status pages - per product, team, or region - with custom logos, colors, and CSS, localization into 21 languages, timezone-aware displays, and server-rendered pages that stay fast and SEO-friendly. Operations tooling includes role-based access for teams, API key management, a secrets vault, analytics integrations (Google Analytics, Plausible, Umami, and others), and a REST API with 17+ endpoints for automating incidents and monitors from CI/CD. MIT-licensed; Docker deployment with Redis, SQLite by default, PostgreSQL or MySQL for production.
ServerBee
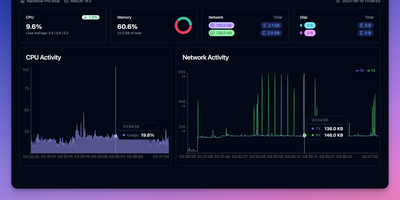
ServerBee delivers complete fleet monitoring from a single Rust binary that embeds both the server and web UI, requiring no external database or heavy runtime. Lightweight agents installed on each node stream CPU, memory, disk, network, load, temperature, GPU, and disk I/O metrics over persistent WebSocket connections to a central server backed by embedded SQLite. The real-time React dashboard presents 17 drag-and-drop widget types across custom layouts, with historical charts spanning one hour to 30 days and monthly traffic statistics with billing-cycle prediction and cost insights including burn rate and per-resource unit cost scoring. Network monitoring covers ICMP, TCP, and HTTP ping probes, service monitors for SSL certificates, DNS records, HTTP keyword matching, TCP ports, and WHOIS expiration, plus network-quality probing across 96 China 3-ISP and international presets with IP-quality and streaming-unlock detection. Remote management features include a web terminal with sandboxed file manager, Docker container stats with logs and events, firewall configuration, and agent auto-update capabilities. Public status pages display 90-day uptime timelines, while alerting supports email and webhook notifications with flexible trigger expressions. A native iOS companion app provides mobile monitoring access. Deploy via Docker or download the single binary for Linux, macOS, or Windows, running on a dedicated VPS on RepoCloud with guaranteed CPU, RAM, and SSD, full root SSH access, and a browser serial console. AGPL-3.0 licensed.
Maintenant
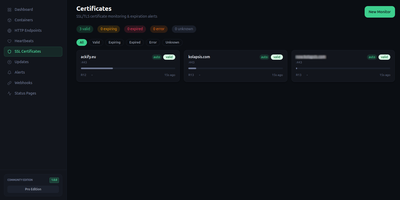
Maintenant replaces three to five separate monitoring tools with a single Go binary that consolidates container discovery, endpoint monitoring, SSL tracking, resource metrics, and public status pages without requiring any external database. The embedded Vue 3 frontend serves on port 8080 immediately after deployment, auto-discovering Docker containers and Kubernetes pods through direct socket and API access without configuration. HTTP and TCP endpoint monitoring validates availability with configurable intervals, while TLS certificate tracking alerts before expiration across all monitored domains. Resource metrics collect CPU, RAM, network throughput, and disk usage per container with real-time Server-Sent Events streaming to the dashboard. Heartbeat and cron monitoring accepts pings from external scheduled jobs, triggering alerts on missed check-ins via webhook callbacks and Discord notifications. The built-in alert engine supports escalation rules and notification batching. Public status pages expose component health to end users without authentication, customizable per monitored service. Network security insights analyze exposed ports, container privilege levels, and host configuration to produce a posture score. Update intelligence scans OCI registries to detect available container image updates with digest comparison. The REST API with SSE broker enables automation, and the integrated MCP server provides tooling for AI assistant integration. SQLite in WAL mode stores all data with zero operational overhead. Running on a dedicated VPS on RepoCloud with guaranteed CPU, RAM, and SSD, full root SSH access, and a browser serial console. AGPL-3.0 licensed.