Categories
DevOps Monitoring Infrastructure Observability Status Page Incident Management Uptime MonitoringStars
Forks
Watchers
Developer links
OpenStatus
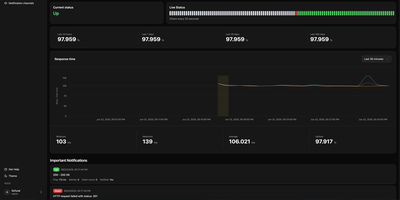
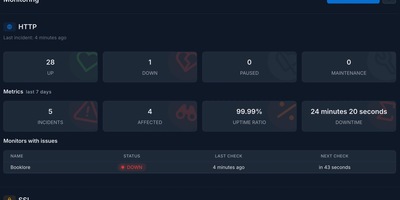
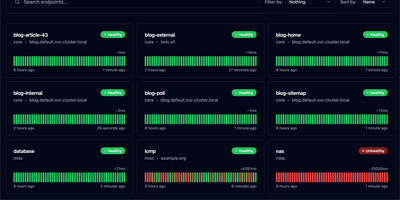
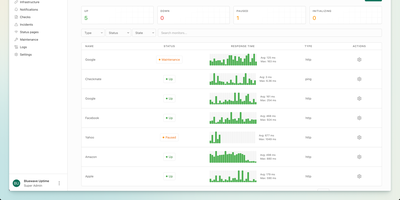
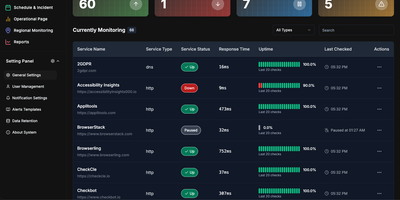
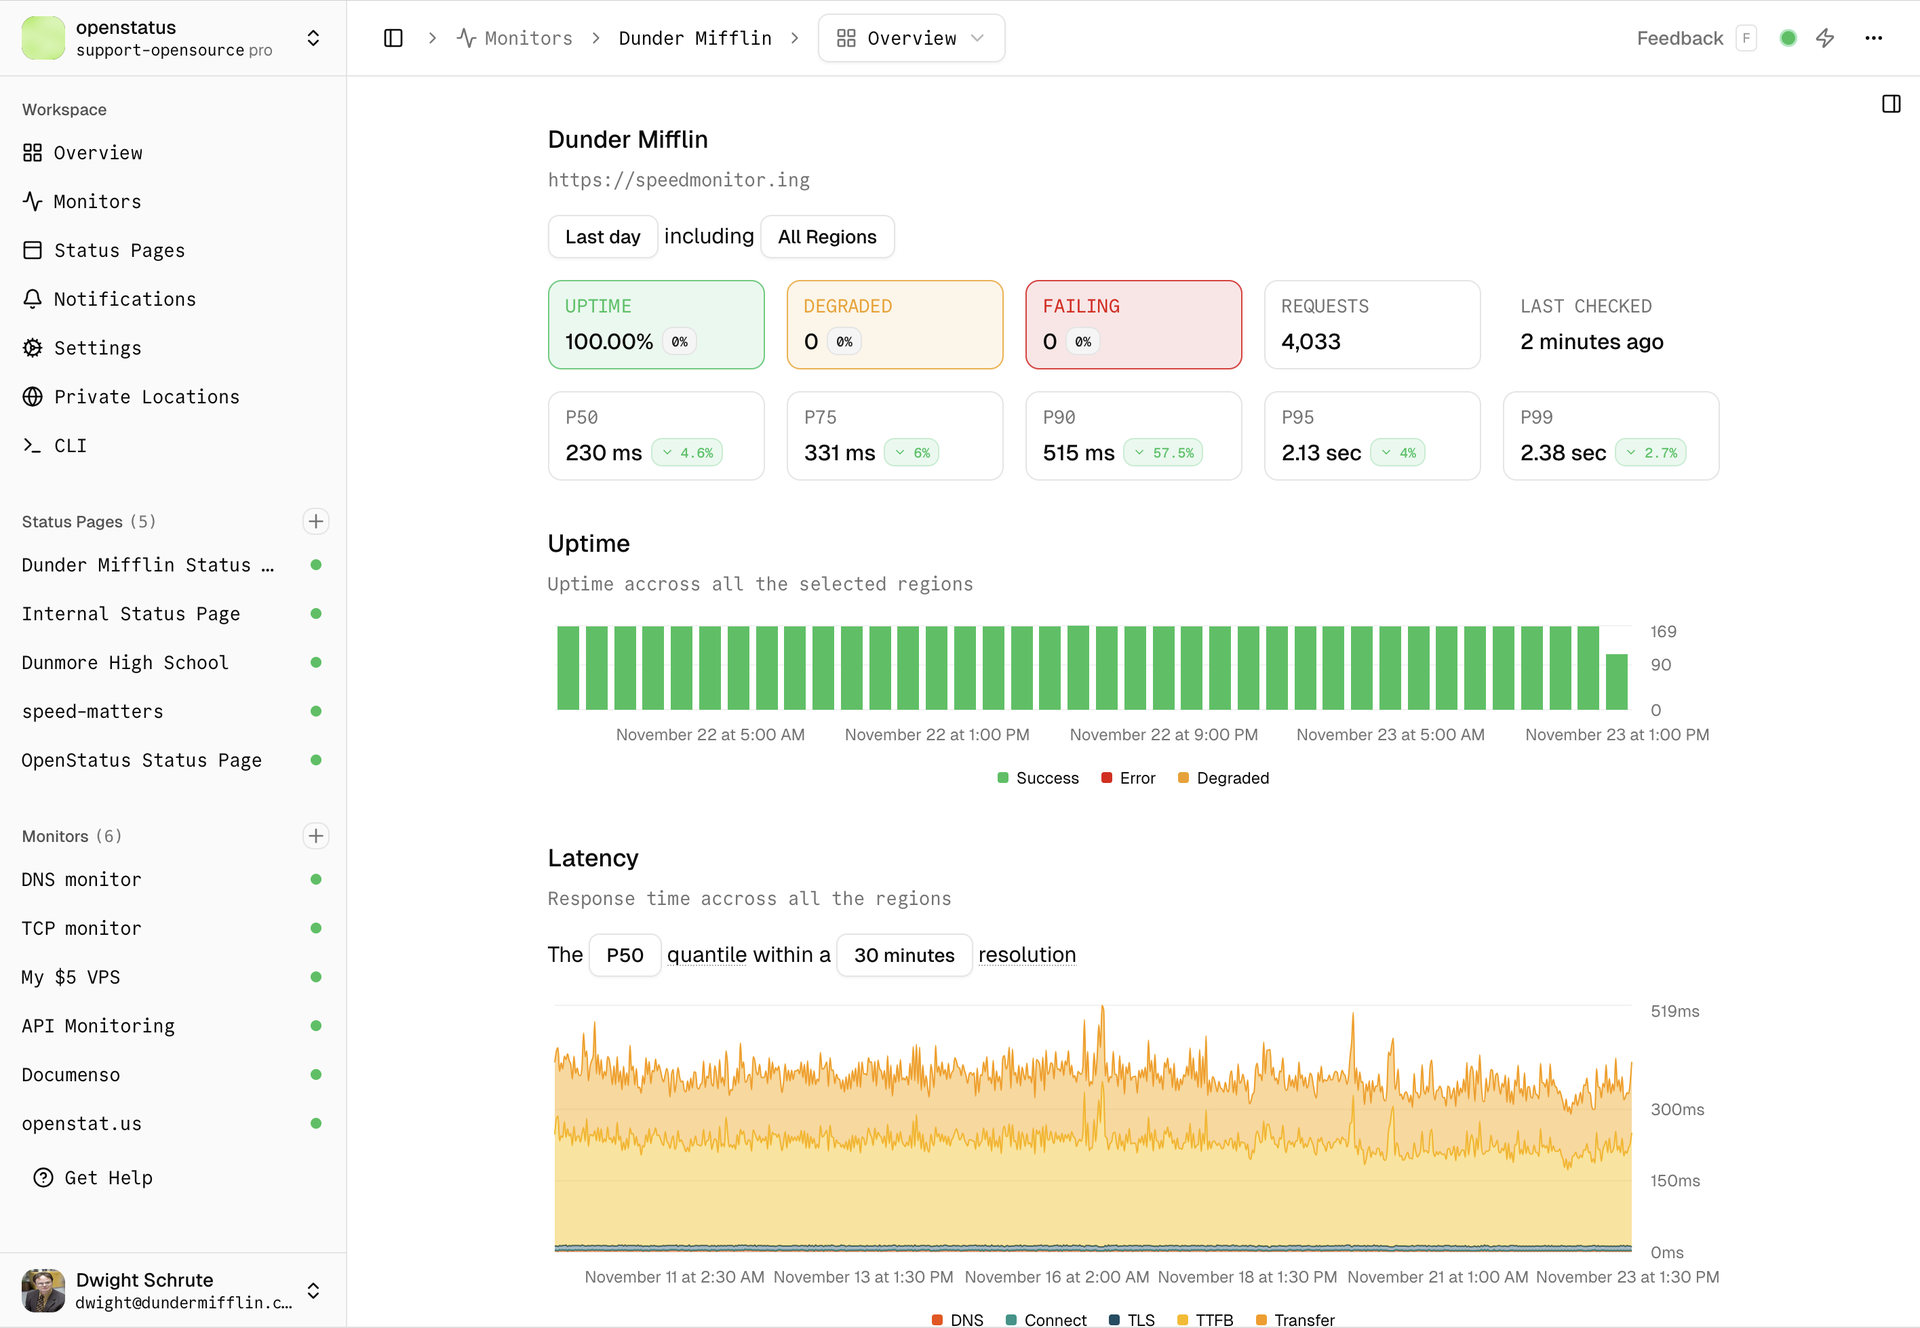
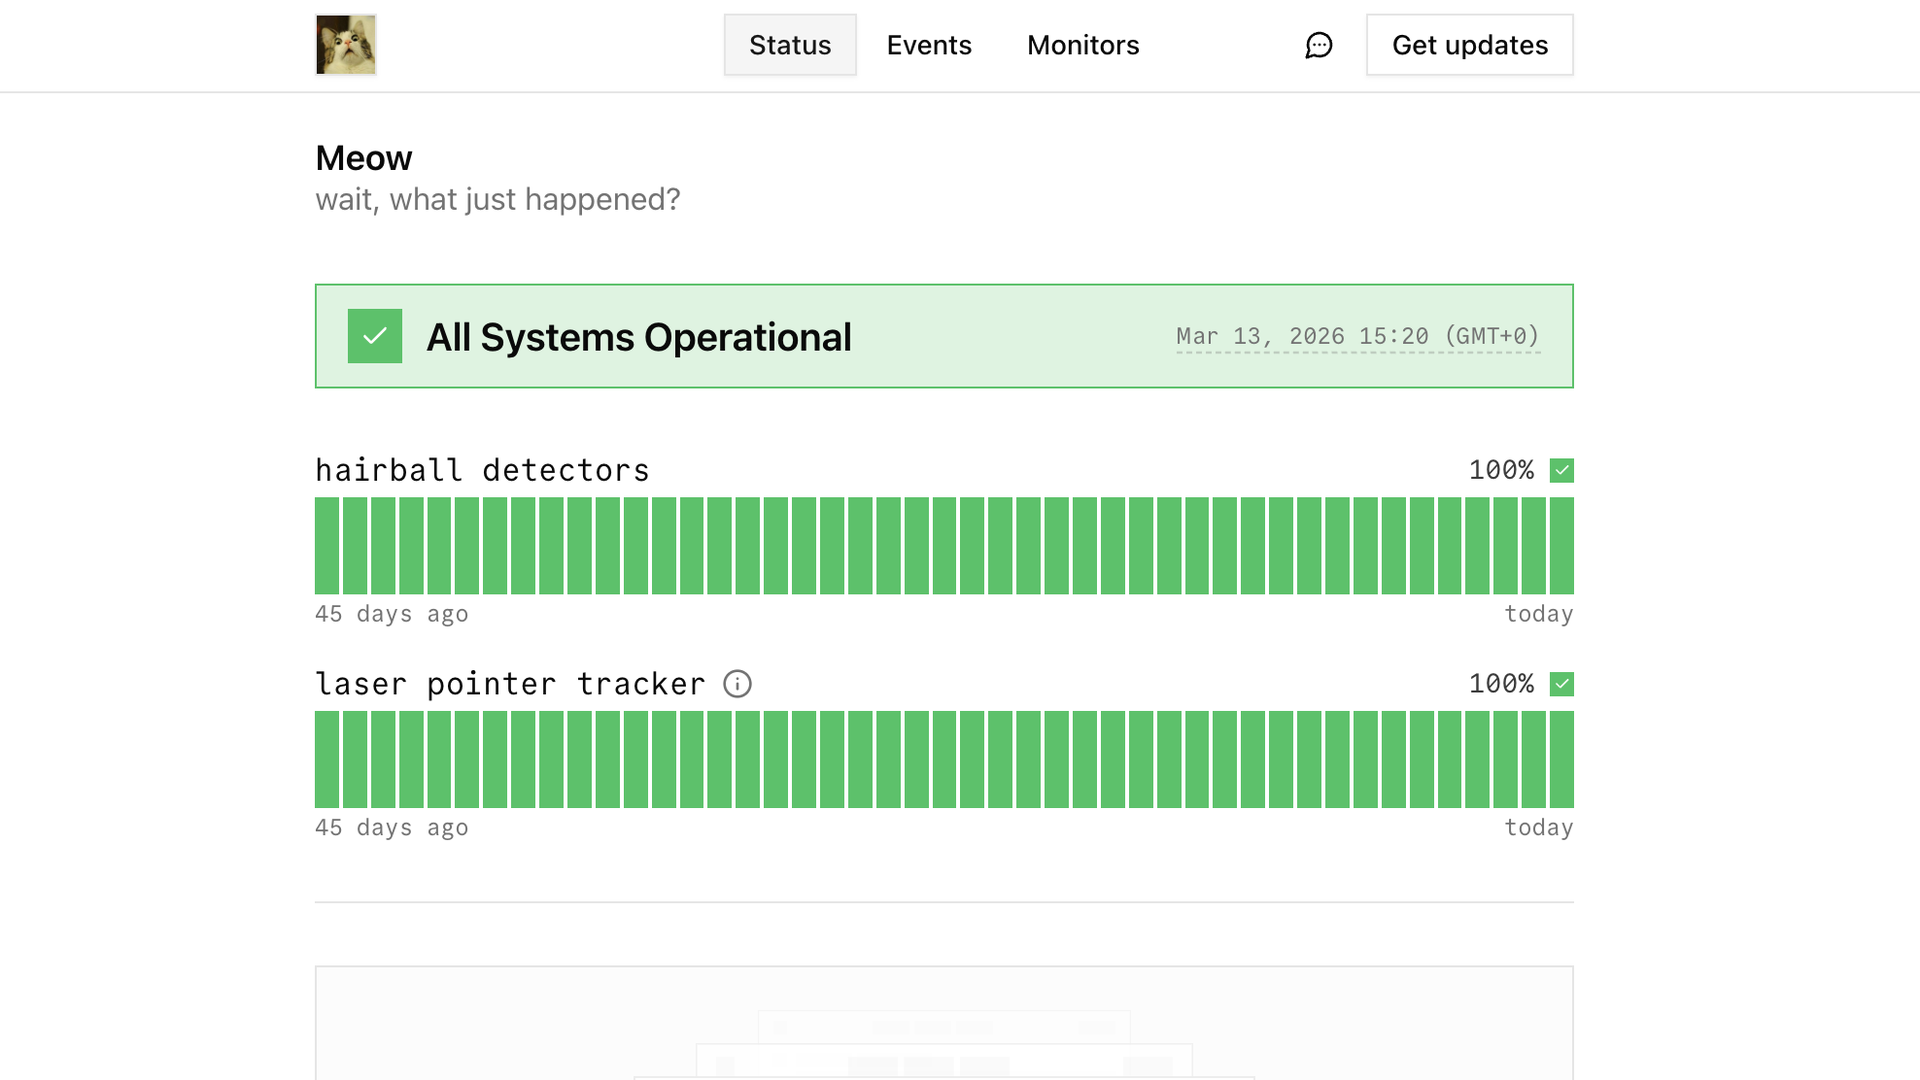
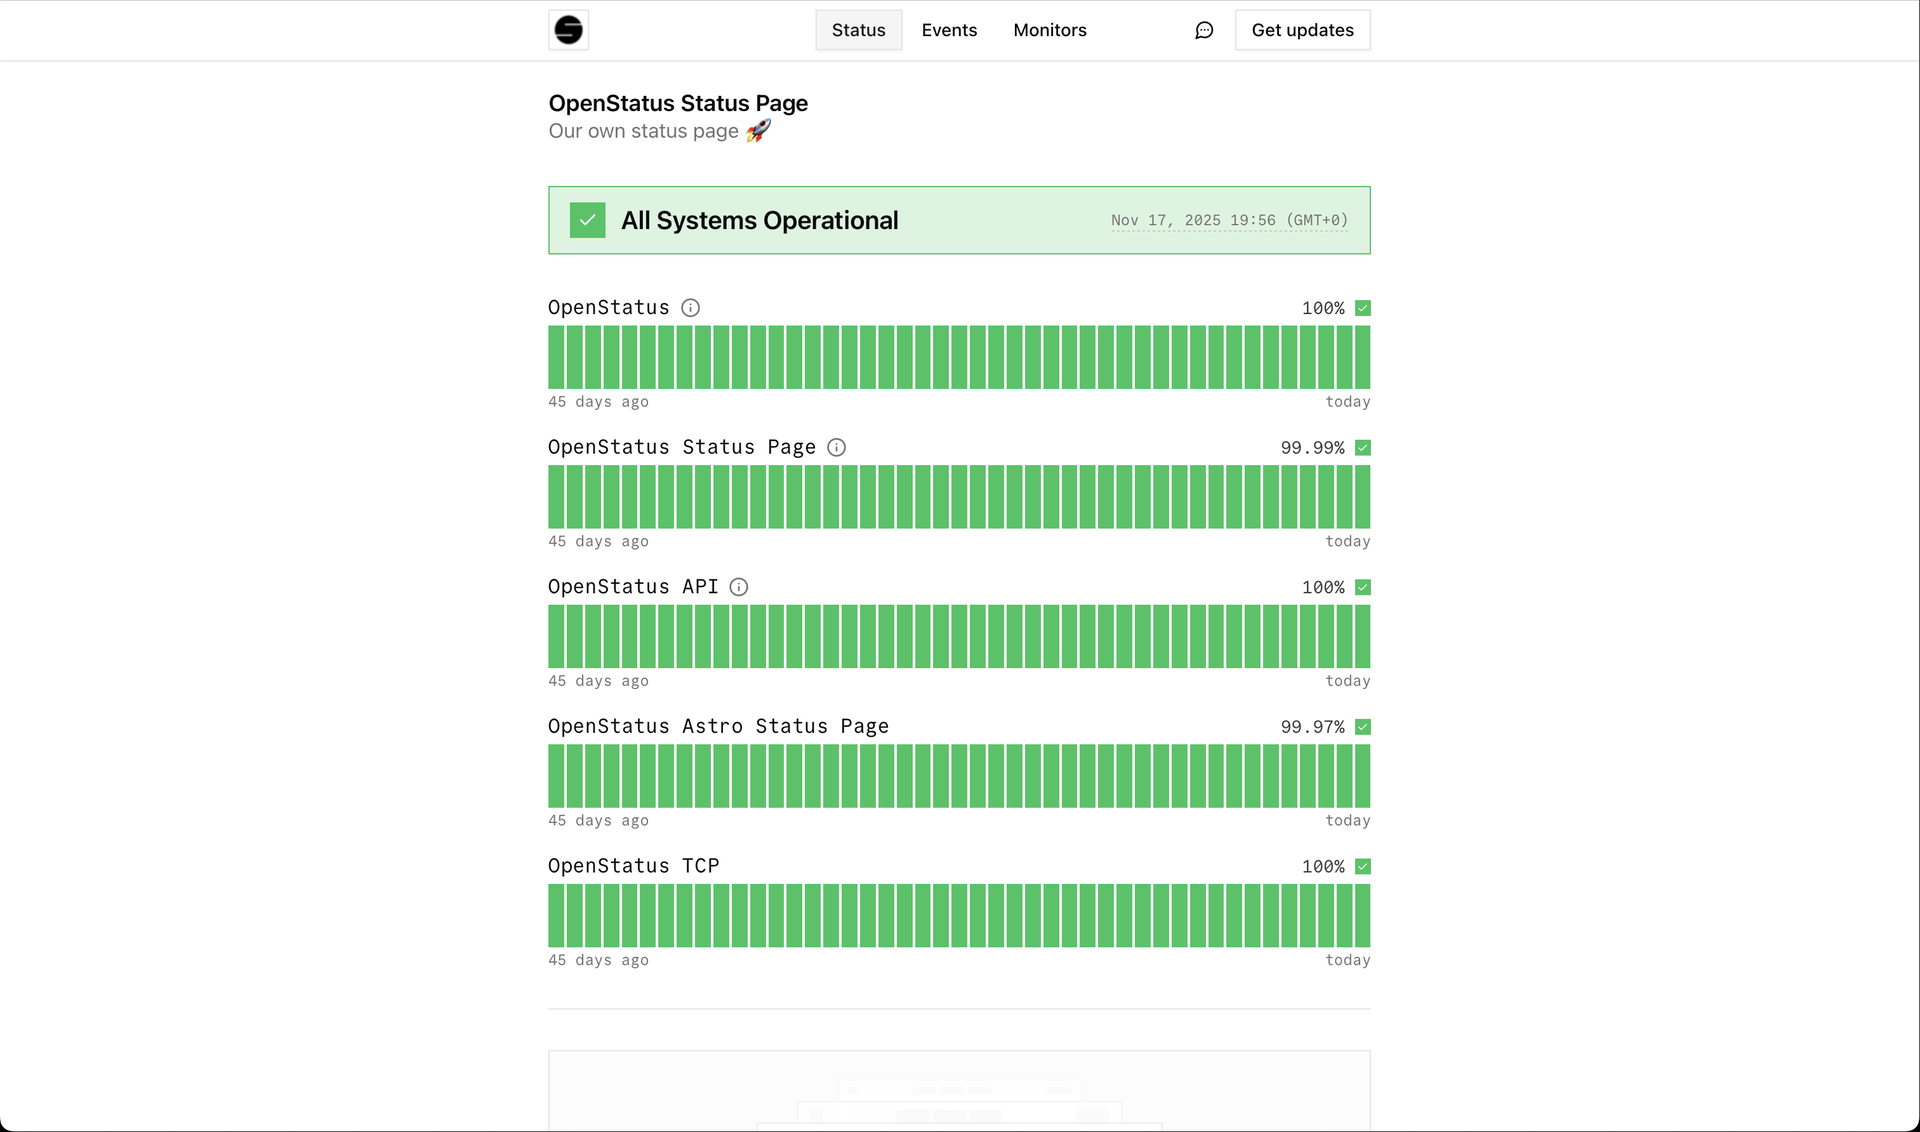
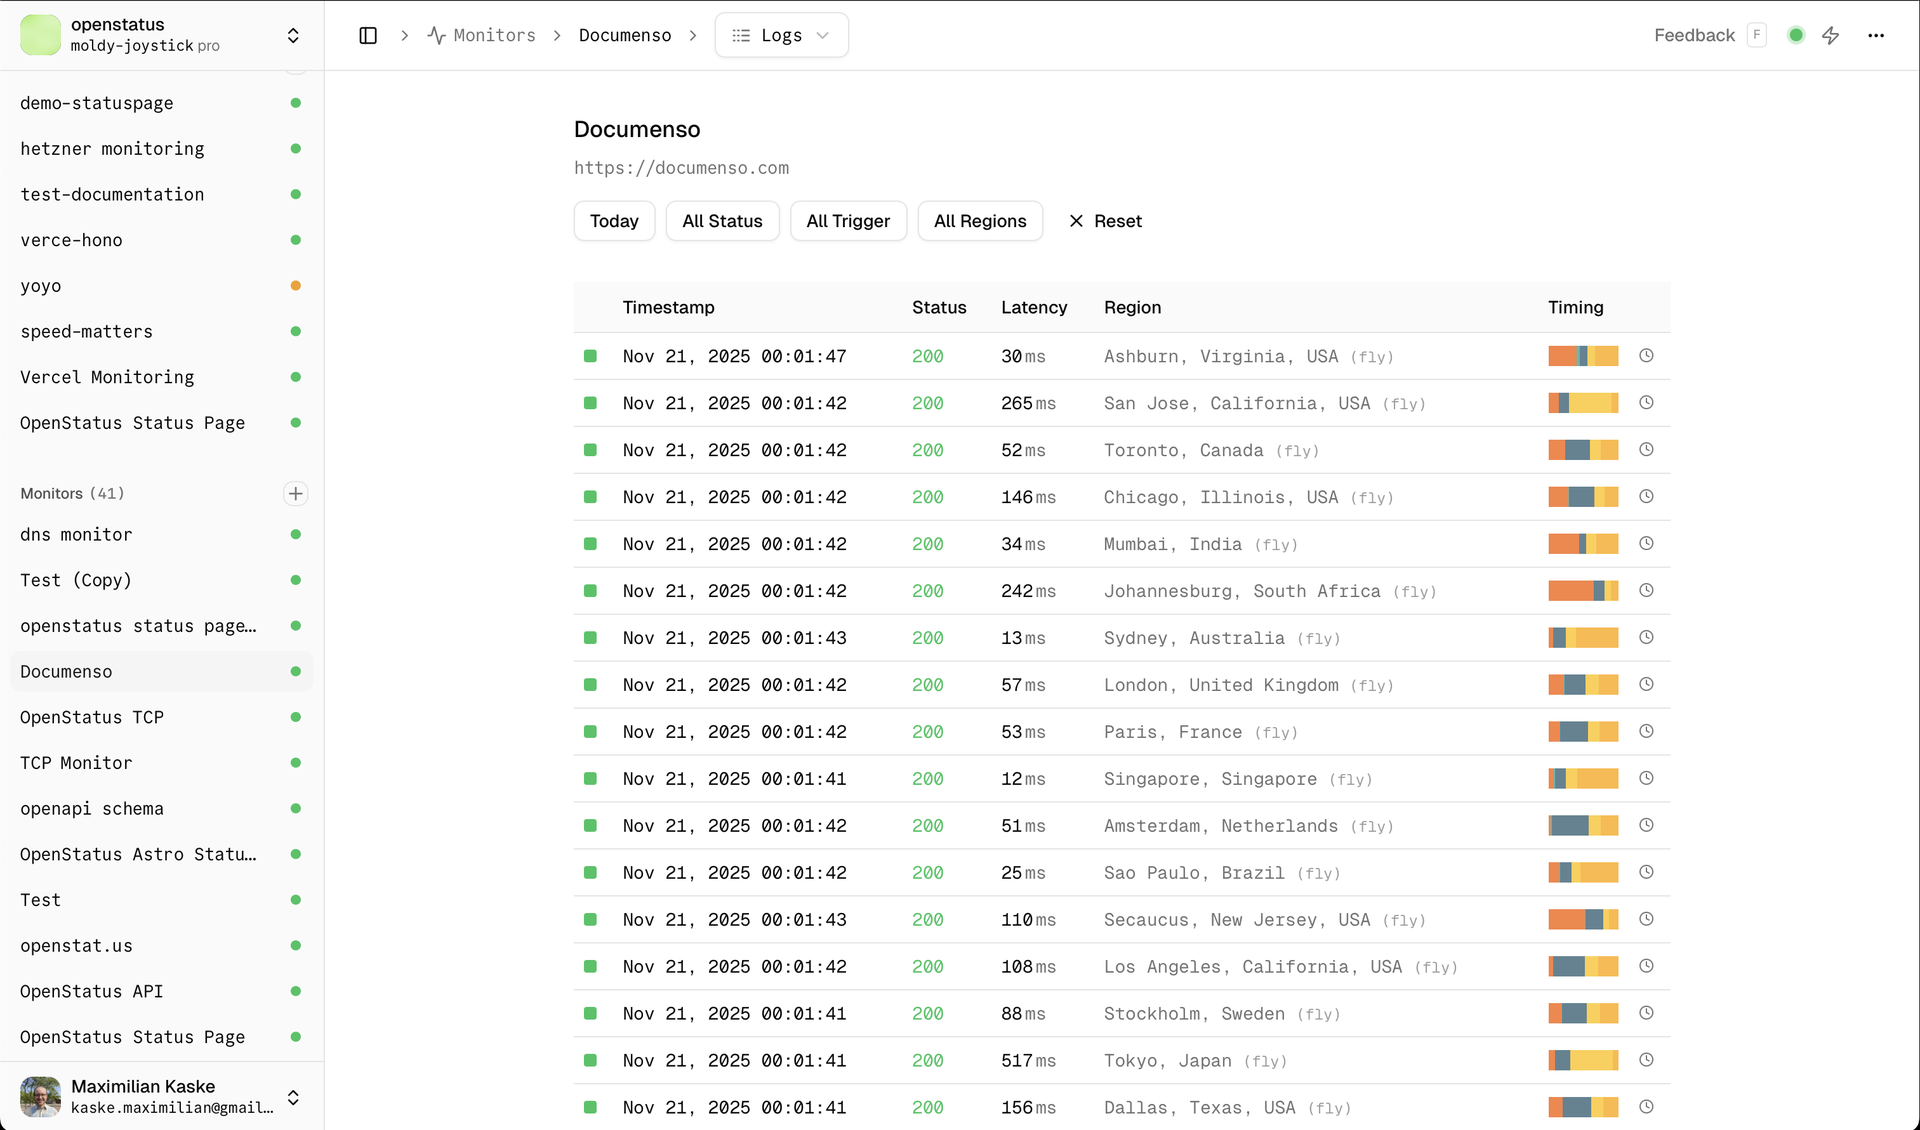
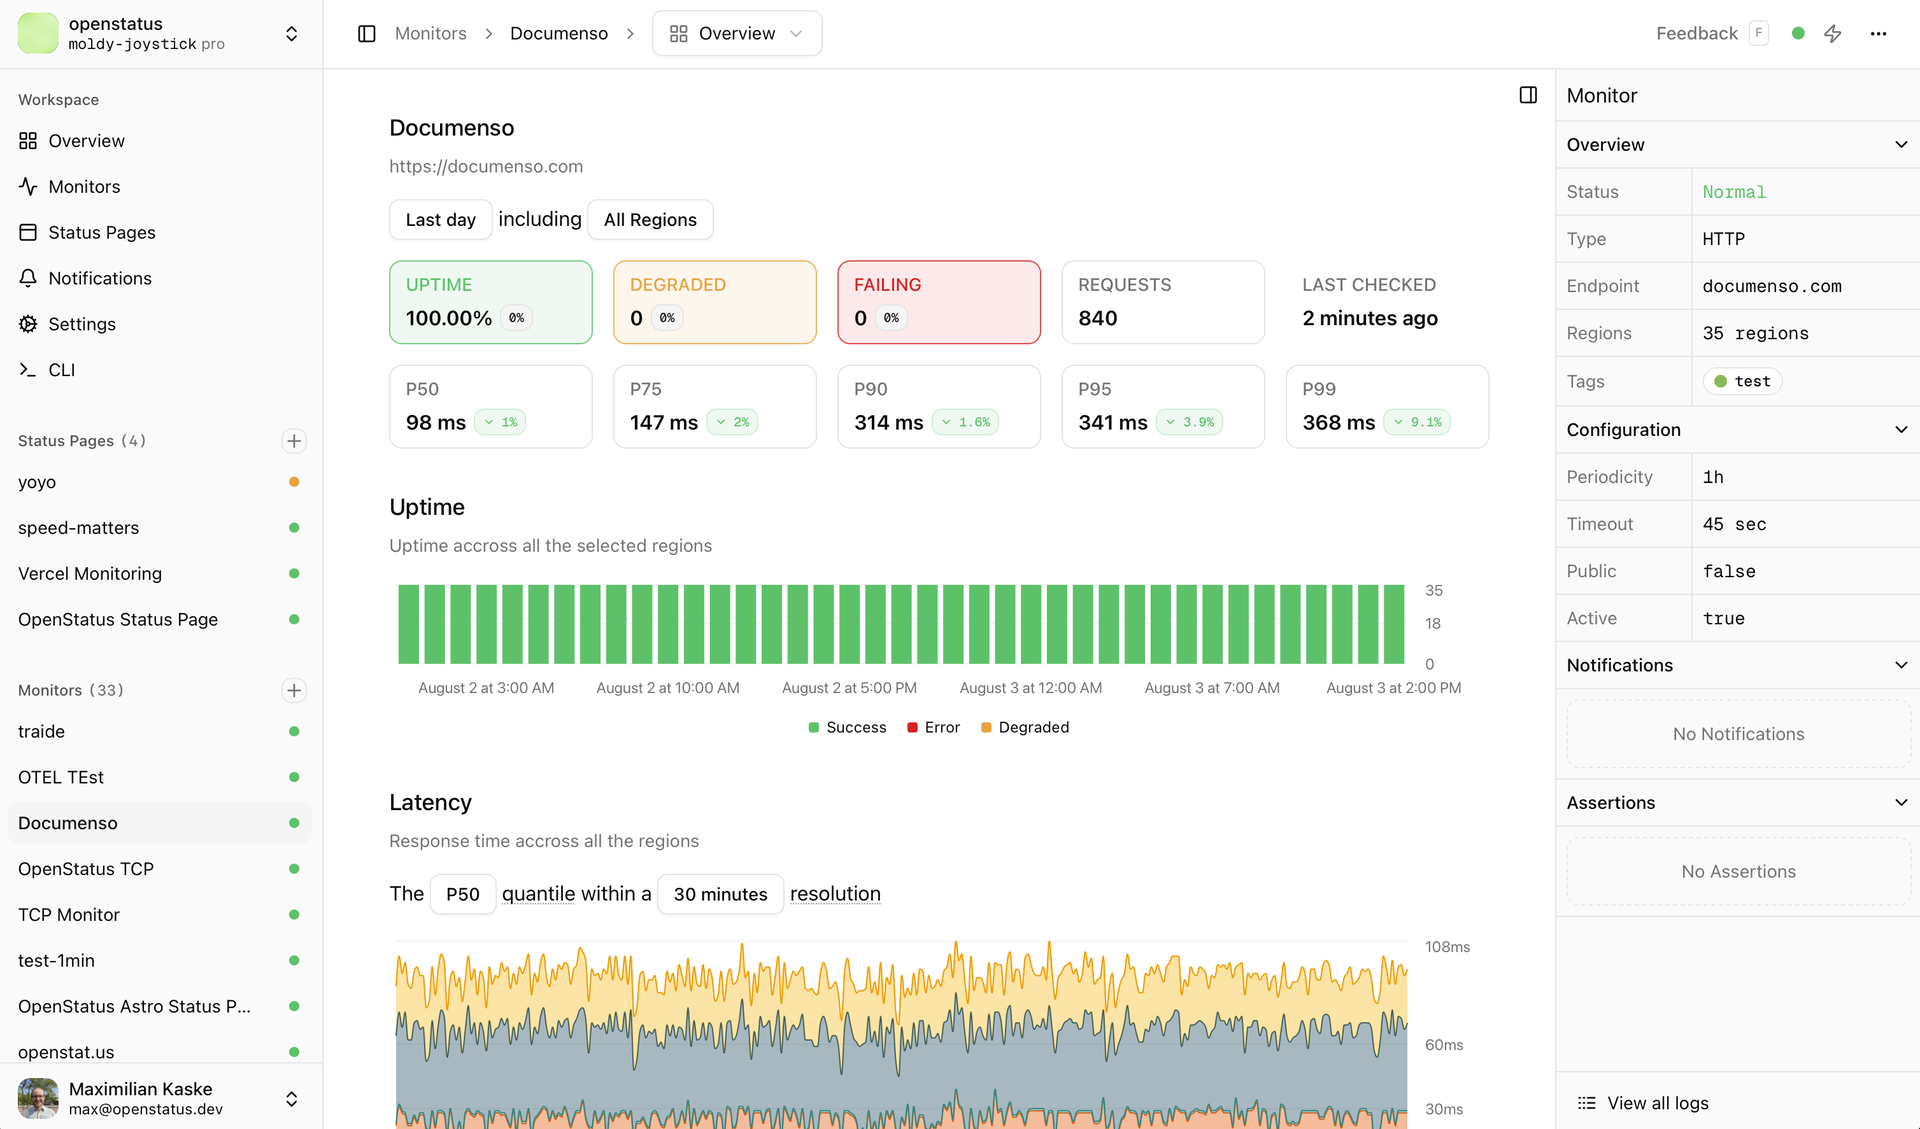
Trusted by Cal.com, WhiteBIT, and Documenso and backed by 8,800+ GitHub stars, OpenStatus delivers the open-source status page and uptime monitoring platform that replaces Atlassian Statuspage, Better Stack, and Instatus with a single self-hosted deployment. The monitoring engine runs Go-based probes across 28 global regions on three cloud providers checking HTTP, TCP, and DNS endpoints in parallel with configurable intervals and multi-region consensus to eliminate false-positive alerts. Status pages ship with custom domain support, password and email-domain access controls, maintenance windows, grouped monitor components, and subscriber notifications via email and RSS. Incident management provides structured status reports with investigating, identified, monitoring, and resolved timeline phases that publish automatically to affected status pages. The monitoring-as-code workflow supports YAML configuration synced through the CLI, a GitHub Actions integration for CI/CD pipelines, and a Terraform provider for infrastructure-as-code deployments. The typed ConnectRPC JSON-over-HTTP API exposes a published OpenAPI specification with a Node SDK for programmatic access, while an MCP server connects AI assistants like Claude, ChatGPT, and Cursor directly to workspace data. The tech stack combines Next.js with shadcn/ui for the dashboard, Hono for the API server, Drizzle ORM over Turso for application data, and Tinybird for analytics. Private monitoring locations deploy as a single 8.5MB Docker image behind firewalls to check internal services. Running on a dedicated VPS on RepoCloud with guaranteed CPU, RAM, and SSD, full root SSH access, and a browser serial console. AGPL-3.0 licensed.
Benefits
- Status Pages Plus Monitoring Combined
- Eliminates the need to wire separate monitoring and status page services together, providing unified incident detection, communication, and subscriber notifications in one deployment.
- 28 Global Monitoring Regions
- Go-based probes check HTTP, TCP, and DNS endpoints from 28 regions across three cloud providers with multi-region consensus preventing false-positive downtime alerts.
- Monitoring as Code Workflow
- Define monitors, notifications, and status pages in YAML files synced via CLI, GitHub Actions, or Terraform provider, enabling version-controlled infrastructure monitoring alongside application code.
- Tiny Self-Hosted Footprint
- Private location probes run as a single 8.5MB Docker image, and the full stack deploys via Docker Compose with LibSQL, eliminating complex infrastructure dependencies for self-hosting.
Features
- Branded Status Pages
- Custom domains, password protection, email-domain access controls, maintenance windows, grouped components, and subscriber notifications via email and RSS feeds.
- ConnectRPC Typed API
- JSON-over-HTTP API with published OpenAPI specification, Node SDK, and MCP server enabling programmatic monitor management and AI assistant integration.
- Incident Timeline Management
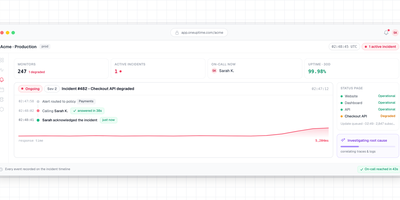
- Structured status reports with investigating, identified, monitoring, and resolved phases that auto-publish to affected status pages with subscriber notifications.
- Multi-Protocol Checks
- HTTP response validation, TCP port connectivity, and DNS resolution checks with configurable intervals, timeout thresholds, and assertion rules per endpoint.
- Terraform Provider
- Monitors, notification channels, and status pages defined as HCL resources enabling infrastructure-as-code workflows with plan, apply, and drift detection.