Stars
Forks
Watchers
Developer links
ServerBee
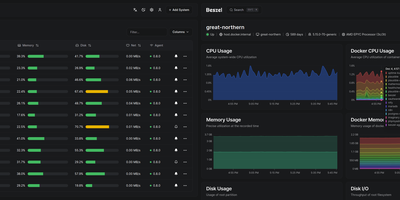
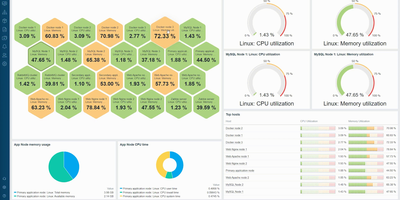
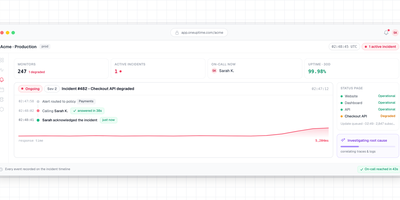
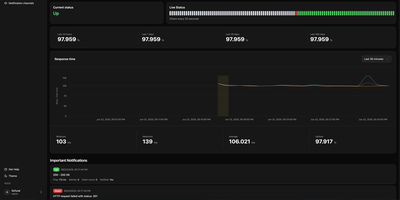
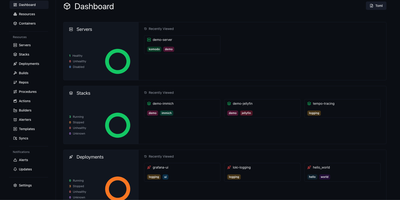
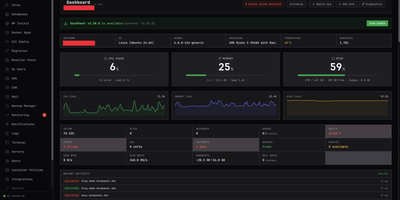
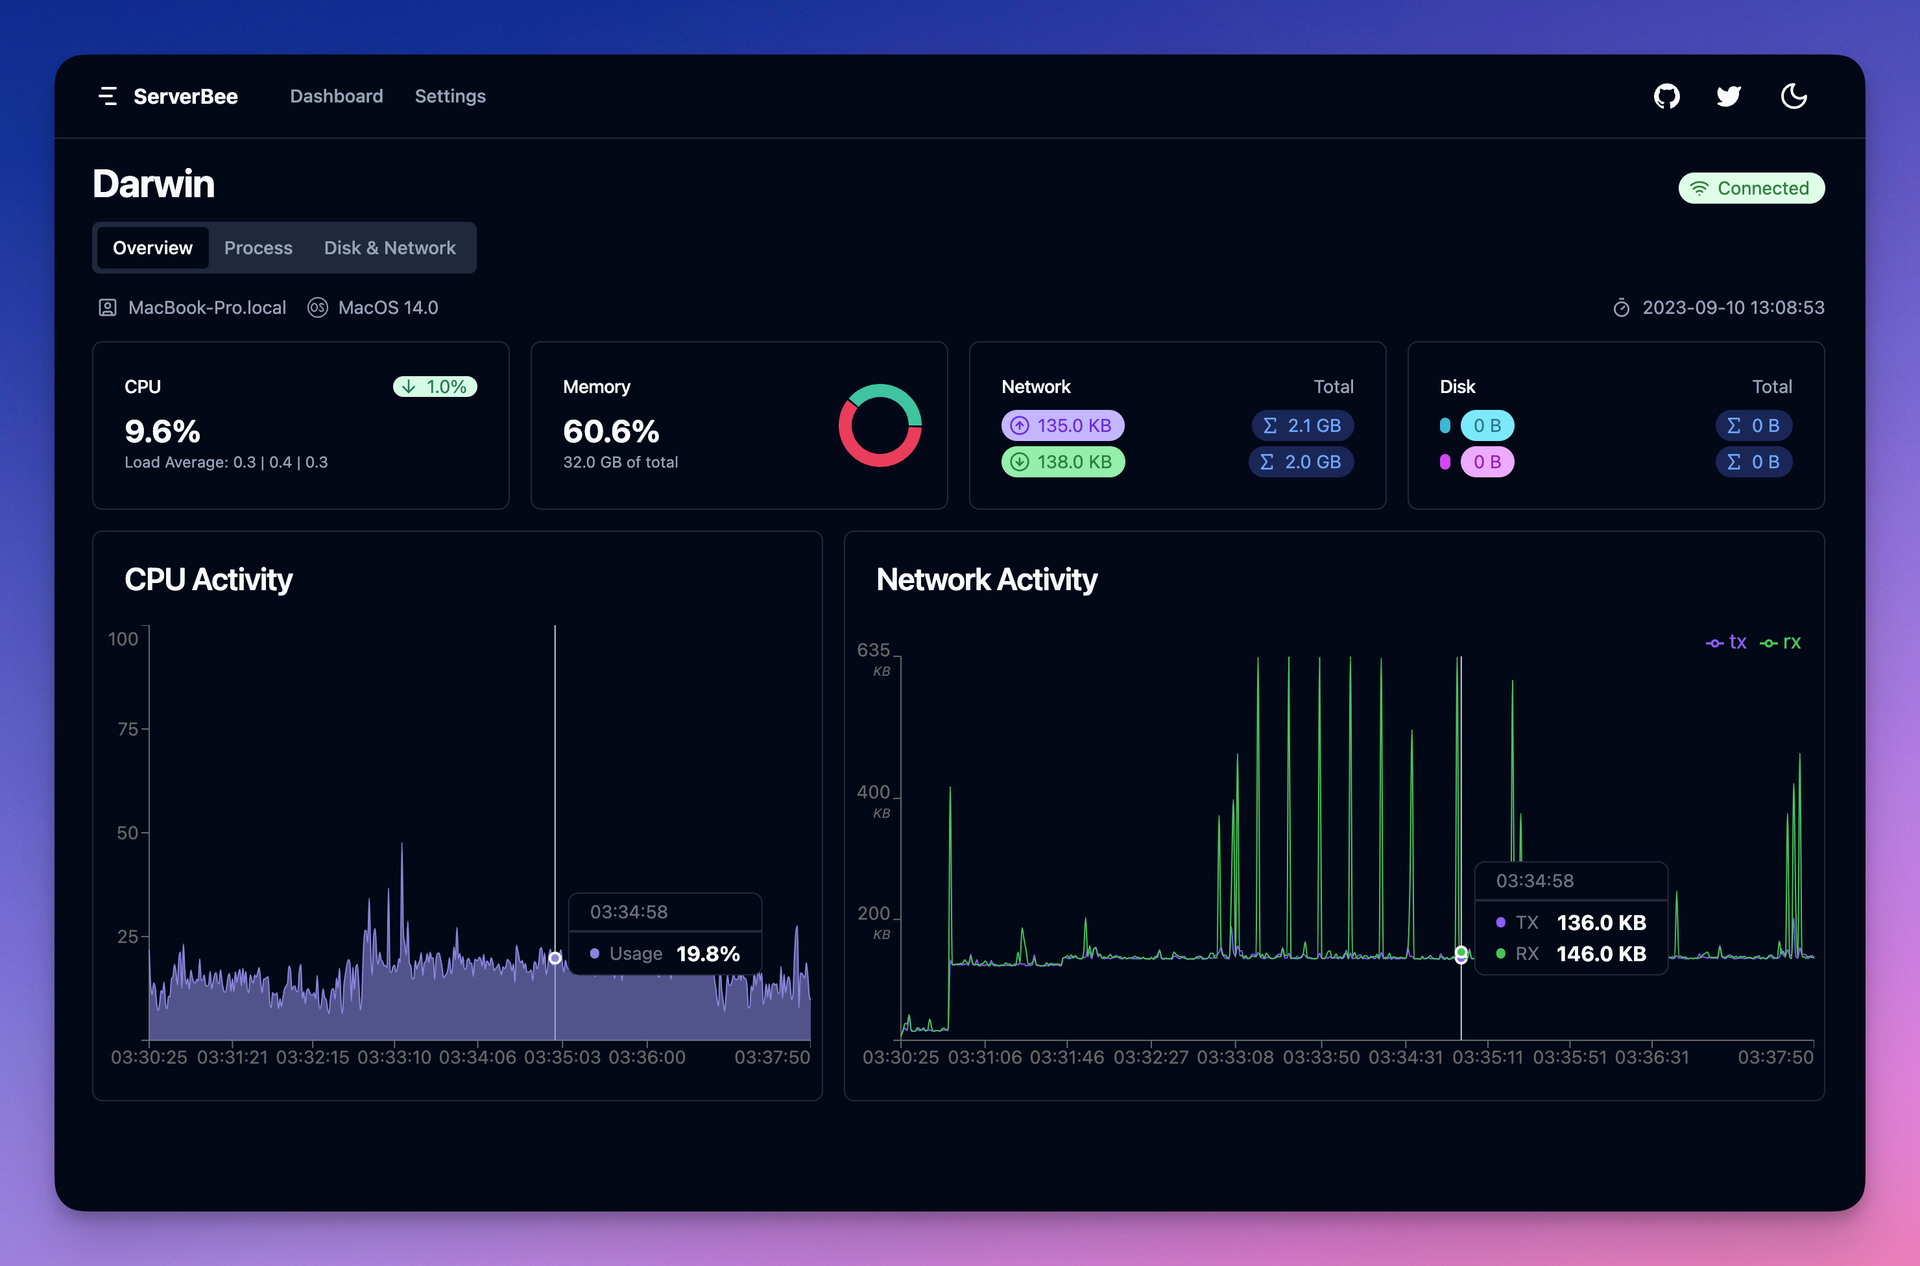
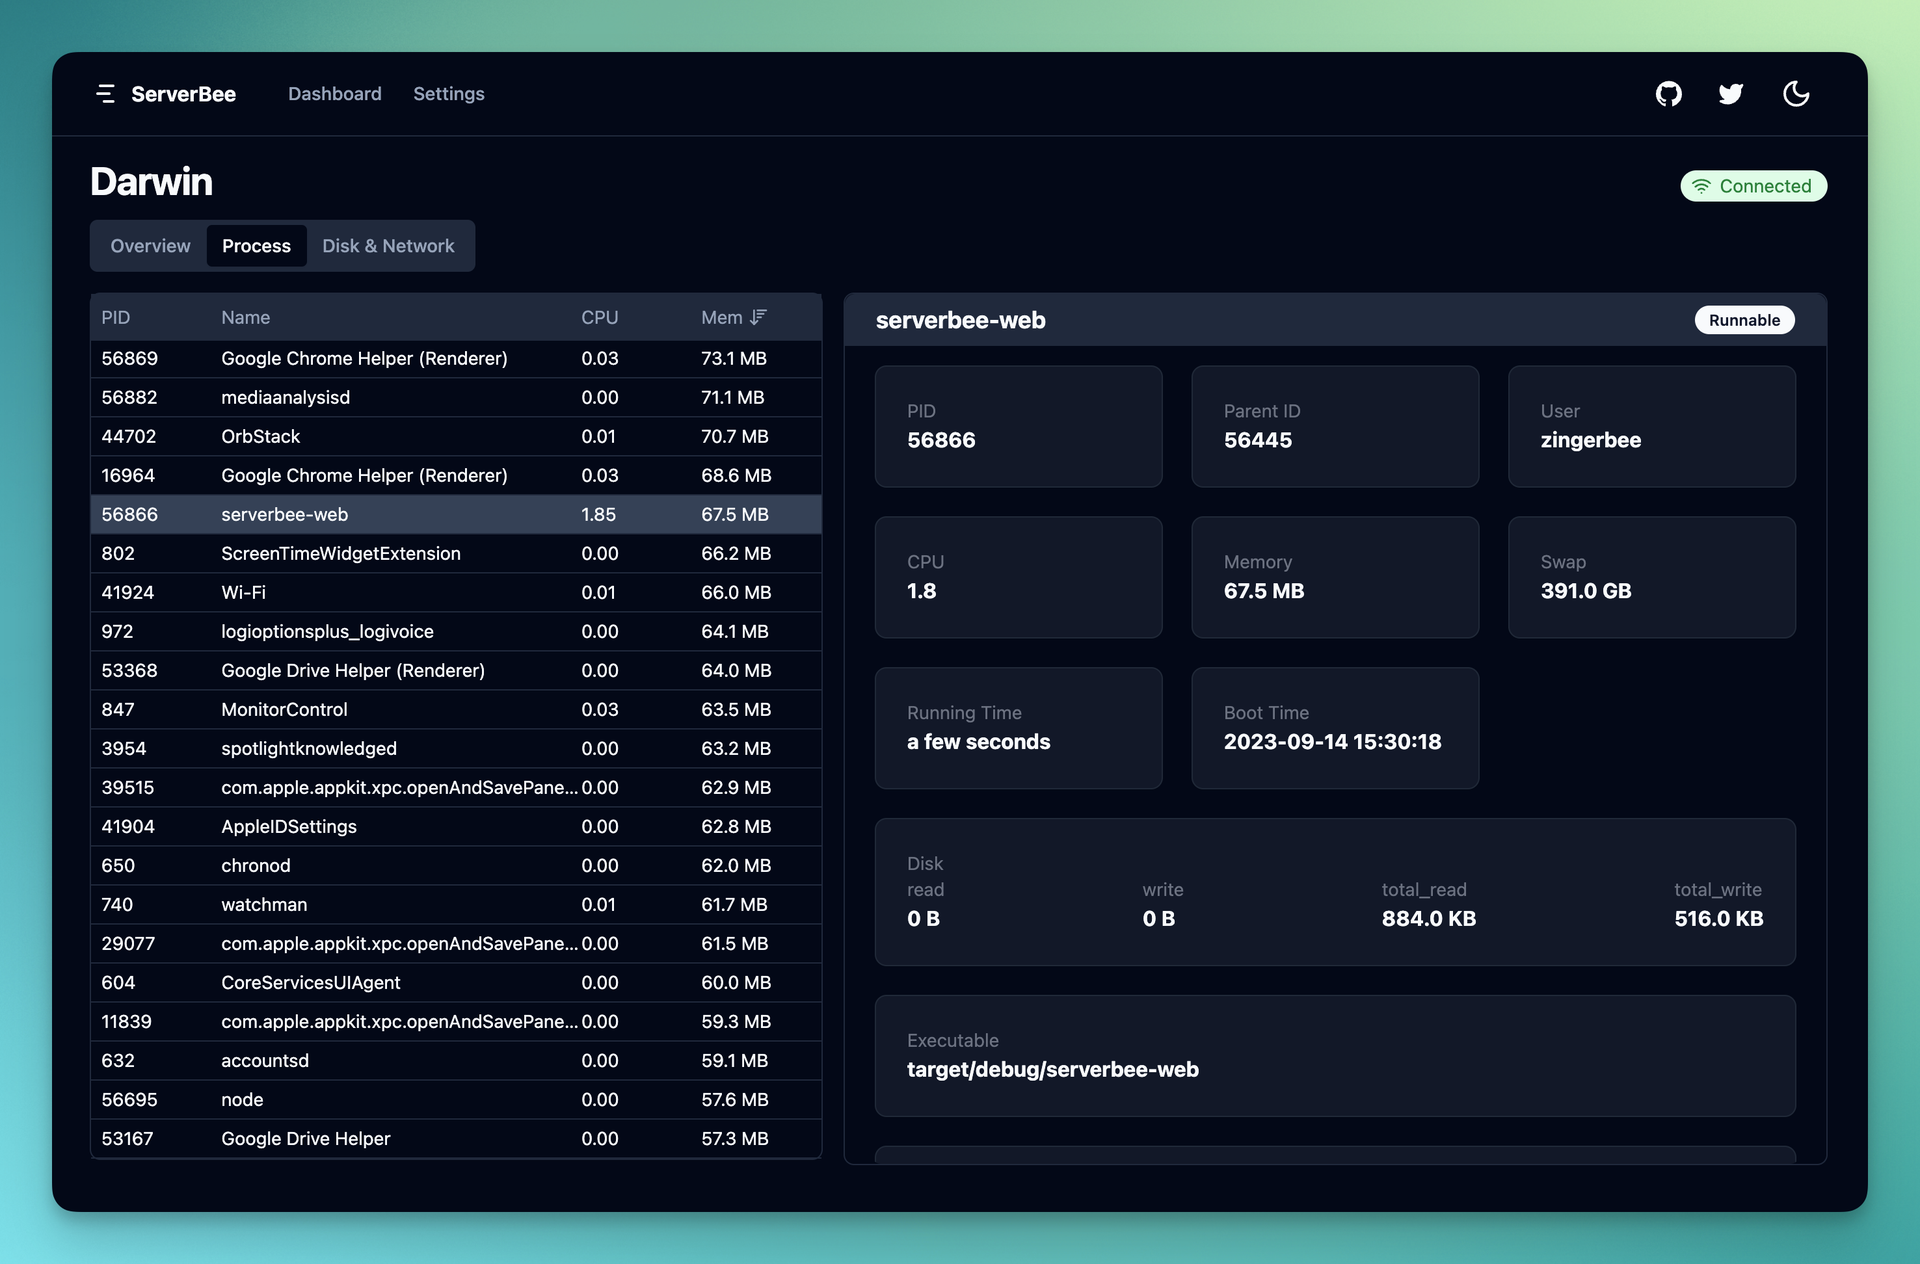
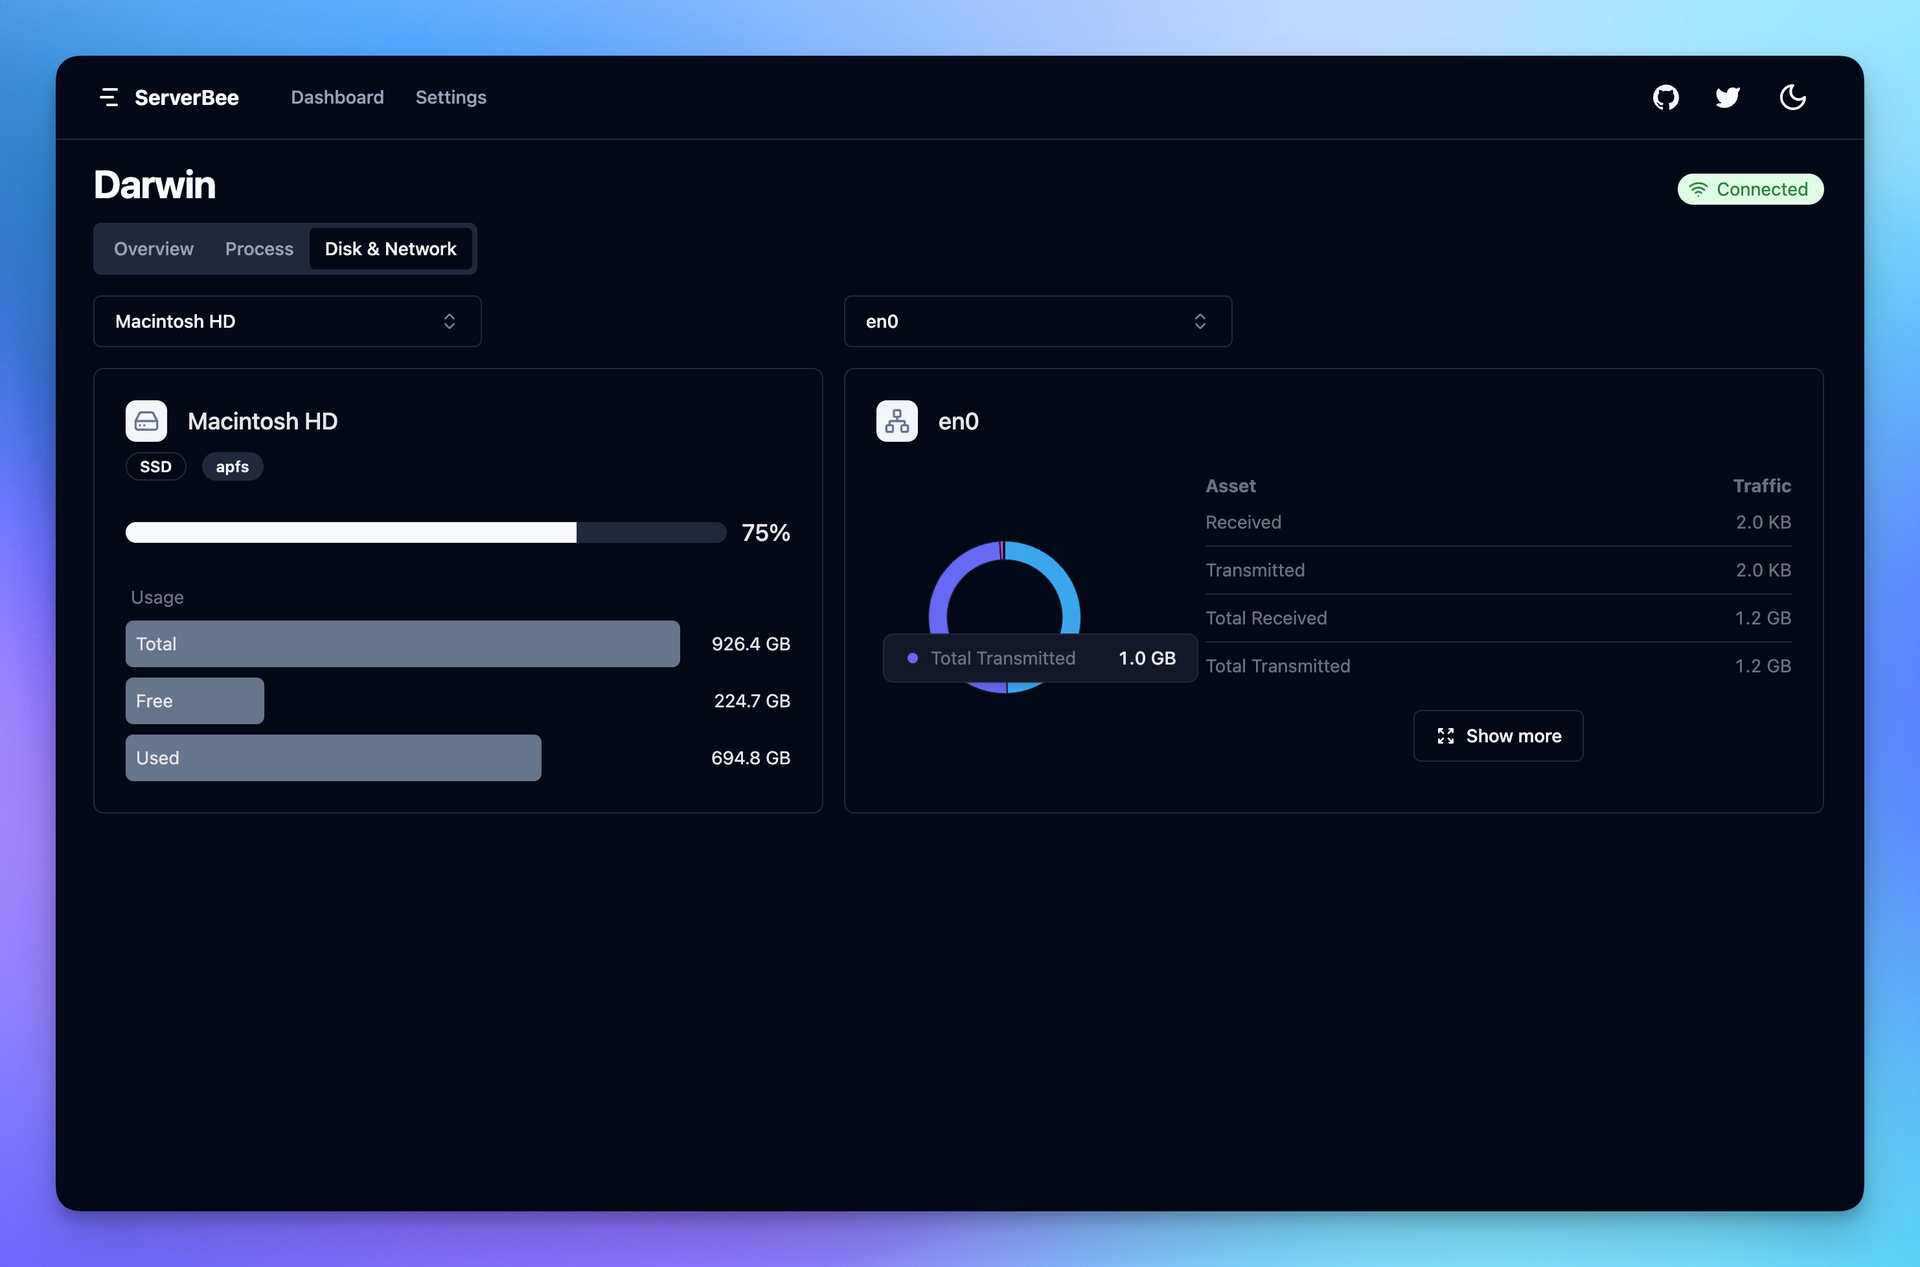
ServerBee delivers complete fleet monitoring from a single Rust binary that embeds both the server and web UI, requiring no external database or heavy runtime. Lightweight agents installed on each node stream CPU, memory, disk, network, load, temperature, GPU, and disk I/O metrics over persistent WebSocket connections to a central server backed by embedded SQLite. The real-time React dashboard presents 17 drag-and-drop widget types across custom layouts, with historical charts spanning one hour to 30 days and monthly traffic statistics with billing-cycle prediction and cost insights including burn rate and per-resource unit cost scoring. Network monitoring covers ICMP, TCP, and HTTP ping probes, service monitors for SSL certificates, DNS records, HTTP keyword matching, TCP ports, and WHOIS expiration, plus network-quality probing across 96 China 3-ISP and international presets with IP-quality and streaming-unlock detection. Remote management features include a web terminal with sandboxed file manager, Docker container stats with logs and events, firewall configuration, and agent auto-update capabilities. Public status pages display 90-day uptime timelines, while alerting supports email and webhook notifications with flexible trigger expressions. A native iOS companion app provides mobile monitoring access. Deploy via Docker or download the single binary for Linux, macOS, or Windows, running on a dedicated VPS on RepoCloud with guaranteed CPU, RAM, and SSD, full root SSH access, and a browser serial console. AGPL-3.0 licensed.
Benefits
- Single Binary, Zero Dependencies
- The entire server and embedded web UI ship as one Rust binary with SQLite storage built in. No external databases, no heavy runtimes, no complex dependency chains to maintain or upgrade.
- Real-Time Metrics via WebSocket
- Lightweight agents stream CPU, memory, disk, network, GPU, temperature, and I/O data over persistent WebSocket connections, providing instant visibility with sub-second dashboard updates across your fleet.
- Drag-and-Drop Custom Dashboards
- Build personalized monitoring views with 17 widget types including metric cards, charts, network latency, and module widgets. Custom OKLCH themes adapt the interface to your preferences.
- Built-In Remote Management
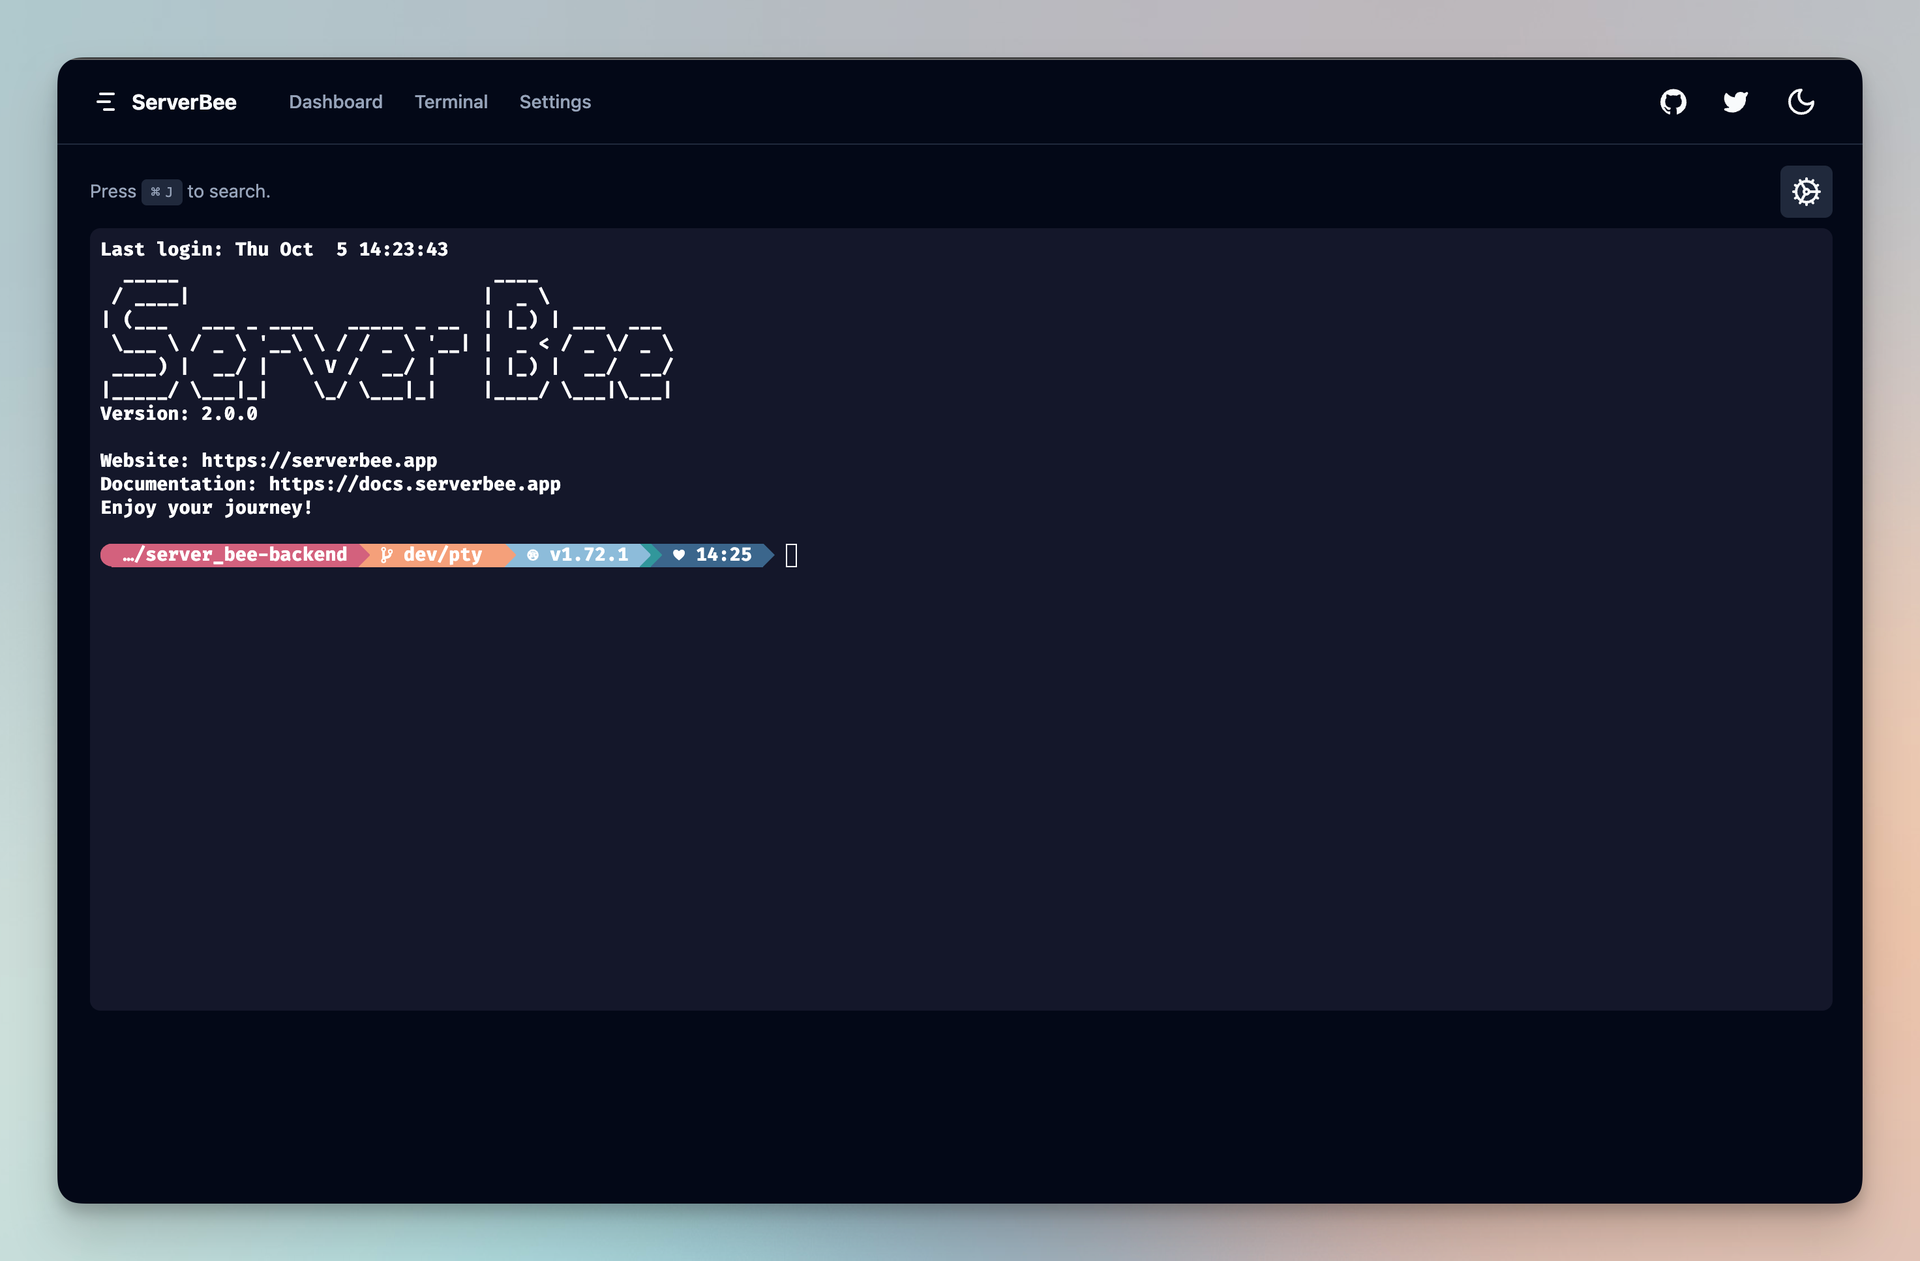
- Access web terminals, manage files through a sandboxed browser interface, control Docker containers with log streaming, configure firewalls, and trigger agent auto-updates without leaving the dashboard.
Features
- Fleet-Wide Server Monitoring
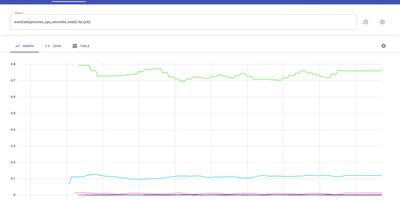
- Collects CPU, memory, disk, network, load, temperature, GPU, and disk I/O from every agent with historical charts from one hour to 30 days and monthly traffic billing predictions.
- Service and Network Monitors
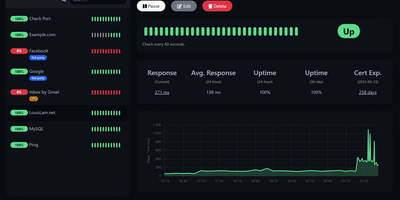
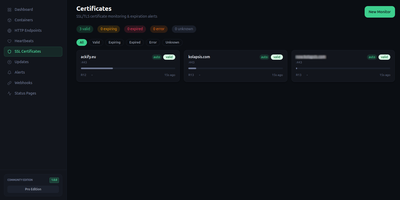
- Probes SSL certificates, DNS records, HTTP endpoints, TCP ports, and WHOIS expiration with ICMP/TCP/HTTP ping monitoring and network-quality testing across international presets.
- Public Status Pages
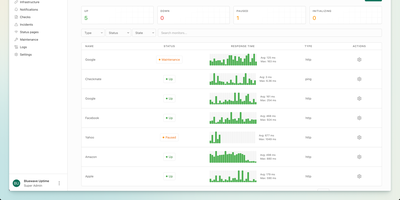
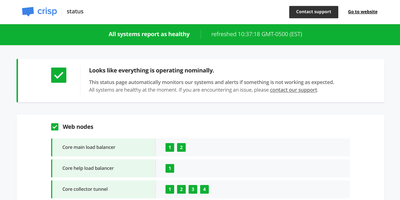
- Generates public-facing status pages with 90-day uptime timelines, server health indicators, and curated metric views with field redaction for external stakeholders.
- Docker Container Management
- Monitors container stats, streams logs and events, and provides control actions directly from the dashboard without SSH access or separate Docker management tools.
- Custom Widget System
- Extends dashboards with installable widget modules using the widget SDK. Upload JavaScript or ZIP bundles to add custom visualizations and data sources to any layout.