Categories
DevOps Monitoring Infrastructure Observability Dashboard Homelab Server Management Uptime MonitoringStars
Forks
Watchers
Developer links
Komari
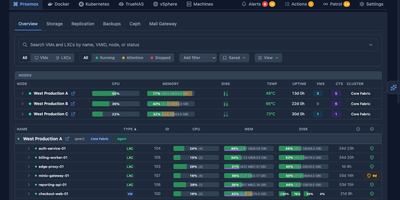
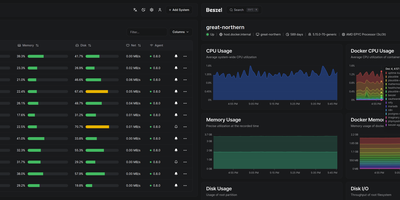
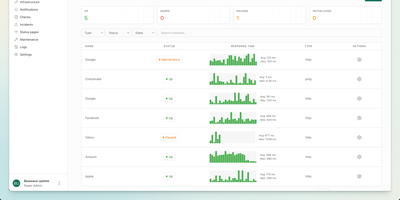
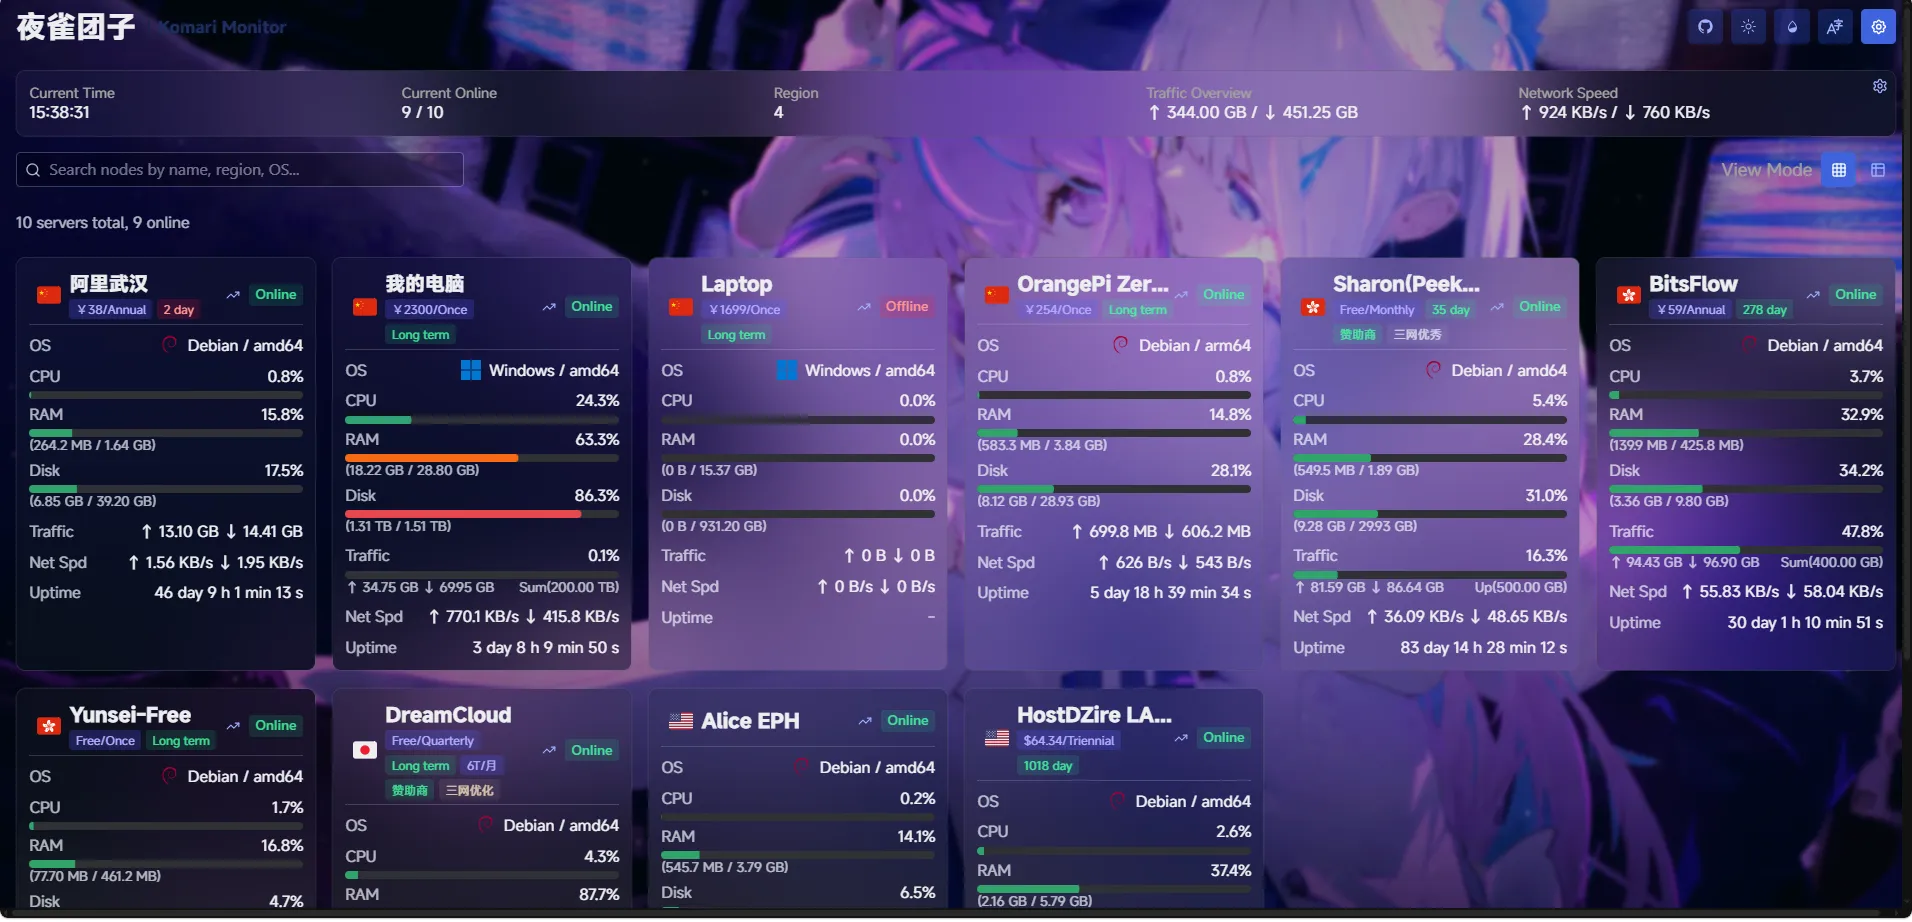
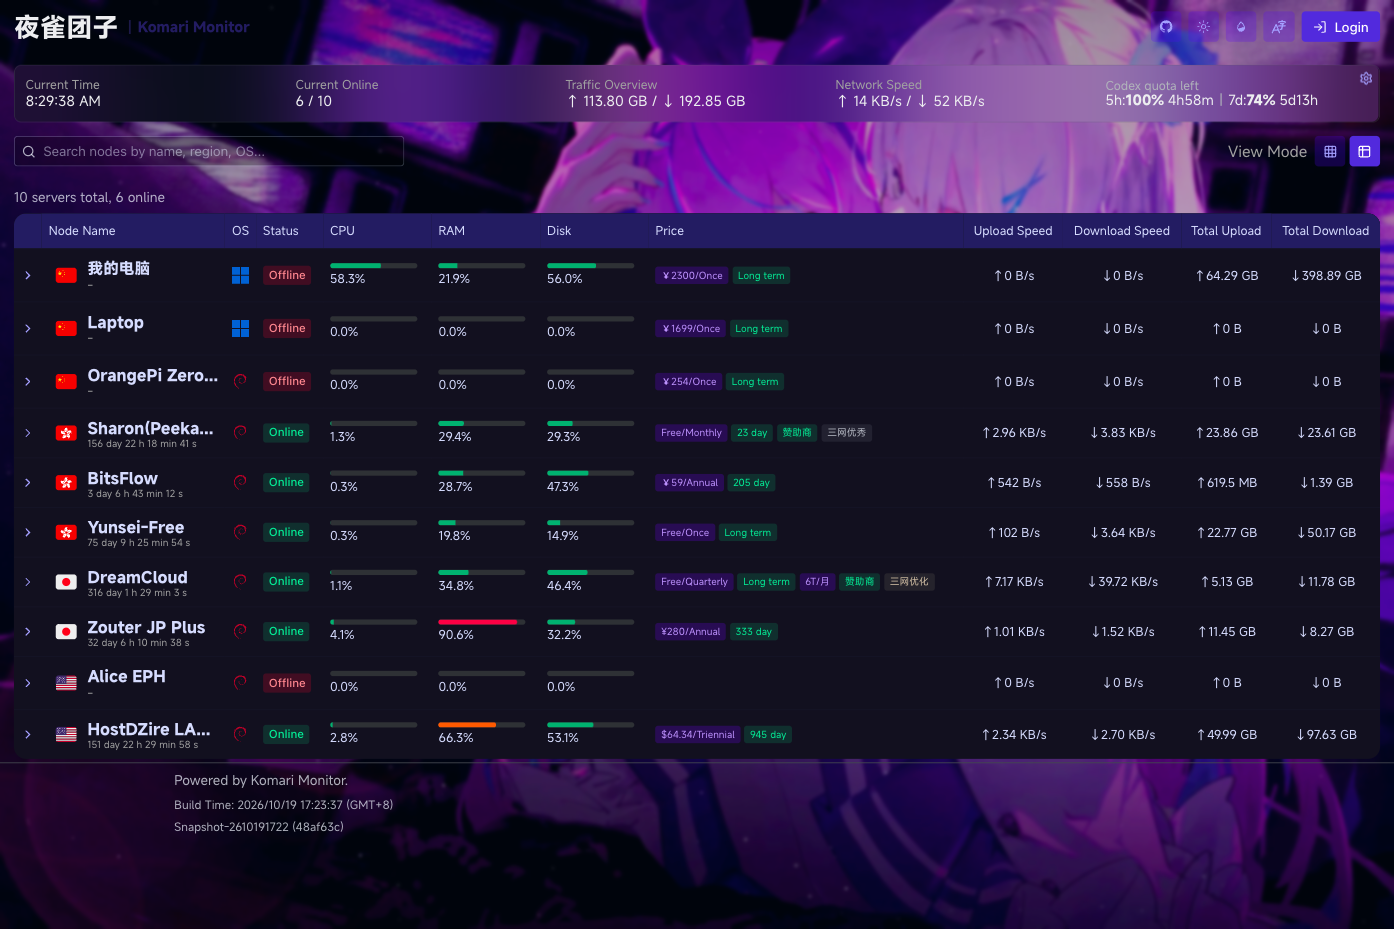
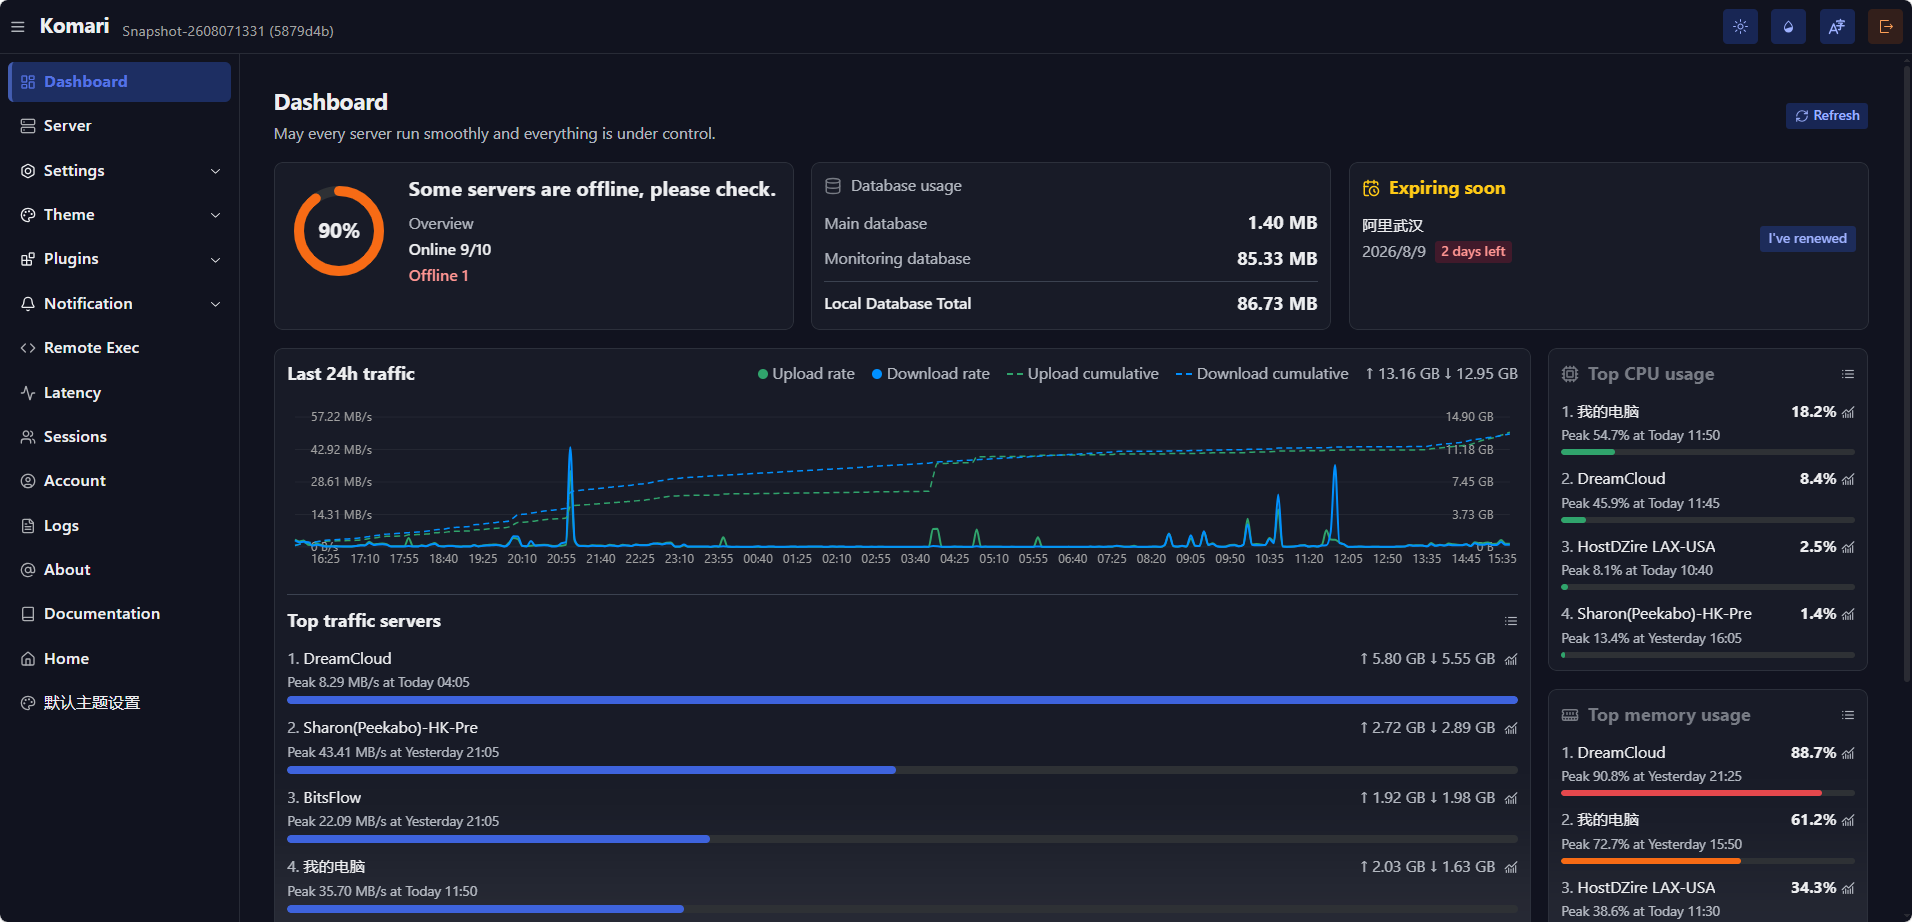
Komari turns a scattered fleet of VPS boxes into one clean status wall that shows which servers are alive, struggling, or about to expire. Every node reports CPU, GPU, memory, swap, disk, load, network speed, traffic totals, and uptime to a real-time dashboard, with history views from ten minutes to thirty days or any custom range. Flip between a card grid and a table, search by name, region, or operating system, and tag each machine with its price, billing cycle, and days until renewal. Latency tasks send ICMP, TCP, or HTTP probes and plot the results in per-node charts. Offline alerts wait out a per-node grace period before firing, expiry reminders warn before a plan lapses, and Webhook and custom JavaScript channels deliver them. A multi-tab browser terminal that reattaches after disconnects, remote command execution, and a remote file manager with an editor let you fix problems without leaving the panel. Agents install with a script, a binary, Docker, or an auto-discovery key for batch rollouts, and administrators can switch an agent's version remotely. Plugins run on an embedded JavaScript runtime and can add scheduled jobs, HTTP hooks, static pages, and notification channels. Administrators can add two-factor authentication, OAuth sign-in, API keys for a JSON-RPC 2.0 endpoint, themes from a theme market, and backups. Running on a dedicated VPS on RepoCloud with guaranteed CPU, RAM, and SSD, full root SSH access, and a browser serial console. MIT licensed.
Benefits
- Watch every server in one place
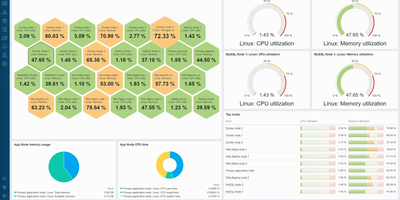
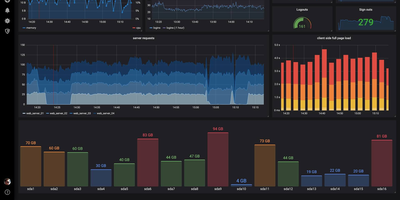
- A single dashboard shows CPU, memory, disk, network speed, traffic totals, and uptime for every connected node, in a card grid or table view with search by name, region, or operating system.
- Know when servers drop offline
- Offline alerts fire only after a per-node grace period, so brief reconnects stay quiet, and expiry reminders warn before a plan lapses, delivered through Webhook, custom JavaScript, or plugin-registered channels.
- Measure network latency from each node
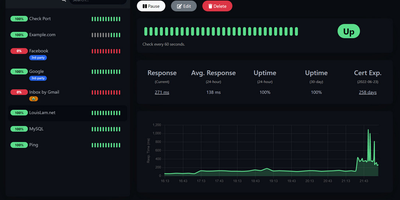
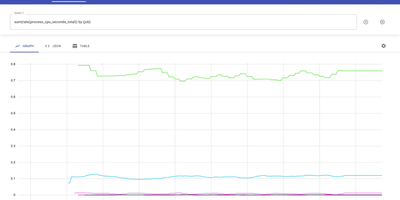
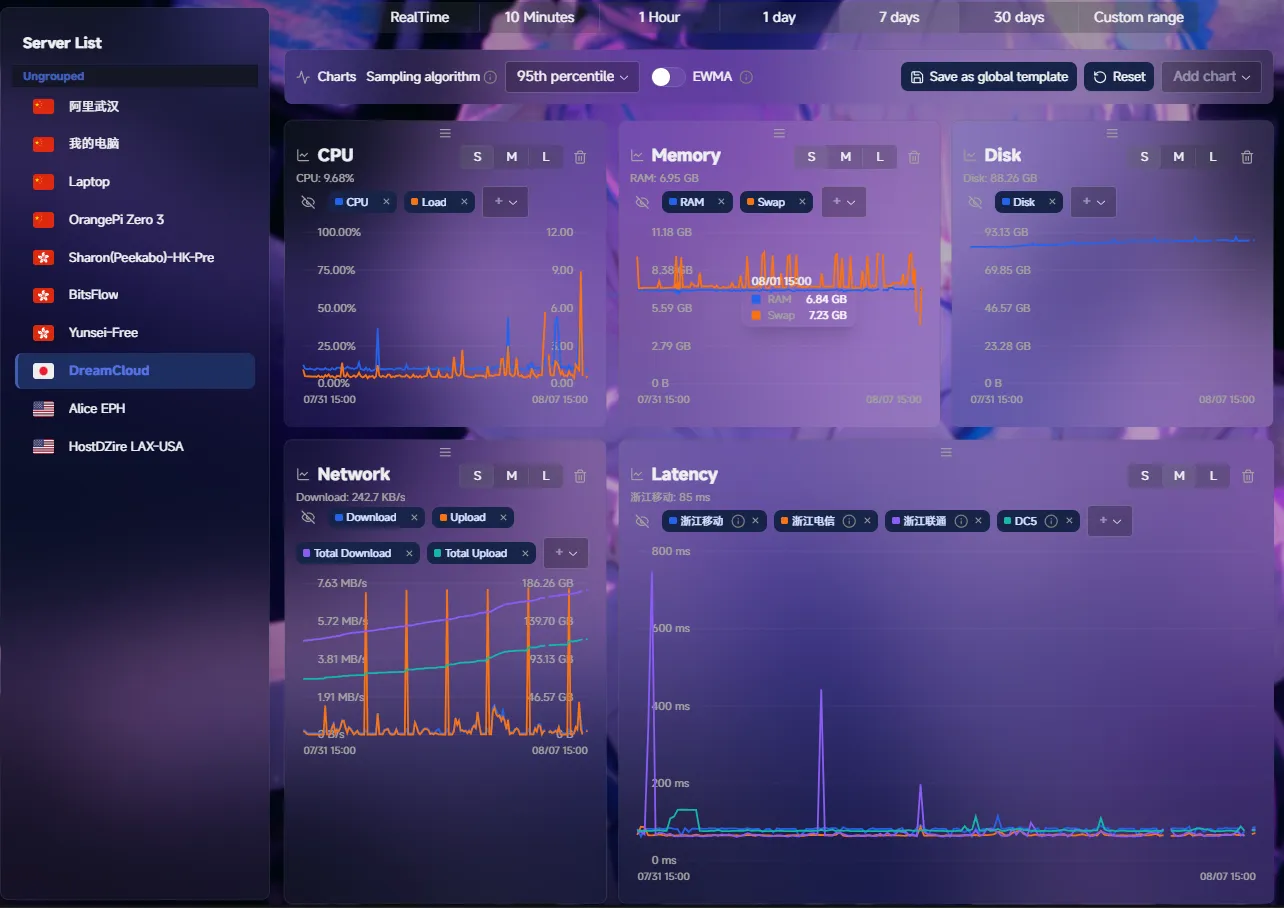
- Scheduled ICMP, TCP, and HTTP ping tasks run on your agents and chart round-trip times per node, so route quality and provider outages show up as lines on a graph.
- Control servers from the browser
- A multi-tab terminal, remote command execution, and a file manager with an editor reach any connected node from the admin panel, while TOTP two-factor authentication and OAuth sign-in protect administrator access.
Features
- Real-Time Agent Metrics
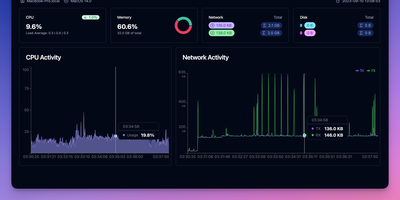
- Agents stream CPU, GPU, memory, swap, disk, load, and network counters to the server in real time, alongside hardware details such as CPU model, kernel version, virtualization, and OS.
- Configurable Chart Dashboards
- Resizable S, M, and L chart cards for CPU, memory, disk, network, and latency support average or percentile sampling, EWMA smoothing, and custom time ranges.
- Pluggable Notification Channels
- Offline and expiry alerts go out through built-in Webhook and JavaScript channels, while plugins register extra channels with server.registerNotificationChannel and the per-node grace period filters flapping connections.
- Themes and Plugins
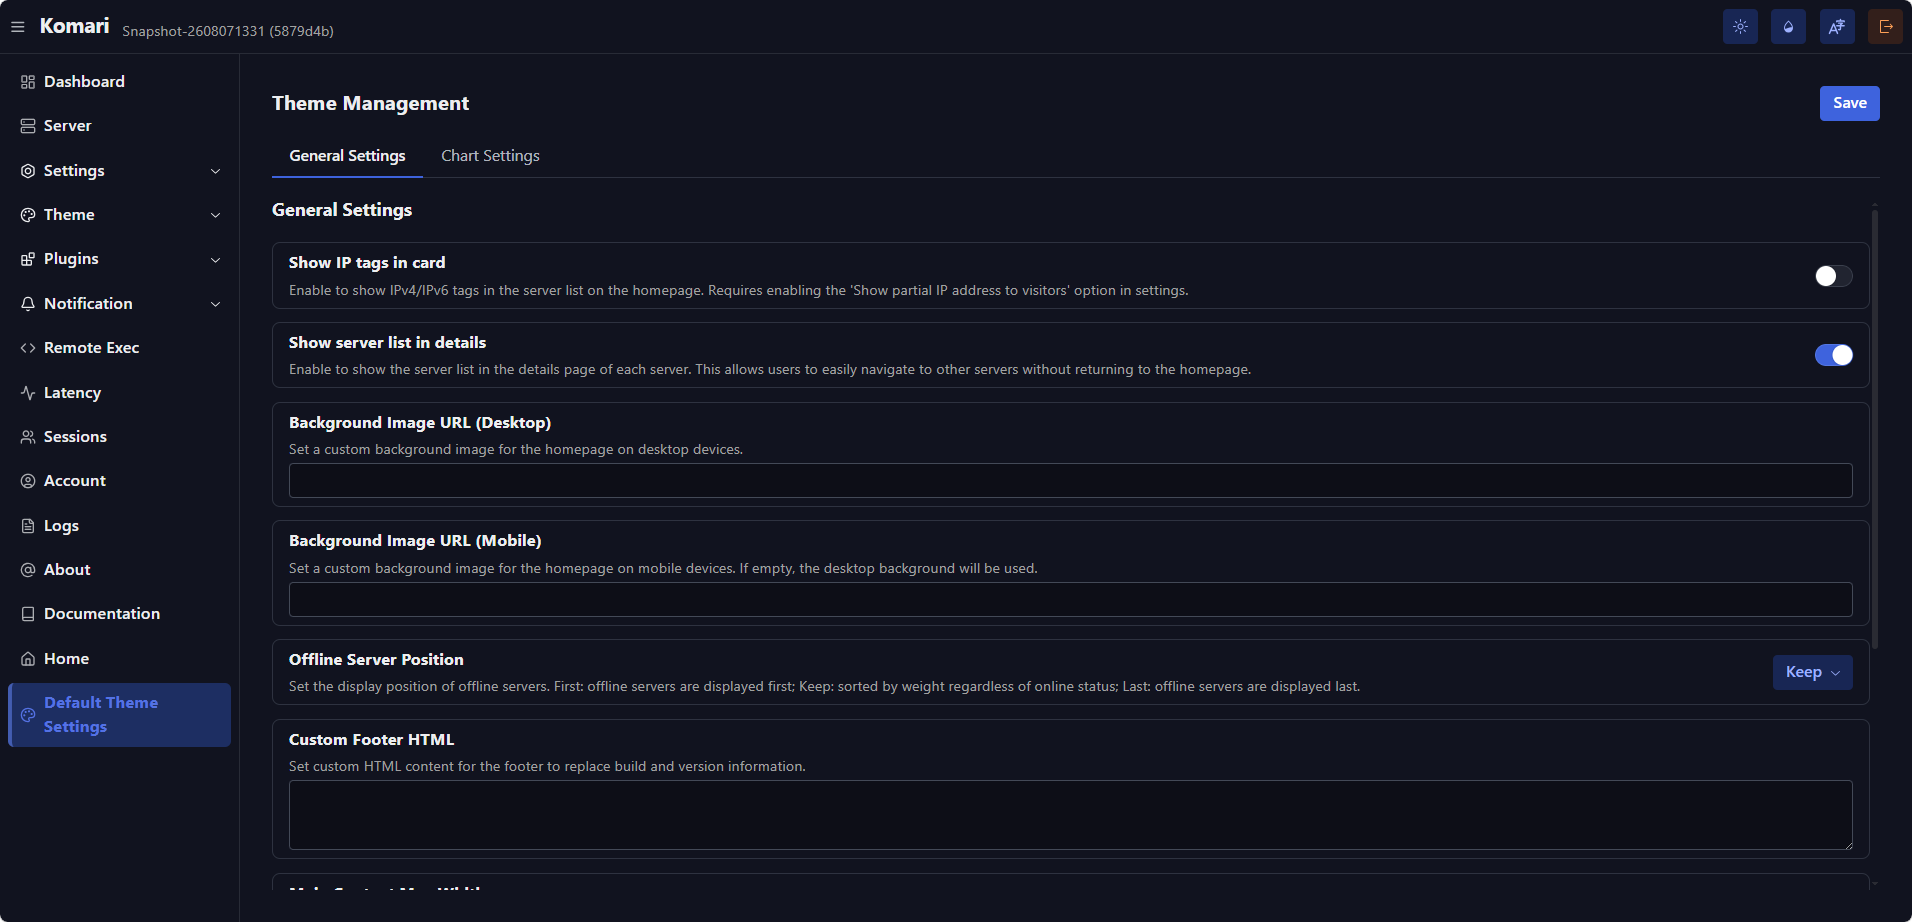
- Plugins use an embedded JavaScript runtime with cron jobs, HTTP and WebSocket hooks, static folders, and HTML injection, while a theme market swaps the public dashboard for alternative designs.
- Flexible Agent Deployment
- Agents install from a script, a standalone binary, Docker, or an auto-discovery key that enrolls many servers at once, while the panel runs from Docker or a systemd script.
- Billing and Expiry Tracking
- Each node can carry a price, billing cycle, currency, expiry date, and tags, and an Expiring soon card with an I've renewed button keeps renewals visible.