Stars
Forks
Watchers
Developer links
Gatus
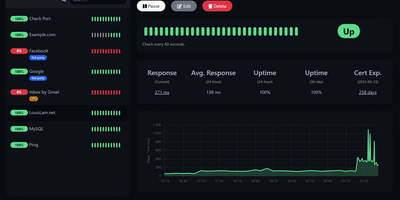
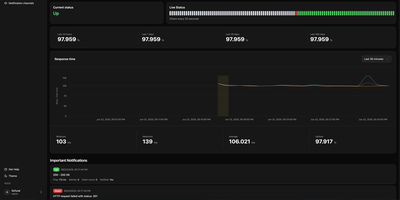
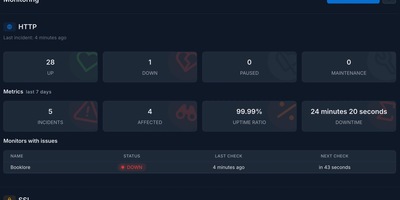
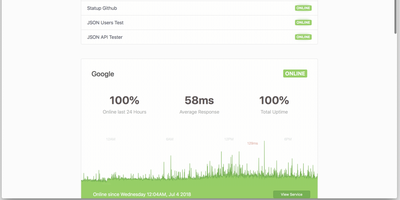
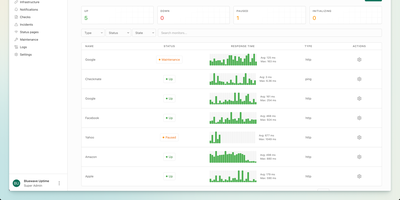
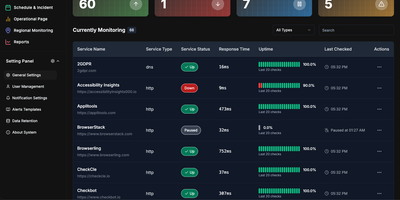
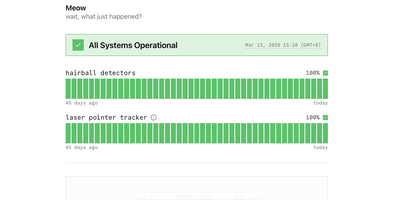
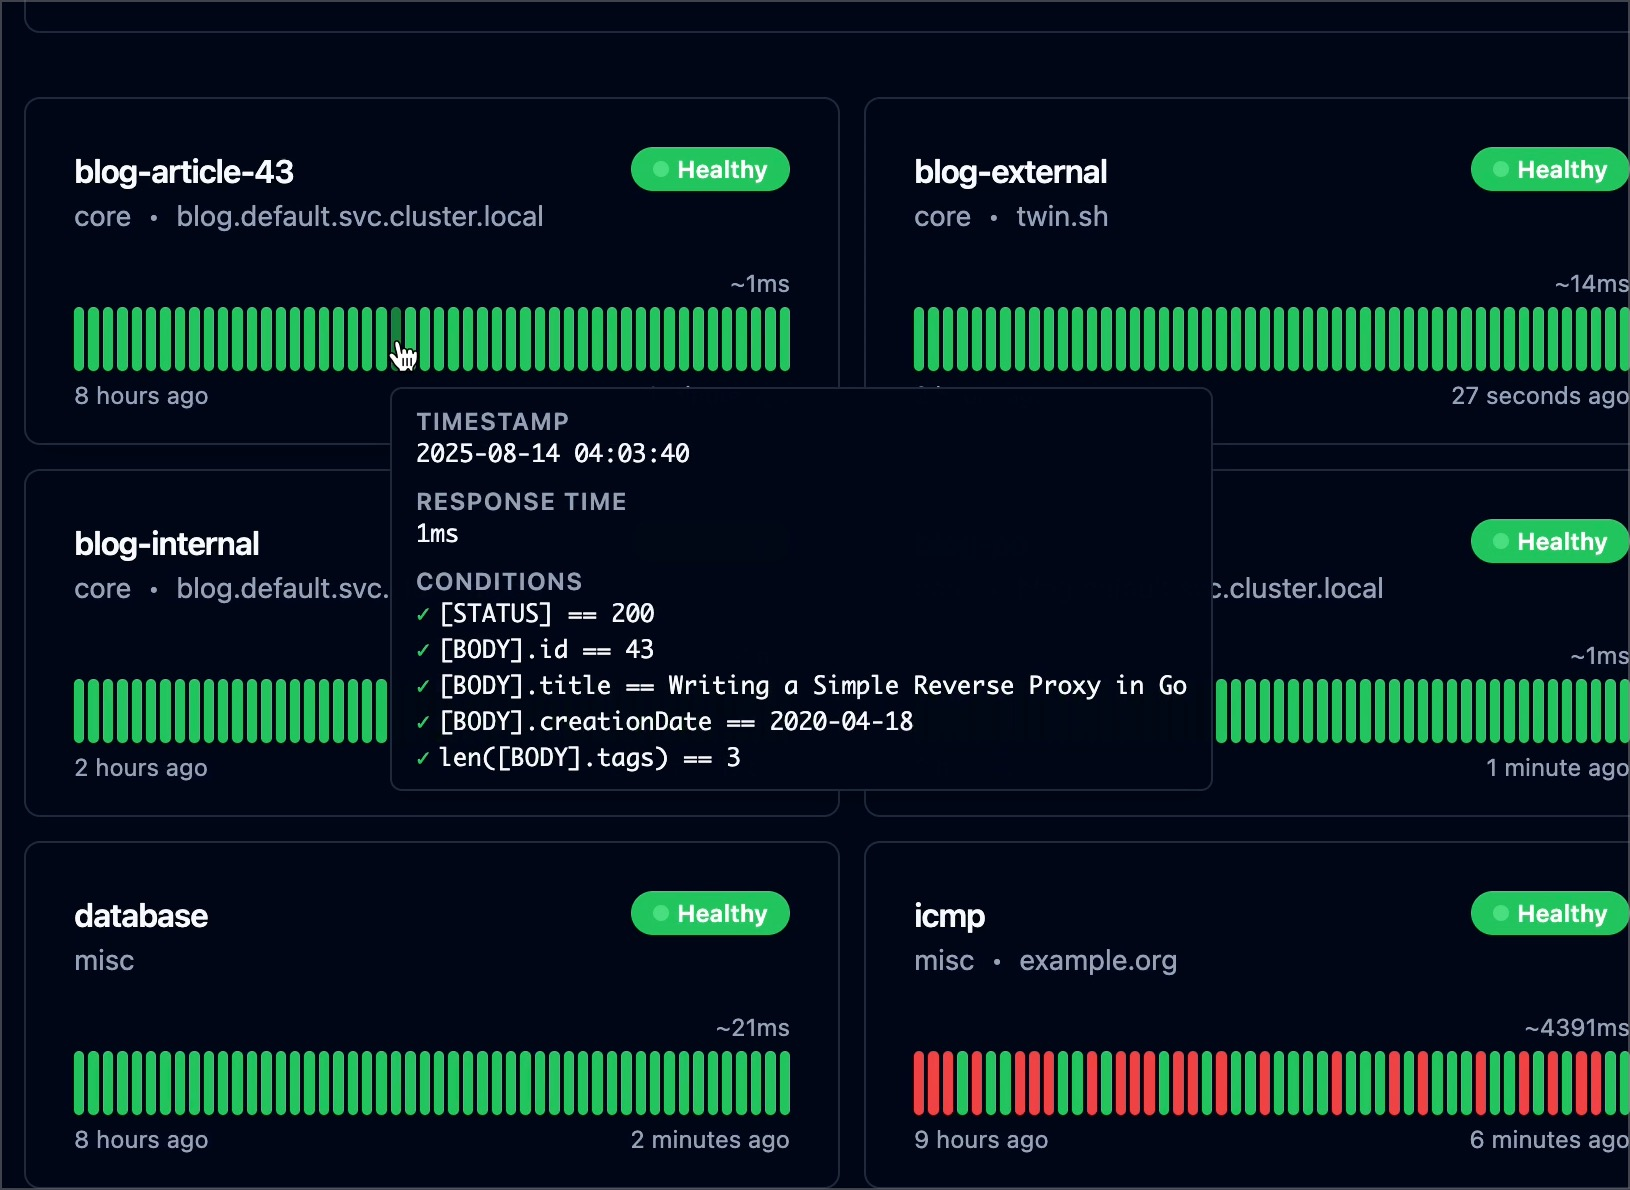
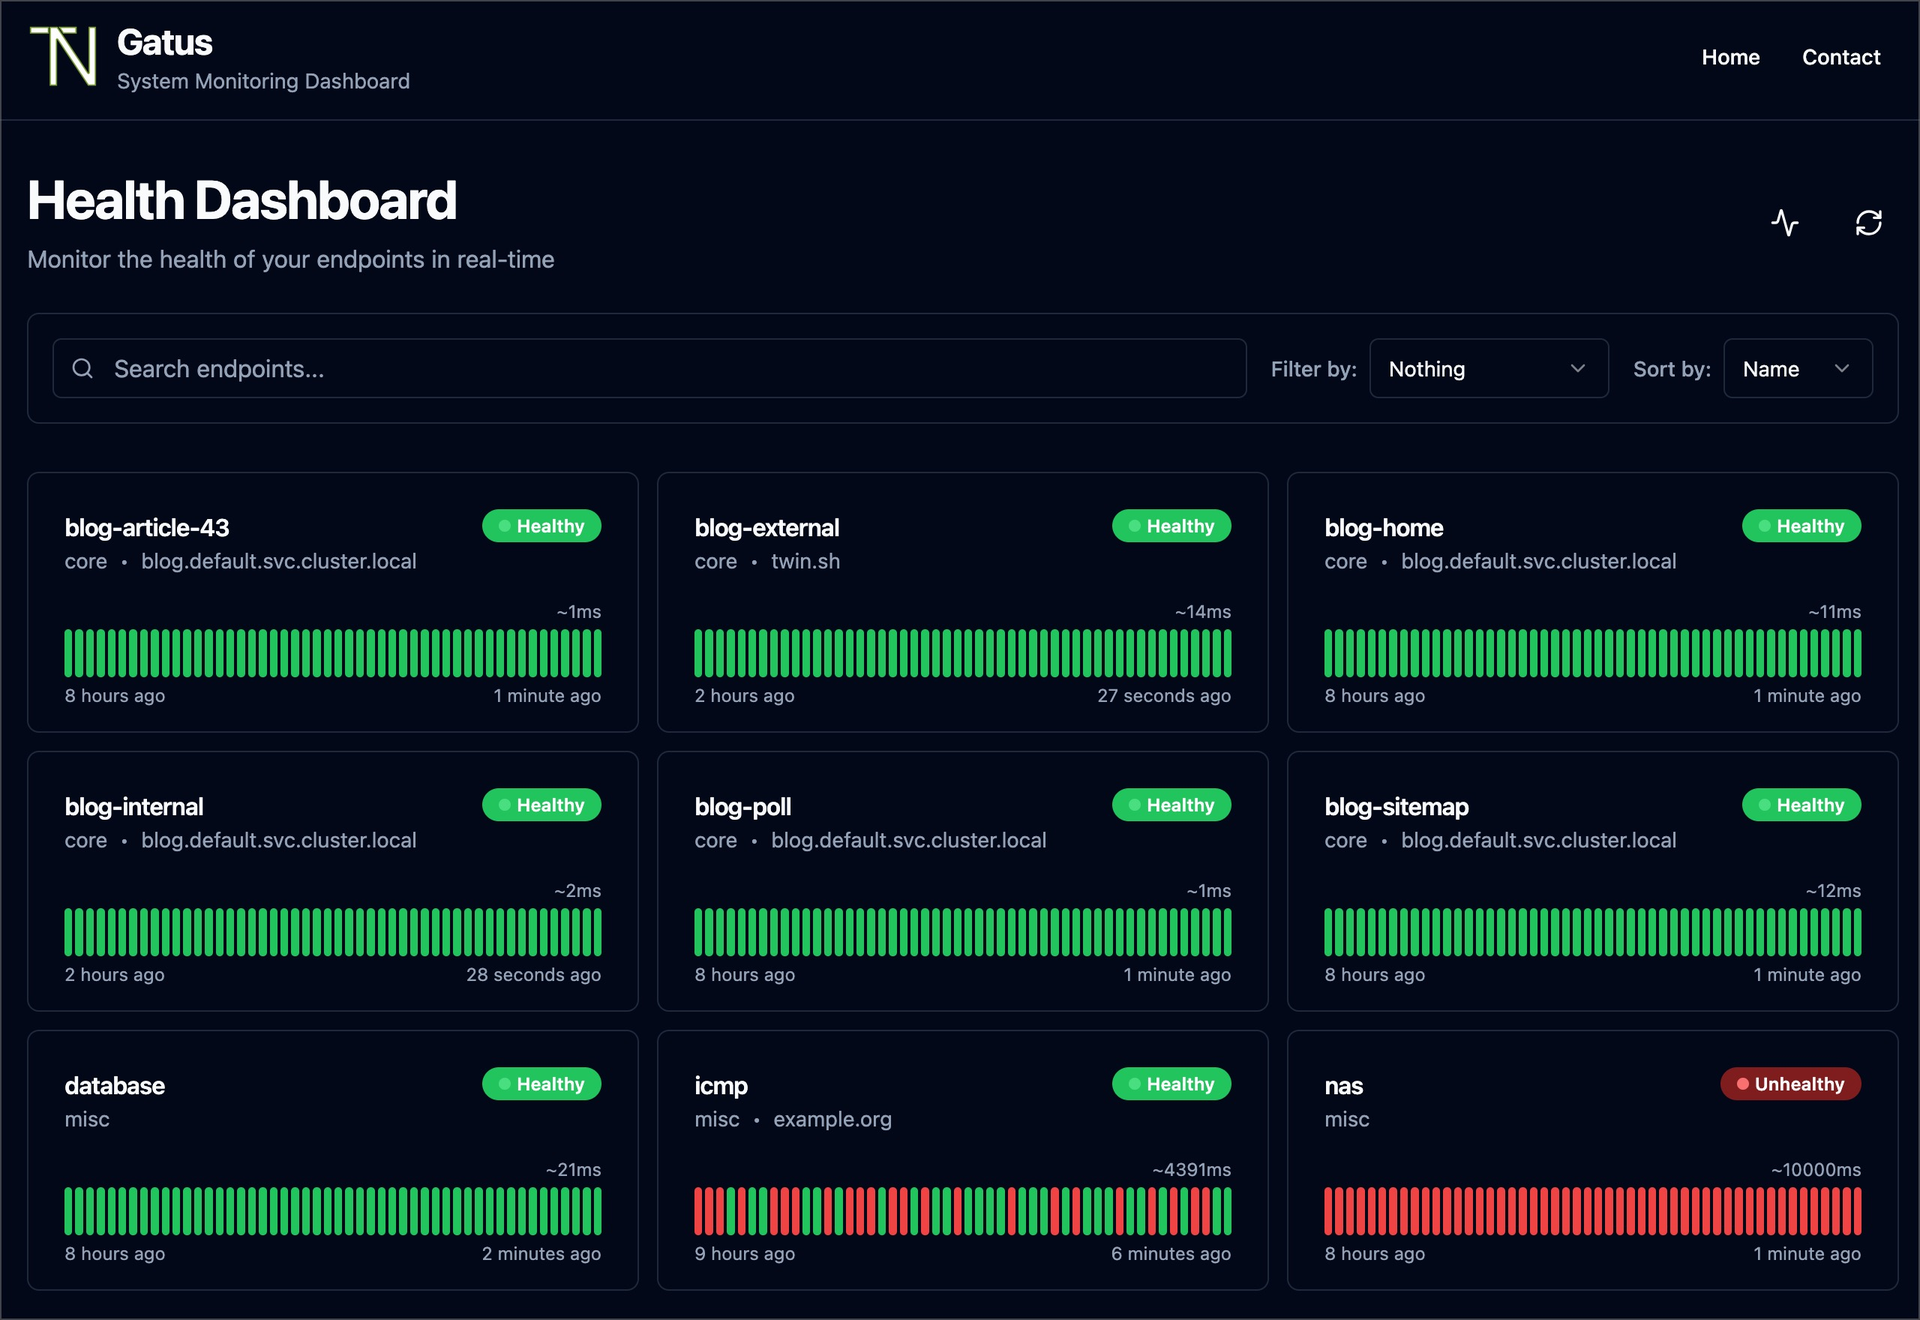
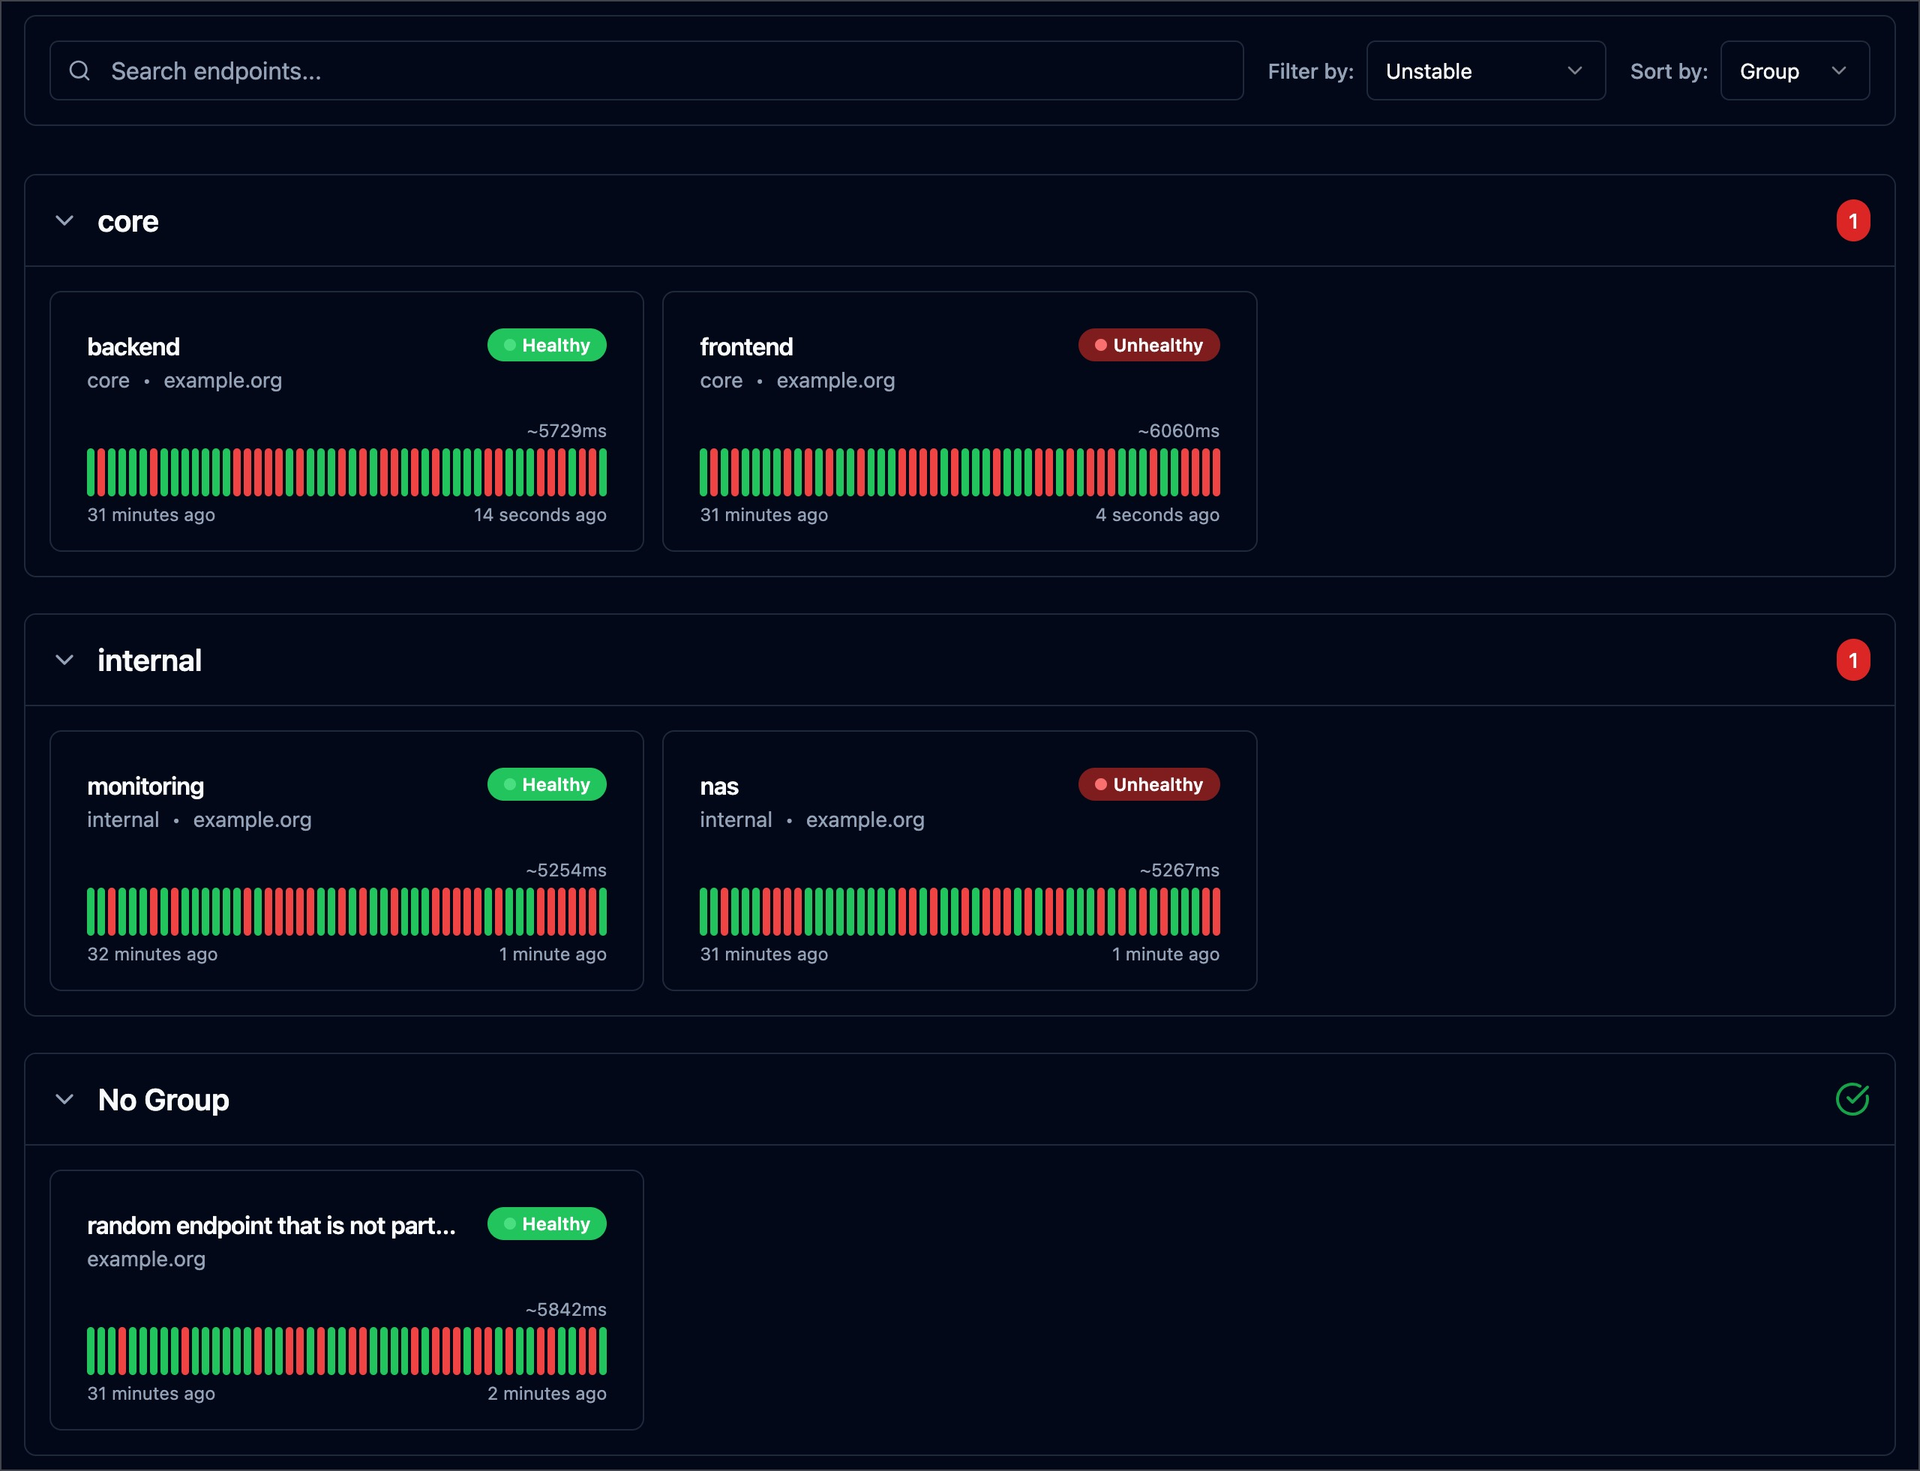
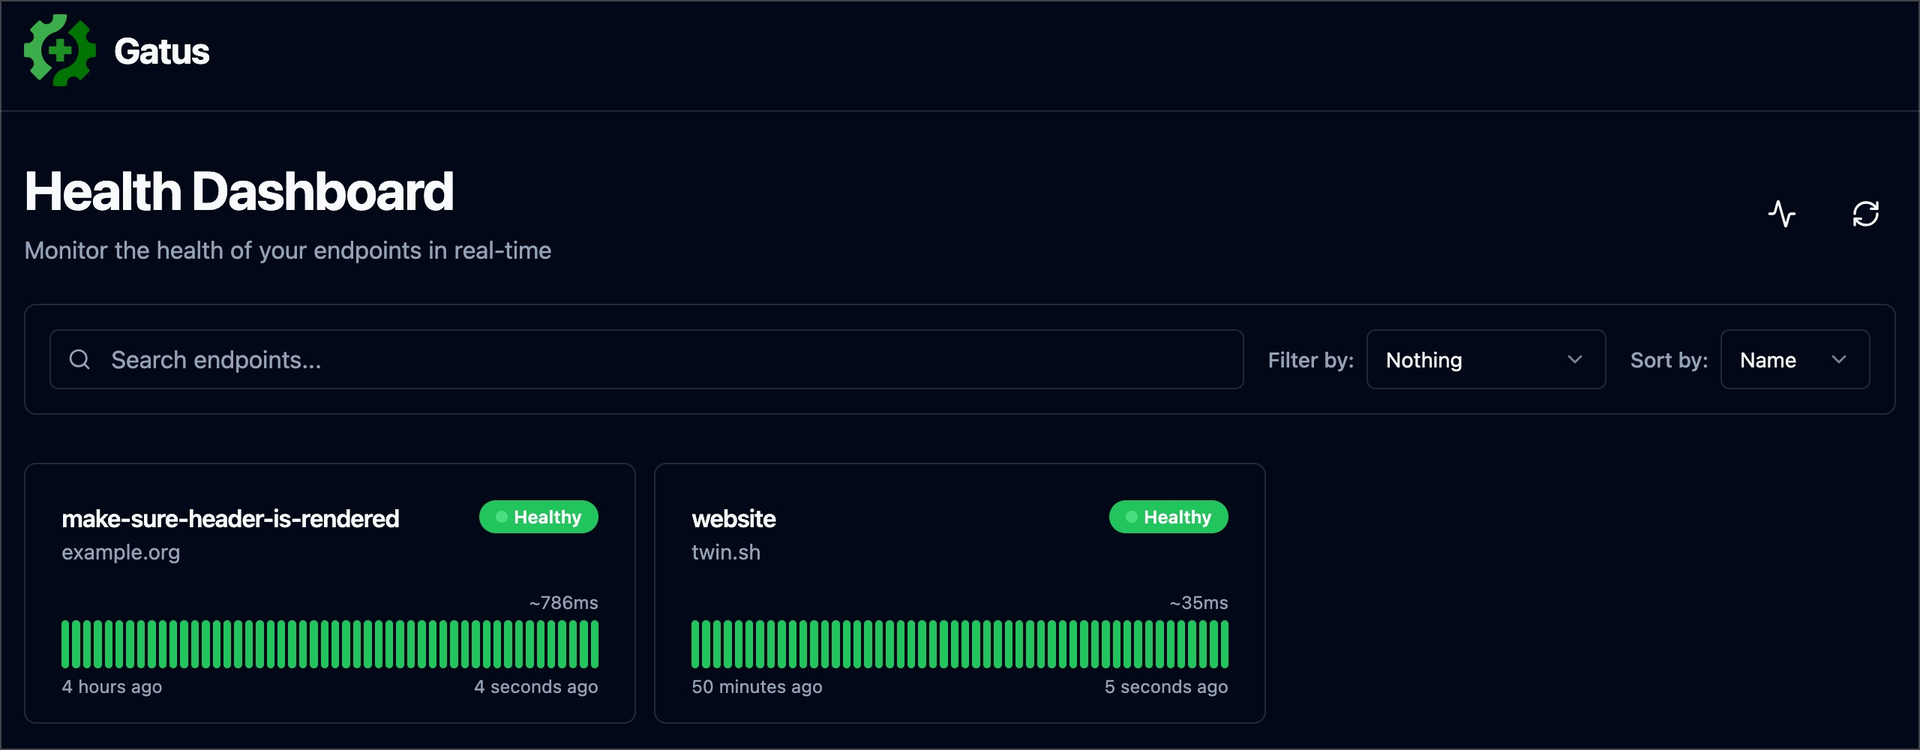
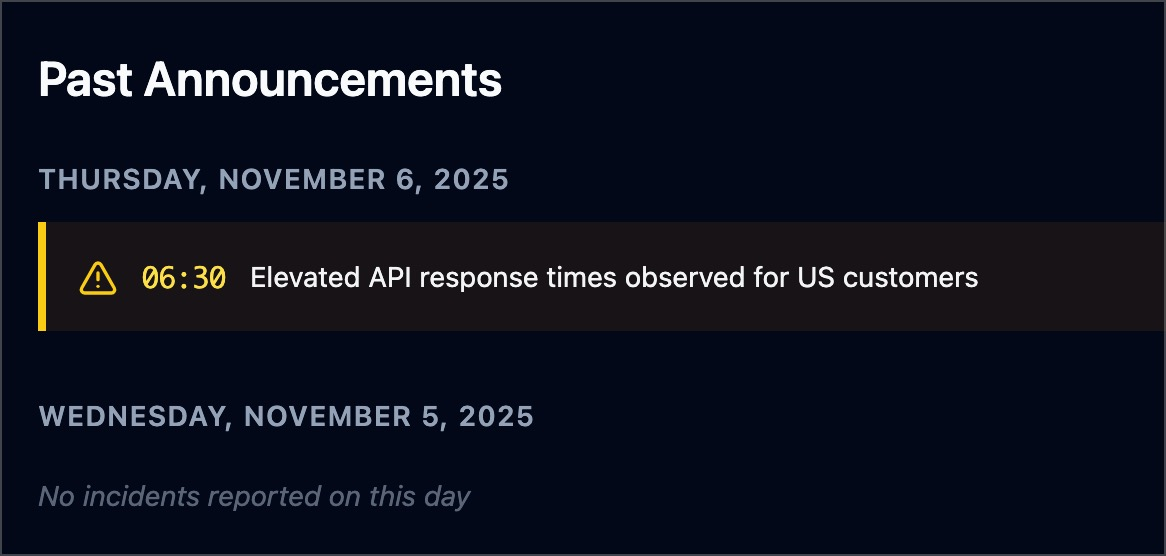
With 11,400+ GitHub stars and active development since 2019, Gatus is the developer-oriented status page and health monitoring tool that ships as a single statically-linked Go binary in a scratch Docker image under 20 MB — deploying in seconds while monitoring your entire infrastructure across 12 protocols from a single YAML configuration file. Define health checks for HTTP, ICMP, TCP, DNS, gRPC, WebSocket, SSH, UDP, SCTP, STARTTLS, and TLS endpoints with conditions that go far beyond simple ping: evaluate response status codes, body content with JSONPath expressions, response time thresholds, certificate expiration days, DNS record values, and IP address ranges. Each endpoint supports independent alerting through Slack, Microsoft Teams, PagerDuty, Discord, Telegram, Twilio, Mattermost, Google Chat, email, Gotify, Pushover, and custom webhook providers with configurable failure thresholds and descriptions. The built-in status page displays uptime badges, response time graphs, and incident timelines with maintenance window support for planned downtime communication. External endpoints accept push-based health reports from services behind firewalls. Prometheus metrics export via the /metrics endpoint enables integration with existing observability stacks. OIDC and Basic Authentication protect the dashboard. PostgreSQL persistence stores historical uptime data. The official Helm chart supports Kubernetes deployment with liveness probes and PVC storage, while a community sidecar auto-generates endpoint configurations from Kubernetes Ingress and HTTPRoute resources. Running on a dedicated VPS on RepoCloud with guaranteed CPU, RAM, and SSD, full root SSH access, and a browser serial console. Apache 2.0 licensed.
Benefits
- Twelve Protocol Health Checks
- Monitor HTTP, ICMP, TCP, DNS, gRPC, WebSocket, SSH, UDP, SCTP, STARTTLS, and TLS endpoints from a single configuration file with independent intervals and conditions per endpoint.
- Condition Based Smart Monitoring
- Evaluate response status codes, body content via JSONPath, response time thresholds, certificate expiration, DNS records, and IP ranges. Detect application-level failures beyond simple uptime.
- Multi Provider Alert Notifications
- Alert via Slack, PagerDuty, Discord, Telegram, Teams, Twilio, email, Gotify, Pushover, and custom webhooks. Configure independent alert thresholds and descriptions per endpoint.
- Twenty Megabyte Docker Deployment
- Statically compiled Go binary in a scratch Docker image under 20 MB. No OS dependencies, near-zero CVE surface, minimal resource consumption at approximately 512 MB RAM.
Features
- Built In Status Page
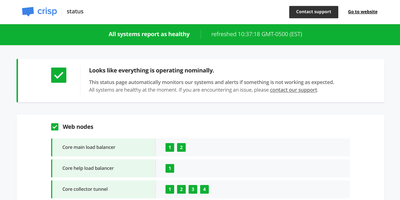
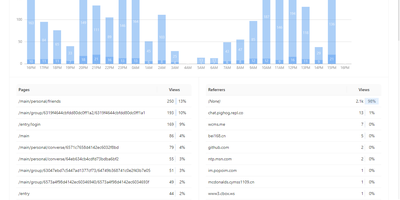
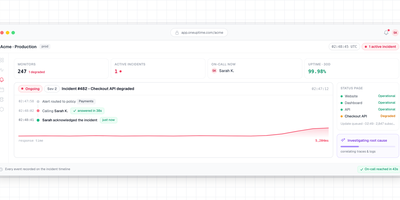
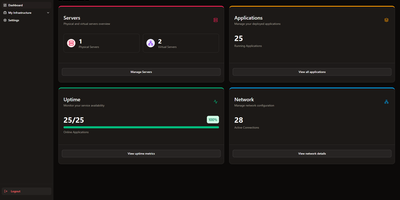
- Public-facing status dashboard with uptime percentages, response time graphs, and incident timelines. Embeddable SVG badges for uptime and response time monitoring.
- YAML Configuration as Code
- Entire monitoring setup defined in YAML files committable to Git. Dynamic configuration reloading without restart enables GitOps workflows with version-controlled monitoring.
- Prometheus Metrics Export
- Native /metrics endpoint exposes endpoint health, response times, and certificate expiration in Prometheus format for integration with Grafana dashboards and alerting rules.
- Kubernetes Native Deployment
- Official Helm chart with liveness probes, PVC persistence, and security contexts. Community sidecar auto-generates configurations from Kubernetes Ingress and HTTPRoute resources.
- Maintenance Windows
- Schedule planned downtime windows with custom announcements displayed on the status page. Suppress alerts during maintenance to prevent false positive notifications.
- OIDC Authentication
- Protect the dashboard with OpenID Connect single sign-on or Basic Authentication. Control access to the status page and API endpoints with configurable security policies.