Parseable
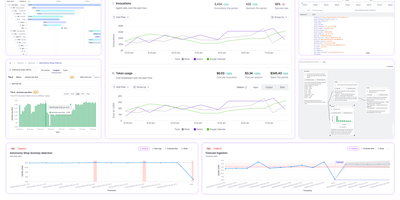
Parseable replaces expensive Elasticsearch clusters and fragmented monitoring stacks with a single Rust binary that ingests, queries, and stores logs, metrics, and traces on commodity object storage at a fraction of the cost. The data lake architecture decouples stateless compute from S3-compatible storage, enabling independent scaling of ingestion throughput and query capacity while cutting storage costs by up to 90% compared to indexed alternatives. OpenTelemetry-native OTLP ingestion accepts telemetry from existing OTel collector pipelines, Prometheus Remote Write endpoints, Kafka consumers, eBPF probes, and popular logging agents including Fluentd, Fluent Bit, and Vector without proprietary format conversions. The SQL-first query interface enables cross-signal analysis across all telemetry types, while native PromQL support with 50+ functions and 12 aggregation operators provides Prometheus-compatible metrics querying that works directly with Grafana dashboards. Built-in features include customizable dashboards, real-time alerting with Webhook, Slack, and Alertmanager targets, role-based access control, OpenID single sign-on integration, LogIQ automatic unstructured-to-structured log transformation, smart caching for frequently accessed data, and retention policies for lifecycle management. AI-powered Keystone Q&A provides natural language to SQL conversion and dataset summarization. All data stored as standard Apache Parquet on object storage remains accessible to any Parquet-compatible engine (DuckDB, Spark, Trino), ensuring zero vendor lock-in. Deploys on AWS S3, Azure Blob, Google Cloud Storage, MinIO, Wasabi, and DigitalOcean Spaces. Running on a dedicated VPS on RepoCloud with guaranteed CPU, RAM, and SSD, full root SSH access, and a browser serial console. Apache 2.0 licensed.
Netdata
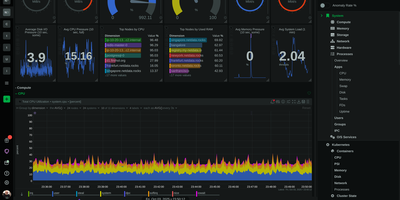
Trusted by millions of engineers and deployed on over 80,000 GitHub stars worth of community confidence, Netdata delivers true real-time monitoring at per-second granularity — 10-60x faster than Prometheus, Datadog, or any conventional monitoring stack that averages away the transient anomalies lasting 2-10 seconds where most production incidents originate. A single installation command deploys the agent with zero configuration, automatically discovering every running process, container, systemd service, network connection, disk, and application on the host within seconds. Unsupervised machine learning trains multiple models per metric directly at the edge, detecting anomalies without thresholds, baselines, or manual tuning. The distributed Parent-Child architecture scales horizontally from a single Raspberry Pi to fleets exceeding 100,000 nodes while maintaining sub-2-second visualization latency and storing metrics at approximately 0.5 bytes per sample through tiered compression. Native network monitoring provides live topology maps, NetFlow and sFlow analytics, SNMP device polling across 200+ profiles, and trap handling — capabilities that typically require a separate NPM product. Hundreds of pre-configured alerts cover systems and applications out of the box, with AI-powered root cause analysis surfacing correlated metrics through natural language via MCP-compatible AI assistants. The agent supports Linux, macOS, FreeBSD, Kubernetes, and Docker with eBPF-based kernel observability requiring no application instrumentation. Running on a dedicated VPS on RepoCloud with guaranteed CPU, RAM, and SSD, full root SSH access, and a browser serial console. GPL v3+ licensed.
Databasus
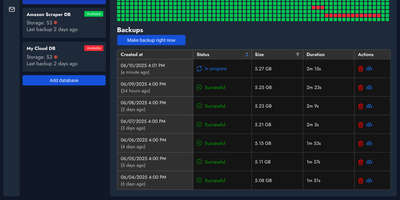
With over 7,500 GitHub stars and 1 million Docker pulls — making it the most popular open-source database backup tool on GitHub ahead of pgBackRest and WAL-G — Databasus delivers production-grade backup management through a designer-polished web interface that replaces complex configuration files and CLI-only workflows. The platform supports PostgreSQL 14-18, MySQL 5.7-8, MariaDB 10-12, and MongoDB 4.2-8 with logical backups via pg_dump and mysqldump, while PostgreSQL 17+ enables physical backups using the native pg_basebackup engine with block-level incremental support via pg_basebackup --incremental and continuous WAL streaming via pg_receivewal for Point-in-Time Recovery to any second between backups. Storage destinations include local disk, AWS S3, CloudFlare R2, Google Drive, Azure Blob Storage, SFTP, NAS, and rclone-backed targets, while built-in AES-256-GCM encryption secures both backup files and stored credentials. Restore verification runs automated recovery into throwaway Docker containers, validating backups by comparing schema counts, table structure, and row counts against the source database — proving recoverability rather than merely checking checksums. The notification system integrates with Slack, Discord, Telegram, email, and webhooks for real-time backup status alerts. Deployment options span a single Docker container, Docker Compose with Caddy for automatic HTTPS, Helm charts for Kubernetes clusters, or a one-line install script. SSH tunnel support reaches databases in closed networks through bastion hosts without public exposure. Running on a dedicated VPS on RepoCloud with guaranteed CPU, RAM, and SSD, full root SSH access, and a browser serial console. Apache 2.0 licensed.
Ever Teams
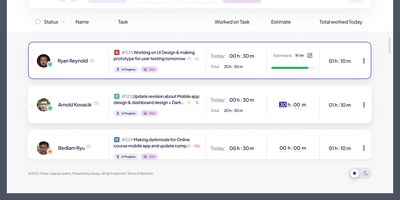
Powering distributed teams seeking full visibility into work patterns and productivity, Ever Teams is an open-source platform unifying time tracking, task management, project coordination, and team collaboration in a single self-hosted application. The real-time timer tracks work against tasks and projects with one-click start/stop, while the Electron desktop app captures periodic screenshots at configurable intervals, monitors keyboard and mouse activity levels, detects idle periods, and syncs offline sessions automatically. Kanban boards with drag-and-drop, calendar views, and daily planning tools organize work across custom statuses, priorities, and sizes. Built-in video conferencing powered by Jitsi or LiveKit enables meetings without leaving the platform. Timesheet management supports submission, review, and approval workflows with configurable time limits and budgets. The backend runs on the Ever Gauzy NestJS platform providing REST and GraphQL APIs, multi-tenant architecture with organization and team scoping, role-based access control, and an integration framework connecting GitHub issues and pull requests bidirectionally plus JIRA import and sync. Infrastructure includes PostgreSQL, Redis for caching and pub/sub, MinIO for S3-compatible storage, Elasticsearch for full-text search, and Cube.js for OLAP analytics. Built with Next.js 16, React 19, Tailwind CSS, and Recoil, with native iOS and Android clients via Expo, Electron desktop apps for Windows, macOS, and Linux, and Plasmo browser extensions for Chrome and Firefox. Internationalization spans 13-plus locales with dark, light, and system themes. Running on a dedicated VPS on RepoCloud with guaranteed CPU, RAM, and SSD, full root SSH access, and a browser serial console. AGPL v3.0 licensed.
CrowdSec Web UI
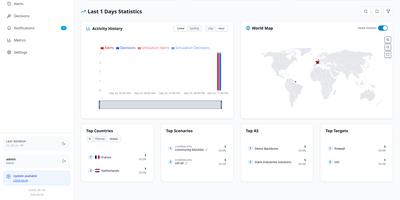
CrowdSec Web UI provides a centralized web console for monitoring intrusion detection telemetry, managing firewall remediation decisions, and auditing security events across multiple CrowdSec security engines. Administrators can connect several CrowdSec Local API endpoints simultaneously, aggregating threat intelligence and active bans into a unified visual interface. The dashboard displays geographic origins of attacking IP addresses, active remediation durations, and specific scenario triggers such as brute-force authentication attacks or web vulnerability probes. Operators can search through historical alert logs, inspect raw HTTP request details, and drill down into individual IP behaviors to differentiate authentic threats from false positives. Manual intervention tools let security teams enforce custom IP bans, adjust expiration timers, or immediately revoke erroneous bans across all connected bouncers with a single click. Integrated notification pipelines dispatch real-time security alerts to external destinations including ntfy, Gotify, and MQTT message brokers whenever critical thresholds are breached. Built-in Prometheus metrics dashboards visualize processing latencies, parser throughput, and decision counts over customizable time windows. Running on a dedicated VPS on RepoCloud with guaranteed CPU, RAM, and SSD, full root SSH access, and a browser serial console. AGPL-3.0 licensed.
Pulse
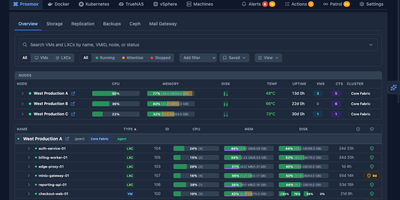
Pulse monitors your entire heterogeneous infrastructure from one screen: Proxmox VE, Proxmox Backup Server, Proxmox Mail Gateway, Docker, Podman, Docker Swarm, Kubernetes, TrueNAS SCALE/CORE, VMware vSphere, and standalone Linux/Windows/macOS machines. The Go binary embeds a SolidJS/TypeScript frontend, delivering WebSocket-driven dashboards with sub-second metric updates on port 7655. A unified agent auto-detects Docker, Podman, Kubernetes, and Proxmox on each host without manual configuration and self-updates silently, while Proxmox nodes need only API credentials with zero agent installation. Smart alerts use adaptive hysteresis-based thresholds to prevent notification floods, pushing to Discord, Slack, Telegram, Teams, email, ntfy.sh, Gotify, and generic webhooks with per-resource overrides. The standout feature is Pulse Patrol: scheduled AI health checks running every ten minutes to seven days using OpenAI, Anthropic, Gemini, or local Ollama models. Patrol catches silent backup failures, capacity creep, restart loops, unhealthy containers, and clock drift that dashboards miss when nobody is watching. Platform-specific views render Proxmox nodes, Ceph clusters, Docker Compose projects, Kubernetes workloads, TrueNAS pools, and vSphere VMs in familiar layouts. OIDC, SSO, and SAML authentication with credential encryption at rest secures access. 6,500+ stars and 441 releases since February 2025. Running on a dedicated VPS on RepoCloud with guaranteed CPU, RAM, and SSD, full root SSH access, and a browser serial console. MIT licensed.
Bugsink
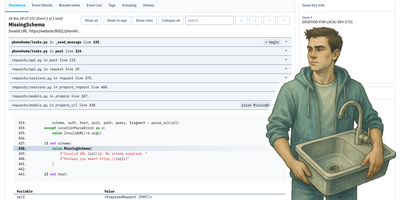
Bugsink has earned over 1,800 GitHub stars as the lightweight self-hosted error tracking platform that replaces Sentry without per-event billing by accepting error reports from any Sentry-compatible SDK across Python, JavaScript, Node.js, Ruby, Java, PHP, Go, and every other language Sentry supports. Simply update the DSN in your existing Sentry configuration and Bugsink captures the same stack traces, local variables, request context, and breadcrumbs that Sentry processes, displayed through a focused interface designed for debugging rather than dashboarding. Automatic issue grouping collapses duplicate error events into single actionable issues based on exception type, message, and stack frame context, turning thousands of raw events into a manageable list. Issue status tracking supports resolved, resolved-in-next-release, and muted states with automatic regression detection when resolved issues recur. Release tracking associates events with deploy versions to correlate error spikes with specific rollouts. Tag-based search filters issues by environment, release, user, browser, operating system, or any custom key-value pair sent by the SDK. Alerting notifies your team through Slack, Discord, Mattermost, and email when new issues appear or resolved issues regress, with per-project webhook configuration and user-level notification preferences. Per-project retention policies with automatic event eviction manage storage growth. A REST API with OpenAPI documentation enables custom integrations and dashboards. Source map support links minified JavaScript to original source. Deploy via Docker with the bugsink/bugsink image. Running on a dedicated VPS on RepoCloud with guaranteed CPU, RAM, and SSD, full root SSH access, and a browser serial console. PolyForm Shield licensed.
Highlight
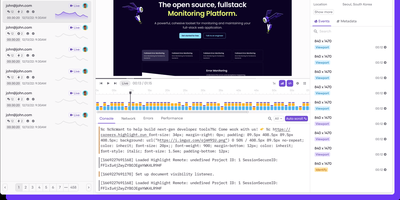
With over 9,000 GitHub stars and a focus on developer experience over legacy monitoring complexity, Highlight.io delivers a unified observability platform that correlates frontend user behavior with backend performance data in a single interface. The session replay engine captures high-fidelity DOM recordings showing exactly what users experienced, including console logs, network requests, page transitions, and user interactions, with configurable privacy redaction for sensitive content. Error monitoring automatically groups and deduplicates errors, surfaces affected user sessions, and provides full stack traces with source map support for minified production code. The logging pipeline ingests structured and unstructured logs from any backend service with automatic property extraction, full-text search, and configurable alerting thresholds. Distributed tracing tracks request flows across microservices with embedded links to associated sessions, errors, and logs for complete request lifecycle visibility. The metrics system collects custom application metrics alongside built-in web vitals and performance data for trend analysis and anomaly detection. Search across all telemetry types uses a unified query language with automatic attribute discovery and saved views for recurring investigations. Integrations connect with Slack, Discord, Linear, Jira, Vercel, and dozens of other developer tools for notification routing and workflow automation. SDKs cover React, Next.js, Vue, Angular, Python, Go, Ruby, Java, PHP, and Elixir with framework-specific instrumentation. Self-hosted deployment runs via Docker Compose with ClickHouse for analytics storage. Running on a dedicated VPS on RepoCloud with guaranteed CPU, RAM, and SSD, full root SSH access, and a browser serial console. Apache 2.0 licensed.
Swetrix
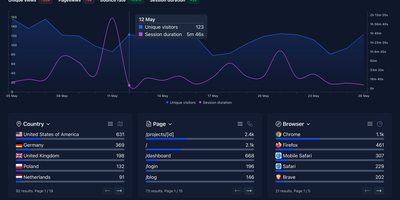
Traffic analytics, real-user performance monitoring, and client-side error tracking - normally three tools - in one cookieless, privacy-first dashboard: Swetrix. The Community Edition ships the same core engine as the cloud product - a NestJS API with ClickHouse for high-volume event storage, MySQL for relational data, and Redis for caching, fronted by a React dashboard and a ~5 KB tracking script with official packages for 20+ frameworks including Next.js, WordPress, and Shopify. Traffic analytics cover pageviews, referrers, UTM campaigns, geolocation, sessions with page flows, funnels, and custom events - all anonymized server-side with no cookies, no cross-device tracking, and no consent banner required for GDPR compliance. Performance monitoring records real-user metrics per pageview: TTFB, DNS and TLS timing, and render times, so regressions surface in the same place as traffic. Error tracking captures unhandled JavaScript exceptions automatically with formatted stack traces, filename/line metadata, affected browsers and pages, first/last-seen timestamps, and a resolve workflow - replacing a separate error monitoring subscription for many teams. Alerts fire to email, Slack, Telegram, Discord, or webhooks on traffic spikes, new errors, and custom events. If Plausible covers your traffic questions but you also want to know why the site broke, Swetrix answers both.
Cockpit
Cockpit puts Linux server administration in a web browser, rendering storage, networking, containers, and virtual machines as visual panels you click through instead of command-line syntax you memorize. It ships in every major Linux distribution and activates through systemd socket activation, consuming zero resources until someone connects on port 9090. What makes it different from other admin panels: every change through the web interface appears instantly at the command line, and every terminal change reflects in the browser in real time. No abstraction layer sits between the UI and the operating system, which means no configuration drift. Storage management covers disk partitioning, RAID arrays, LUKS encryption, LVM volumes, and NFS shares. Network configuration handles bonds, bridges, VLANs, and firewall zones through visual editors. Native Podman integration pulls images, creates containers, manages pods, and provides terminal access into running processes. KVM/libvirt support handles VM creation, cloning, snapshots, and live migration with console access. A built-in terminal provides shell access when the web interface is not enough, and the journal viewer filters systemd logs by severity and unit. Multi-server management connects additional hosts over SSH, presenting a unified dashboard across your entire infrastructure from one browser tab. Runs on a dedicated RepoCloud VPS with full root SSH access and browser serial console. LGPL licensed.
Checkcle
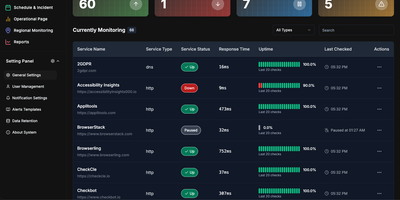
CheckCle provides a complete uptime monitoring and infrastructure observability platform that deploys with a single Docker container and stores all data in embedded SQLite via PocketBase. The Go backend runs three microservices — a service operation engine handling HTTP, HTTPS, DNS, Ping, and TCP checks at configurable intervals, a distributed regional check agent for multi-location network testing, and a server monitoring agent collecting CPU, RAM, disk usage, and network metrics via gRPC. The React frontend built with Vite, TypeScript, Tailwind CSS, and shadcn-ui subscribes to PocketBase WebSocket endpoints for real-time dashboard updates without polling. SSL and domain monitoring tracks certificate issuers, expiration dates, days remaining, and validation status. The incident management system records UP, DOWN, WARNING, and PAUSE states with full history, while scheduled maintenance windows prevent false alerts during planned downtime. Public status pages provide external stakeholders with live service health information. Health heatmaps visualize uptime performance and outage patterns over time. Notification channels include email, Telegram, Discord, and Slack, with multiple alert targets per monitored service. The one-click agent installation script supports Debian, Ubuntu, CentOS, Red Hat, Alpine, and Windows in beta. Docker deployment runs on port 8090 with a single persistent volume at /mnt/pb_data, requiring minimum 1 vCPU and 500MB RAM. On RepoCloud, deploy CheckCle on a dedicated VPS with root SSH access, persistent storage for your monitoring database, and complete control over agent endpoints and notification configurations, all under the MIT license.
Gotify
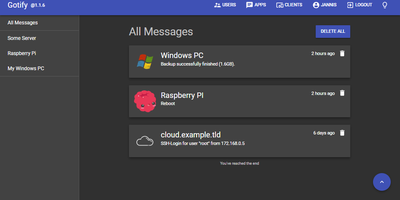
Real-time alerts from your own infrastructure to your phone, with no Firebase, Pushover, or third-party push service in the path: Gotify is a simple, self-hosted notification server written in Go. The model is deliberately minimal: senders push messages with a single HTTP POST to the REST API, receivers subscribe over a WebSocket stream, and a clean React web UI manages the pieces. Senders are namespaced as "applications," each with its own token, so your backup script, Uptime Kuma, CI pipeline, and cron jobs each get an identity, an icon, and independently revocable credentials - centralized alerting from many services with per-source management. Messages carry a title, body, and priority level that maps to notification importance on the client. The official Android app (on both F-Droid and Google Play, notable for working entirely without Google Play Services) shows push notifications for new messages; the web UI itself supports Web Push in the browser; and gotify/cli pushes messages from shell scripts with one command. A server-side plugin system adds custom behavior, and the whole thing runs as a single small binary with SQLite by default - near-zero resource footprint. Because dozens of tools (and Apprise) speak Gotify natively, it slots in as the notification hub for an entire homelab or ops stack.
Kener
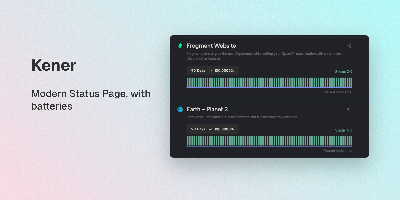
A polished public status page without Statuspage prices or a heavyweight observability suite: Kener is a status and uptime monitoring system built with SvelteKit and Node.js. It runs 11 monitor types - API, Ping, TCP, DNS, SSL certificate, SQL query, Heartbeat, gRPC, and GameDig game-server checks among them - each with configurable intervals and thresholds. Incident management covers the full lifecycle: structured timelines from investigation through resolution, acknowledgements, and subscriber-visible updates, plus maintenance windows with RRULE-based recurring schedules and automatic status transitions. Notifications reach email, Slack, Discord, and custom webhooks through trigger-based workflows with template-driven messaging. One instance can serve multiple branded status pages - per product, team, or region - with custom logos, colors, and CSS, localization into 21 languages, timezone-aware displays, and server-rendered pages that stay fast and SEO-friendly. Operations tooling includes role-based access for teams, API key management, a secrets vault, analytics integrations (Google Analytics, Plausible, Umami, and others), and a REST API with 17+ endpoints for automating incidents and monitors from CI/CD. MIT-licensed; Docker deployment with Redis, SQLite by default, PostgreSQL or MySQL for production.
Healthchecks
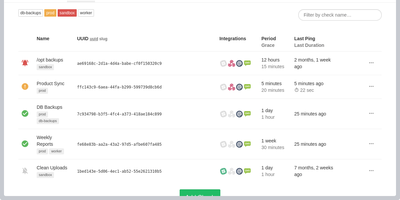
With 10,100+ GitHub stars and 75 releases over a decade of continuous development, Healthchecks is the open-source cron job monitoring service that catches failures your other monitoring tools miss — the jobs that silently stop running, the backups that never completed, the nightly reports that disappeared without error. The dead man's switch architecture requires zero agent installation: your cron jobs, scripts, and services ping a unique URL via HTTP request or email, and Healthchecks alerts you only when a ping does not arrive within the configured Period and Grace Time window. Each check supports cron expression scheduling, optional start, success, and failure signals for measuring execution time, and HTTP body keyword filtering for intelligent alert routing. Twenty-five notification integrations cover every channel teams actually use: Slack, Discord, Microsoft Teams, PagerDuty, Opsgenie, Splunk On-Call, Telegram, Signal, WhatsApp, SMS, email, webhooks, GitHub Issues, Pushover, ntfy, Gotify, Matrix, Mattermost, Zulip, Pushbullet, PagerTree, Spike.sh, and Trello. The web dashboard provides a visual grid showing real-time status with color-coded badges and per-check integration toggles. Monthly, weekly, and daily email reports summarize uptime trends with checks sorted by downtime duration. Team management supports projects with member roles and read-only access. Prometheus metrics expose check health and grace state for Grafana dashboards. WebAuthn and TOTP two-factor authentication secure accounts. Deploy via Docker images available for amd64, arm/v7, and arm64 architectures. Running on a dedicated VPS on RepoCloud with guaranteed CPU, RAM, and SSD, full root SSH access, and a browser serial console. BSD 3-Clause licensed.
Percona PMM
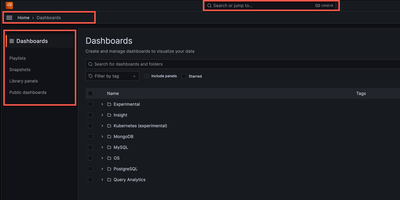
Backed by 1,080+ GitHub stars and maintained by Percona with the latest release v3.8.1 in June 2026, Percona Monitoring and Management delivers the open-source database observability platform that provides a single pane of glass across MySQL, PostgreSQL, MongoDB, Valkey, and Redis databases deployed on-premises, cloud, or hybrid environments. The Go-powered PMM Server collects metrics from lightweight PMM Client agents with minimal performance impact, storing time-series data in ClickHouse for fast querying across configurable retention periods. Query Analytics ranks every query by load across all database engines from one unified dashboard, drilling from fleet-level performance down to individual problematic queries with explain plans, per-query metrics, and anomaly detection. Real-time Query Analytics streams live MongoDB operations updated every 1-5 seconds for immediate troubleshooting of lock contention and long-running queries. Built-in Percona Advisors continuously scan connected databases for security gaps, misconfigurations, and performance problems, distilling decades of DBA expertise into automated actionable recommendations. Percona Alerting integrates with 15+ notification channels including Slack, PagerDuty, email, and webhooks to trigger on custom metric thresholds. Database-specific dashboards visualize InnoDB storage engine details, WiredTiger cache metrics, PostgreSQL tuple activity, replication lag, and cluster health with annotations for root-cause correlation. Deployment options include Docker single-container setup, Podman rootless execution, and Helm charts for Kubernetes with Ingress controller support and ConfigMap management. Running on a dedicated VPS on RepoCloud with guaranteed CPU, RAM, and SSD, full root SSH access, and a browser serial console. AGPL-3.0 licensed.
Coroot
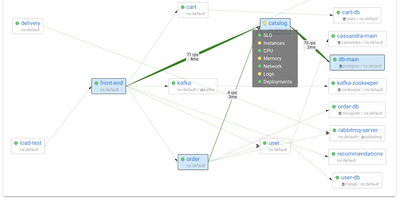
Coroot uses eBPF to capture metrics, distributed traces, logs, and continuous CPU profiles directly from the Linux kernel, delivering full observability without any application code changes, SDKs, or sidecars. From the first minute of deployment, an automatically generated service map covers every microservice, database, message queue, and external dependency with request rate, error rate, and latency measurements. When a service breaches its SLO, AI-powered inspections analyze telemetry across all dimensions to pinpoint the root cause and send a single consolidated alert with findings, replacing the flood of fragmented notifications typical of traditional monitoring. Deployment tracking automatically discovers Kubernetes rollouts and compares each release against the previous one to detect performance regressions, resource spikes, and cost impacts without CI/CD pipeline integration. Continuous profiling captures CPU flame graphs down to the line of code with negligible overhead. Integrated cost monitoring tracks cloud spending across AWS, GCP, and Azure, attributing expenses to individual services and deployments. Coroot supports Prometheus, OpenTelemetry, and ClickHouse as data sources and works identically on Kubernetes clusters, virtual machines, and bare-metal hosts. 7,700+ GitHub stars. Apache-2.0 licensed.
PRISM
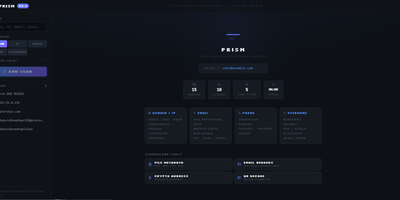
PRISM consolidates passive reconnaissance, credential leak detection, and network asset mapping into a unified operational dashboard to replace fragmented command-line security tools. Analysts can launch simultaneous multi-source investigations against domains, internet protocol addresses, email mailboxes, phone numbers, and online handles to uncover domain registrations, open network ports, cryptographic certificates, and historical web archives. The platform interrogates threat feeds and leak repositories to expose credential leaks, dark web mirrors, and email routing anomalies with automated SMTP mailbox verification. Cross-platform identity engines crawl thousands of social networks and public registries to correlate aliases, discover leaked commit identities, and trace digital footprints across the web. Discovered assets render into interactive entity relationship graphs alongside geographic internet protocol maps to help investigators visualize infrastructure clusters and ownership links. An automated operational security calculator evaluates exposure vulnerabilities across identity, web, and infrastructure vectors, producing an aggregated risk score with granular hardening recommendations. Scheduled watchlists continually monitor target infrastructure, dispatching webhook notifications to chat channels whenever new subdomains, ports, or credential leaks appear. Investigators can export comprehensive audit dossiers as self-contained HTML files, styled PDF documents, or structured spreadsheets. Running on a dedicated VPS on RepoCloud with guaranteed CPU, RAM, and SSD, full root SSH access, and a browser serial console. MIT licensed.
Homarr
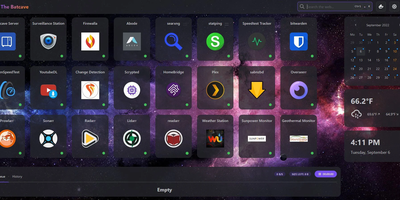
A single pane of glass for every service you run, arranged by drag-and-drop with no YAML or JSON files: Homarr is the modern dashboard for self-hosted infrastructure. Its grid system arranges apps, widgets, and bookmarks on desktop or touch, backed by an icon picker with over 11,000 icons. What separates Homarr from static launchers is 50+ live integrations: Plex, Jellyfin, and Emby media stats, the *arr suite (Sonarr, Radarr) with a unified release calendar, download clients, Pi-hole and AdGuard Home controls, Proxmox, Home Assistant, OPNsense, and Unifi monitoring. Widgets update in real time over WebSockets (tRPC and Redis under the hood), and a built-in search queries thousands of data points across connected services. Custom widgets extend the reach to any HTTP API without code: define endpoint, auth, and refresh interval in the management UI, then render responses as stat grids, tables, progress bars, status indicators, action buttons, or full custom JSX layouts - with an AI-prompt helper for generating templates. Multi-user support is first-class: credentials, OIDC, or LDAP sign-on, groups with granular permissions, and secrets encrypted with AES-256-CBC. A robust background-job system scales it from a Raspberry Pi homelab to deployments serving hundreds of users.