SaaS Alternative
Kentik SolarWinds NetFlow Traffic Analyzer ManageEngine NetFlow Analyzer Plixer ScrutinizerCategories
Self-Hosted Observability Network Monitoring Network Security IT Operations Traffic Analysis NetFlow Packet AnalysisStars
Forks
Watchers
Developer links
ntopng
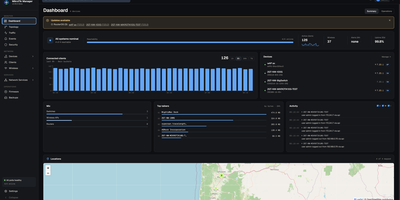
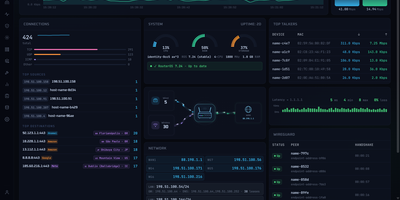
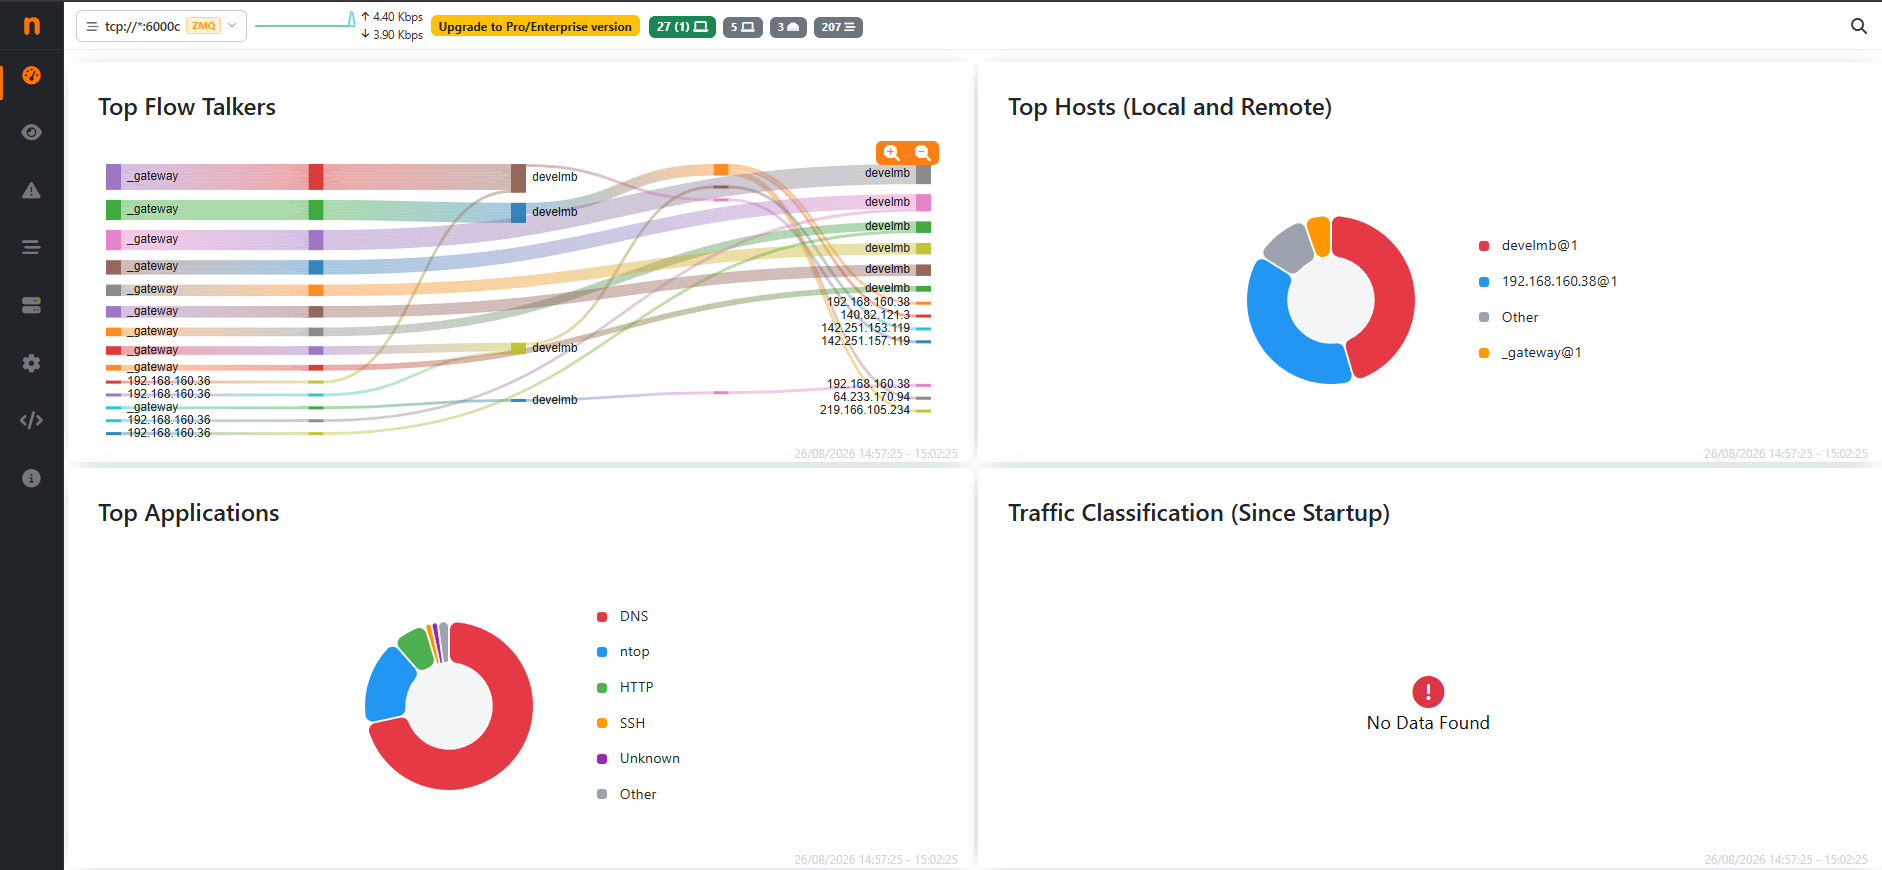
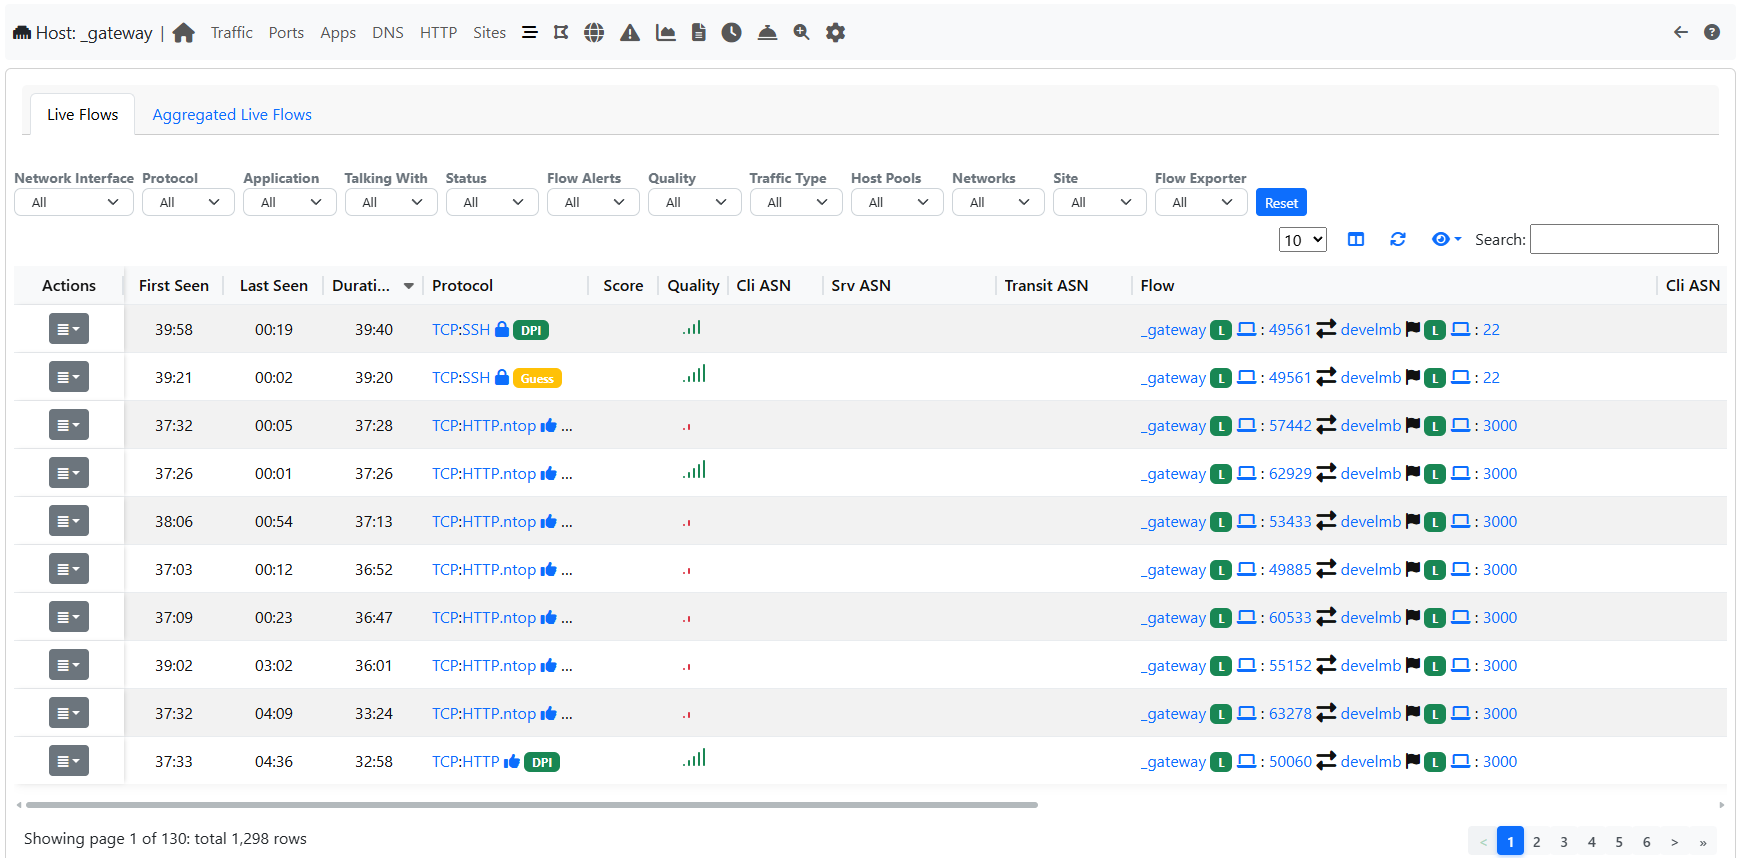
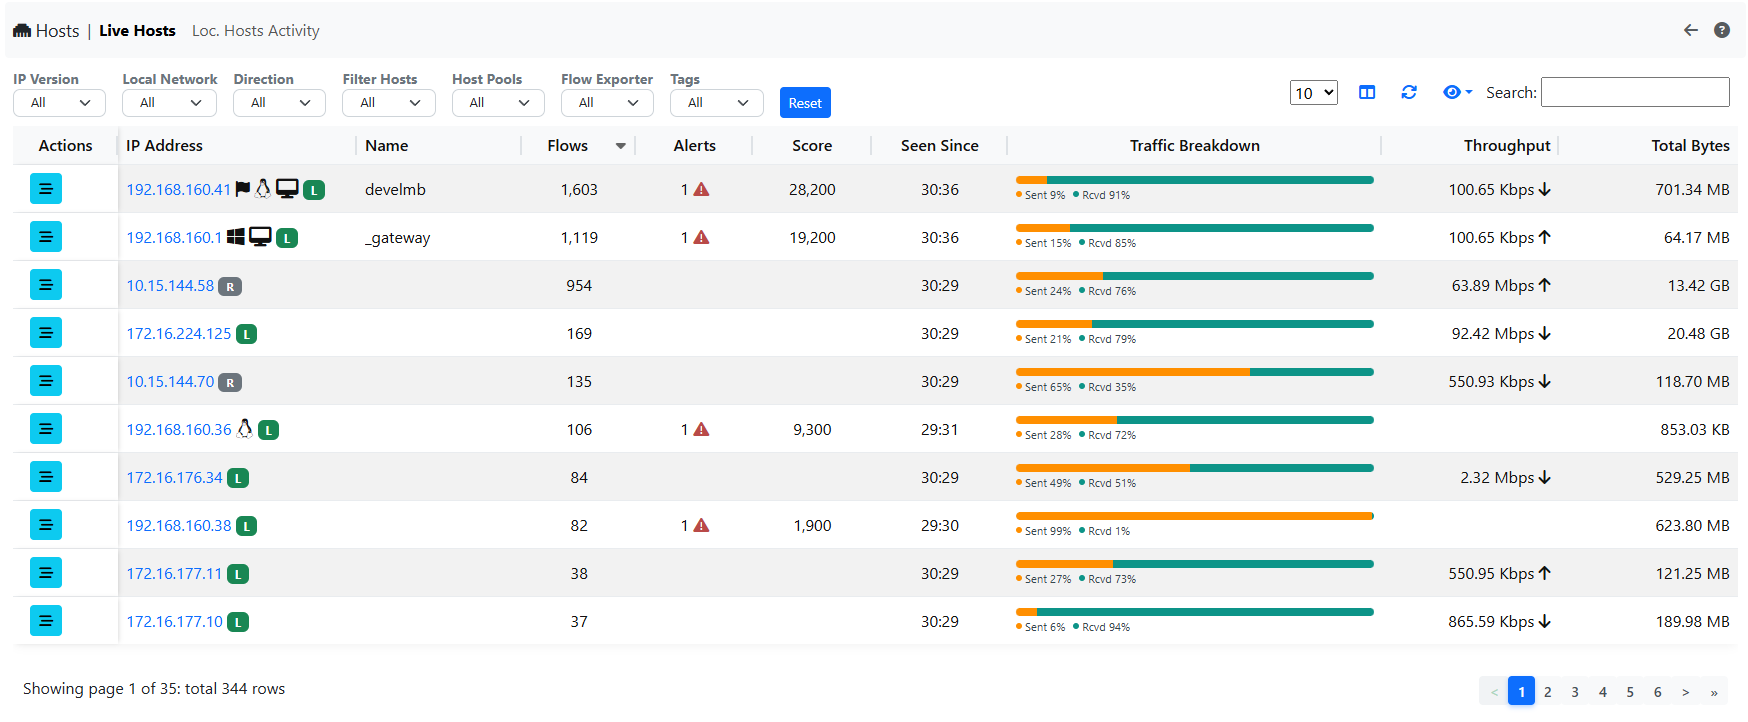
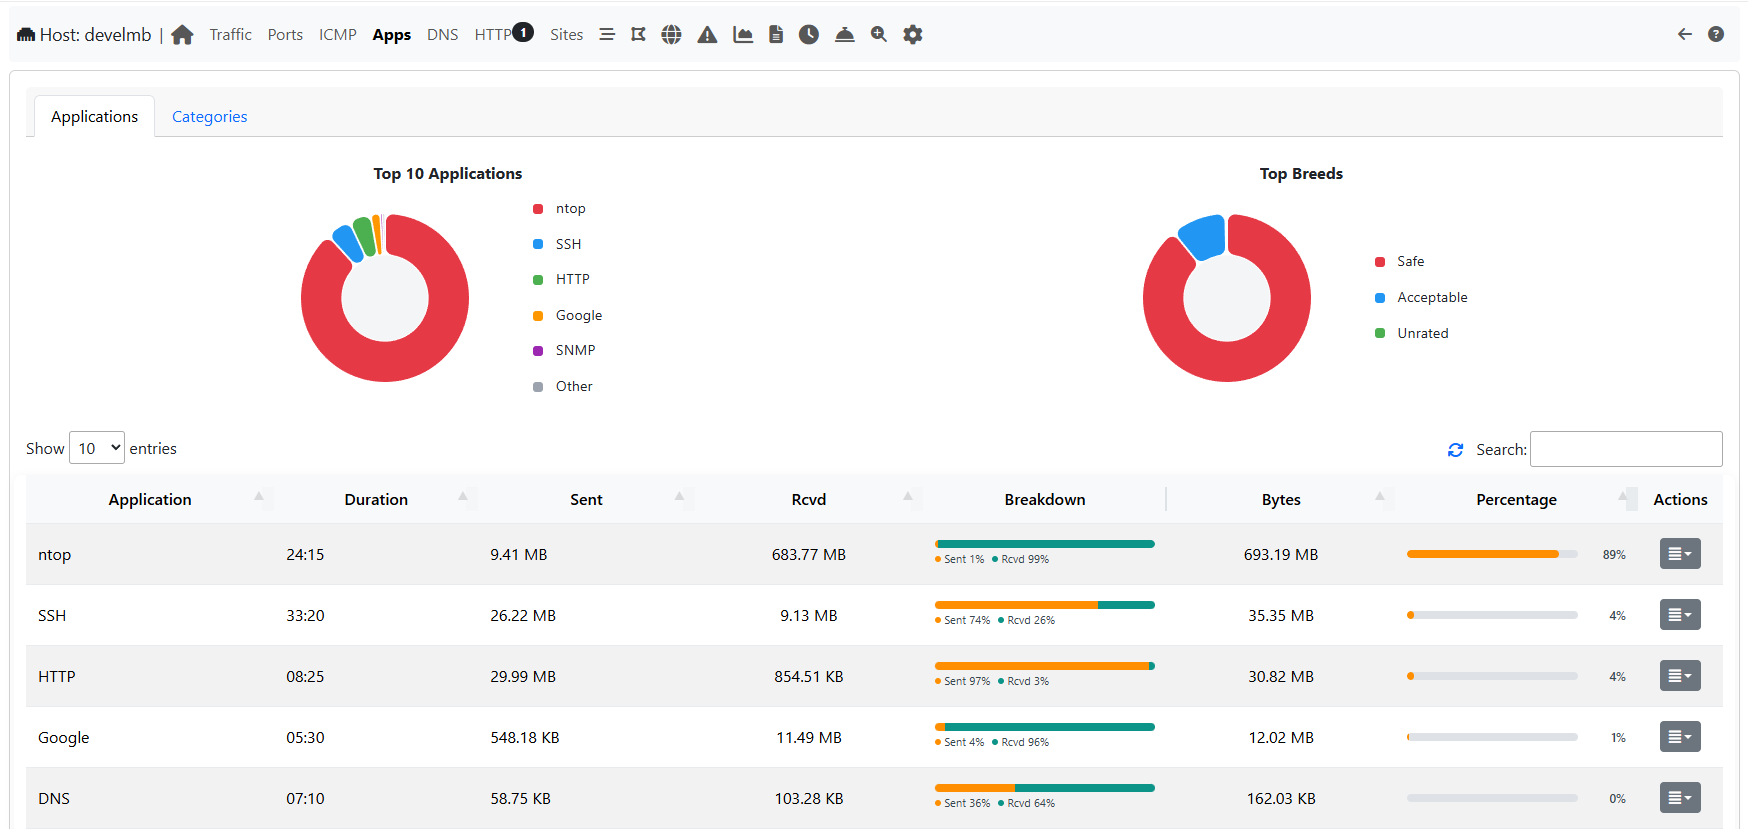
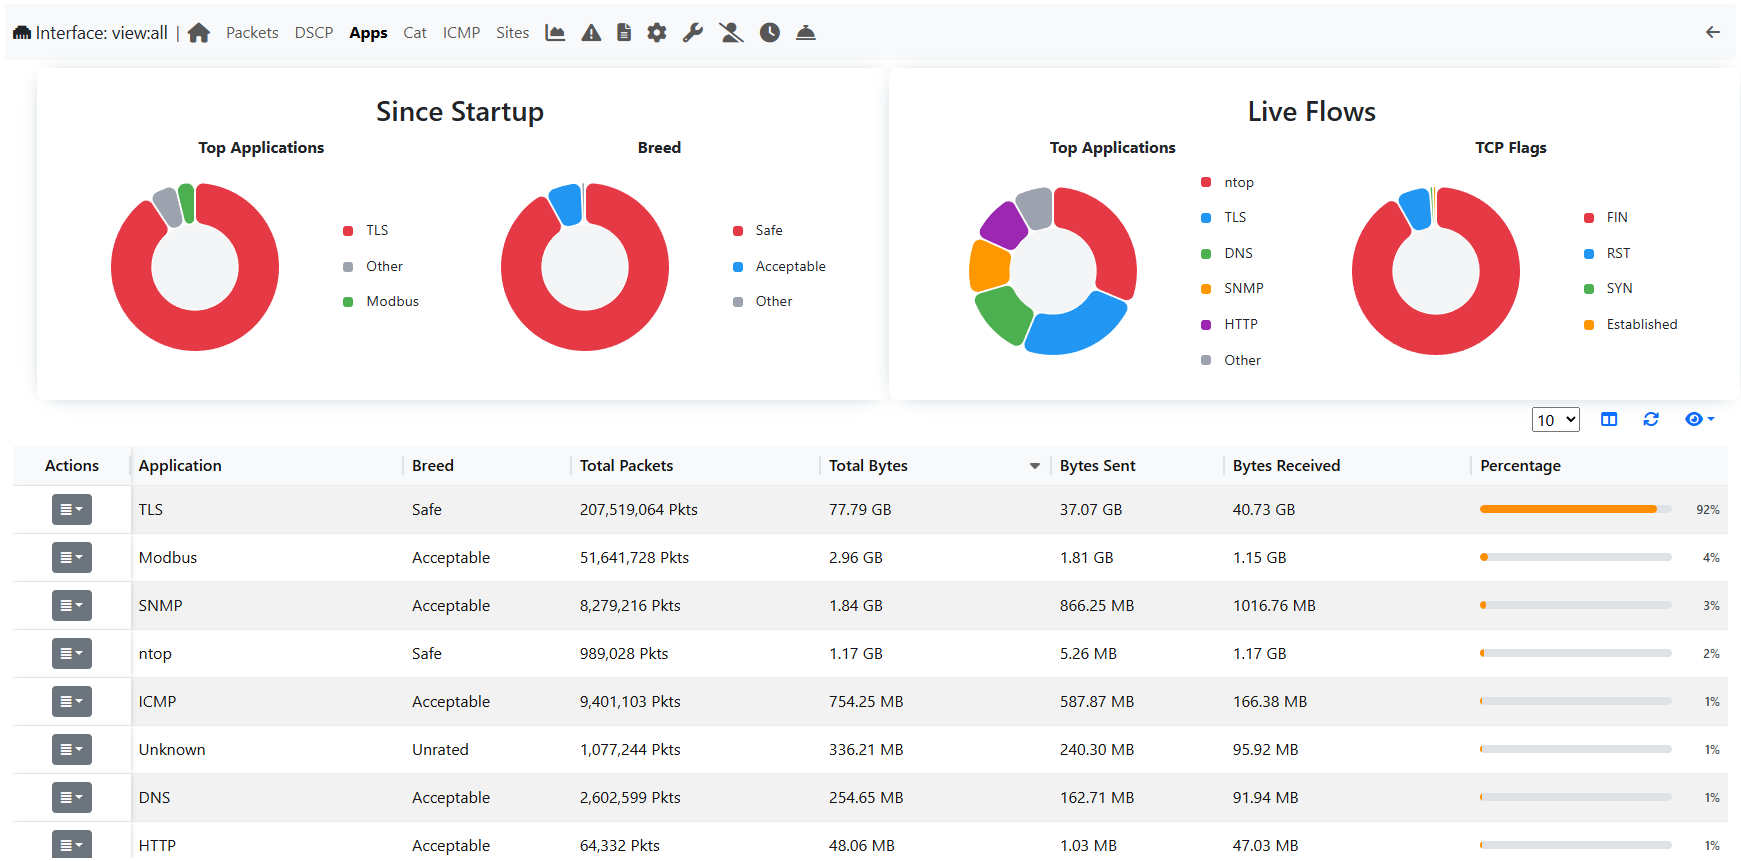
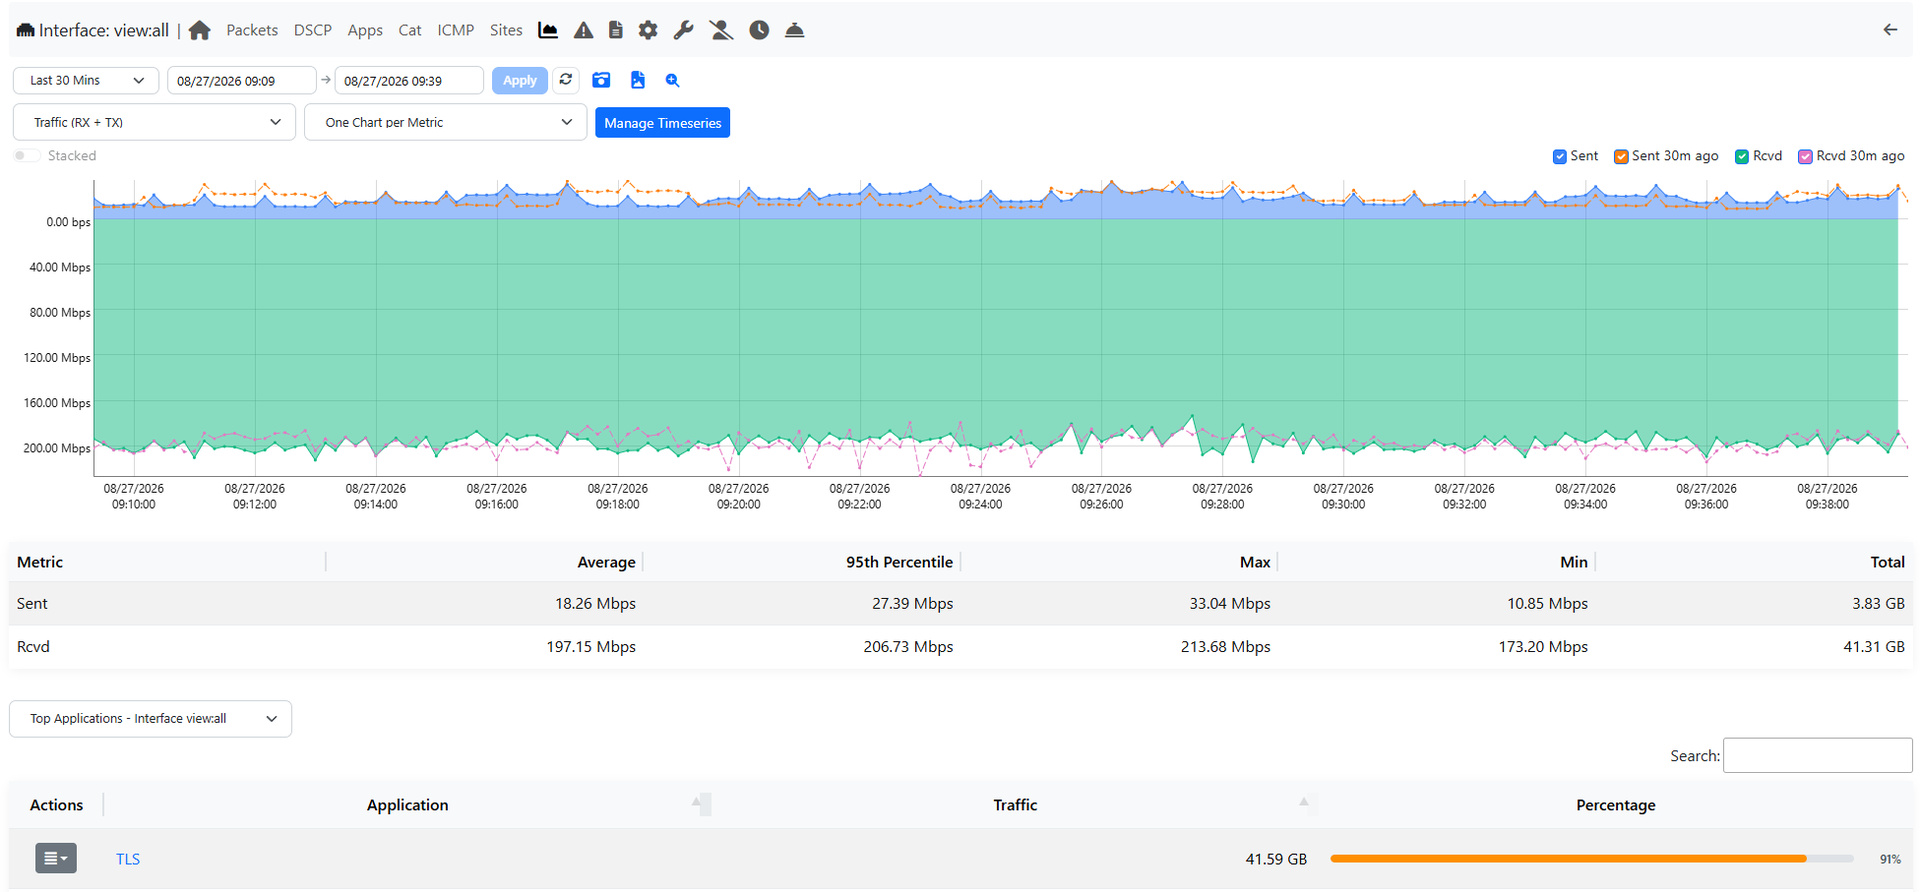
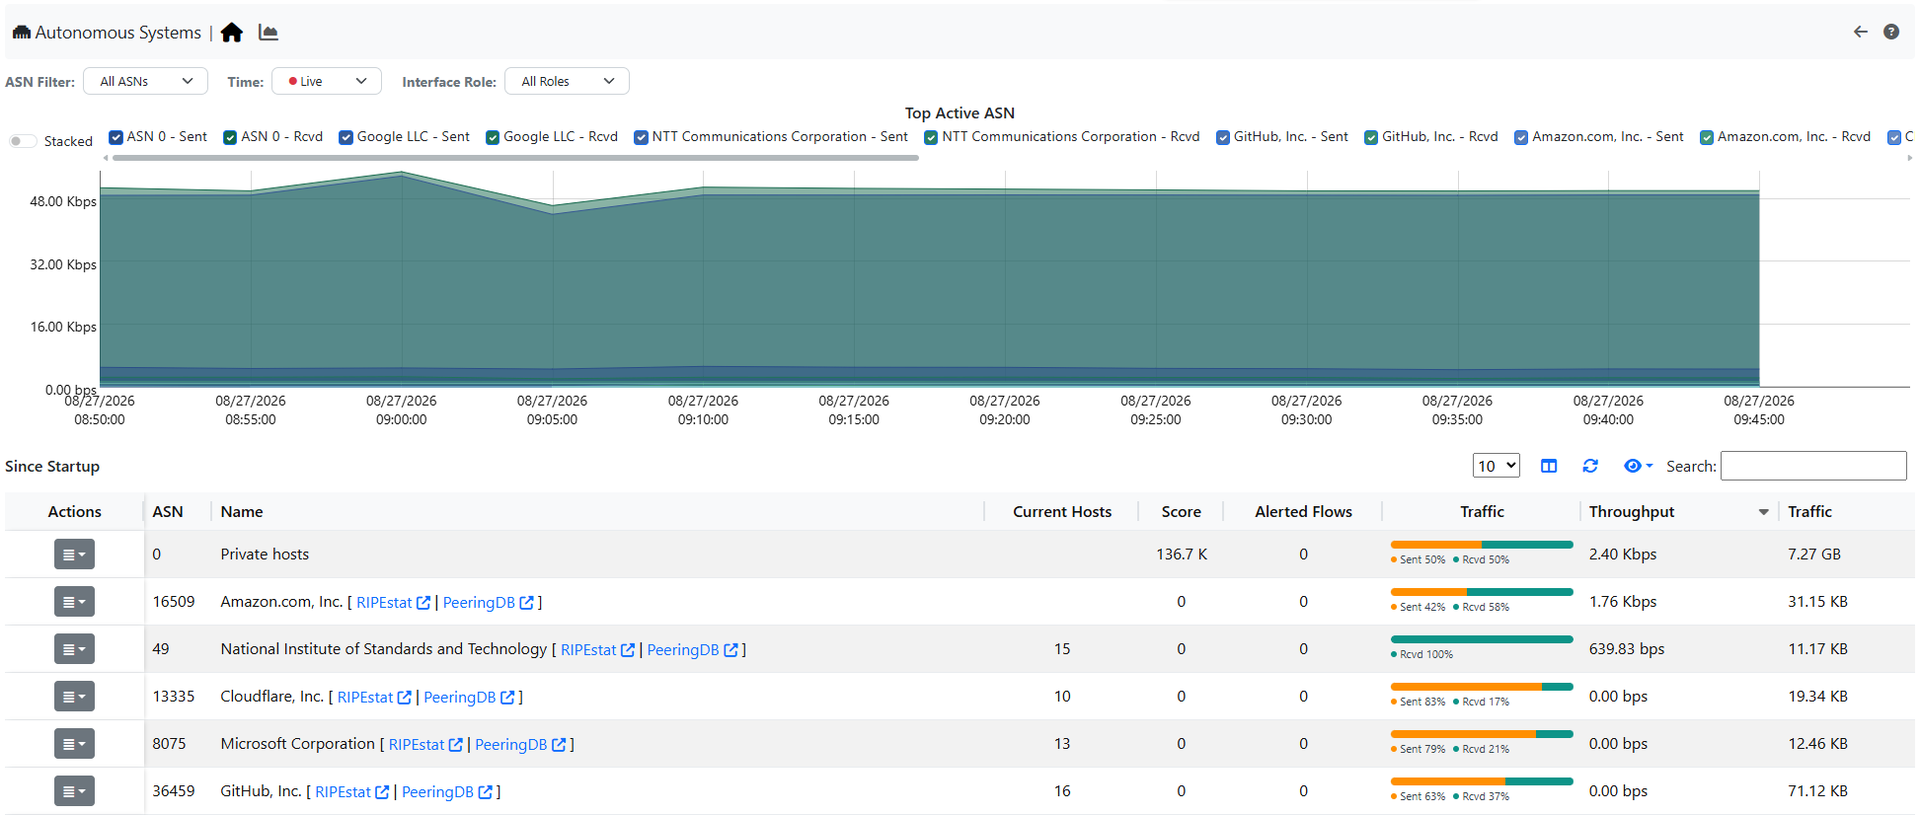
Network traffic stops being a mystery once ntopng names the hosts, applications, and protocols behind every flow, live in your browser. To find the host saturating an uplink, open the dashboard, which ranks top talkers, countries, autonomous systems, and protocols beside historical charts. To see what a suspicious host is contacting, open its page for traffic, ports, DNS queries, TLS details, and visited sites, plus a map of its conversations. Deep packet inspection recognizes applications such as Facebook, YouTube, and BitTorrent, so charts name the app behind the bytes instead of relying on port numbers alone. The console reads packets from a SPAN port or TAP and NetFlow, sFlow, or IPFIX records from routers and switches through nProbe, so it can cover a single switch or many remote sites. Behavioural checks raise alerts for flows, hosts, and interfaces and send them to email, Discord, Telegram, or webhooks. Active monitoring probes remote hosts over ICMP and HTTP/S, and network discovery lists the devices on your local network. A REST API and Lua scripting pull statistics into your own tools and add custom checks. Running on a dedicated VPS on RepoCloud with guaranteed CPU, RAM, and SSD, full root SSH access, and a browser serial console. GPL-3.0 licensed.
Benefits
- See Which Apps Use Bandwidth
- Application detection names the service behind every flow, such as YouTube or BitTorrent, while top-talker rankings point to the host saturating your uplink, so the bandwidth hog is one glance away.
- Fits Small Offices And Routed Networks
- Capture packets from a SPAN port or TAP with libpcap, or collect NetFlow, sFlow, and IPFIX through nProbe, so the same dashboard covers one switch or many remote sites.
- Alerts Reach You Where You Work
- Behavioural checks flag suspicious flows and unusual host activity, then notify you by email, Discord, Telegram, or webhook, so problems reach you without anyone staring at a dashboard.
- Free Edition With A REST API
- The GPL-3.0 Community edition needs no license key, and its REST API and Lua scripting let you pull statistics into your own tools or write custom checks.
Features
- Live Traffic Dashboard
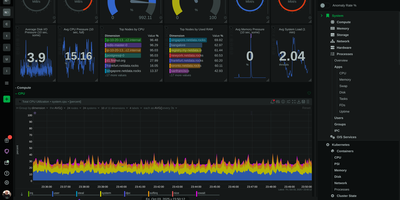
- Rank top talkers, countries, autonomous systems, and application protocols in real time, then compare current traffic with historical charts for the same interface.
- Application Protocol Detection
- nDPI deep packet inspection identifies applications such as Facebook, YouTube, and BitTorrent, so traffic is grouped by what it is rather than by port number alone.
- Packet And Flow Collection
- Read packets from SPAN or TAP interfaces through libpcap or PF_RING, and ingest NetFlow, sFlow, and IPFIX flows exported by routers and switches via nProbe.
- Per-Host Drill-Down
- Open any host to inspect traffic, packets, ports, protocols, DNS queries, TLS details, visited sites, and active flows, plus a geographic map of its conversations.
- Behavioural Alerts
- Checks raise alerts for flows, hosts, and interfaces that you can browse in the GUI and send to email, Discord, Telegram, or webhook endpoints.
- Active Monitoring And Discovery
- Probe remote hosts with ICMP and HTTP/S checks, discover the devices on your local network, and keep an eye on the CPU of the host running ntopng.