Stars
Forks
Watchers
Developer links
Laminar
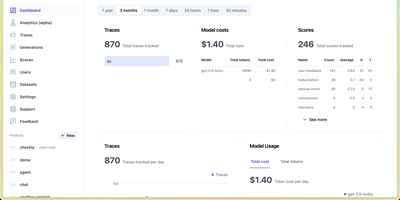
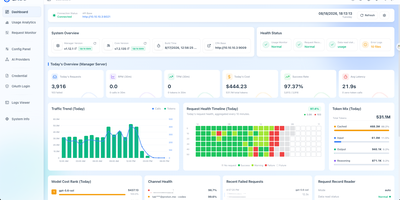
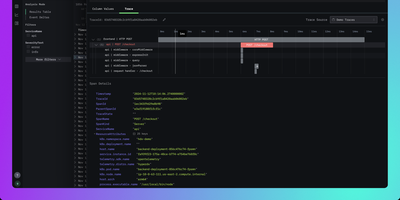
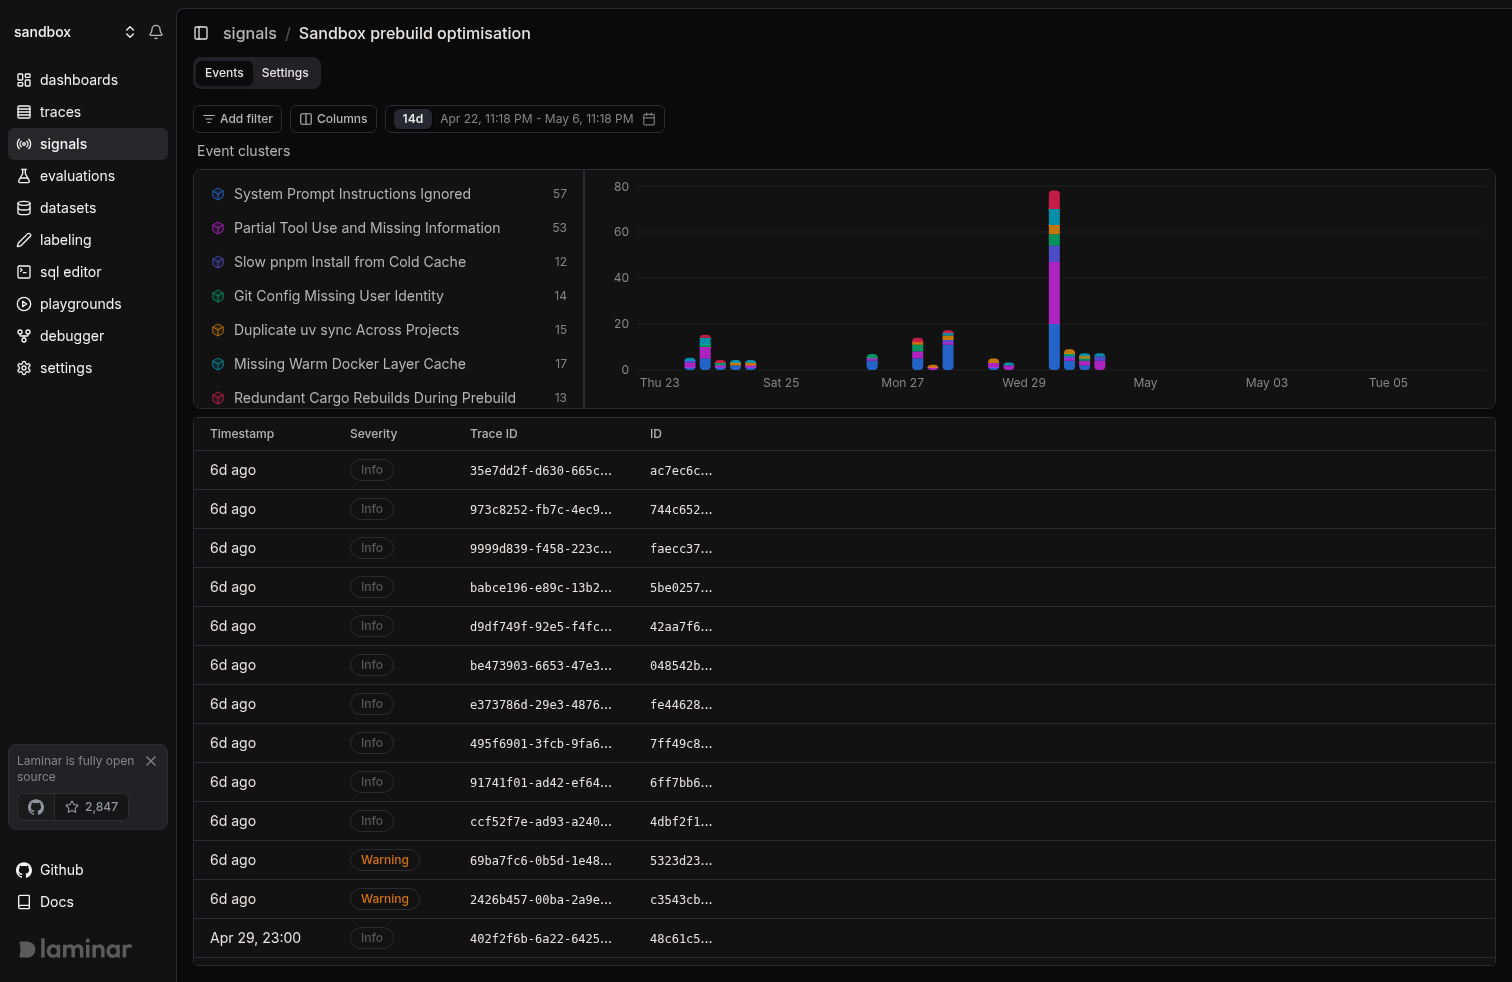
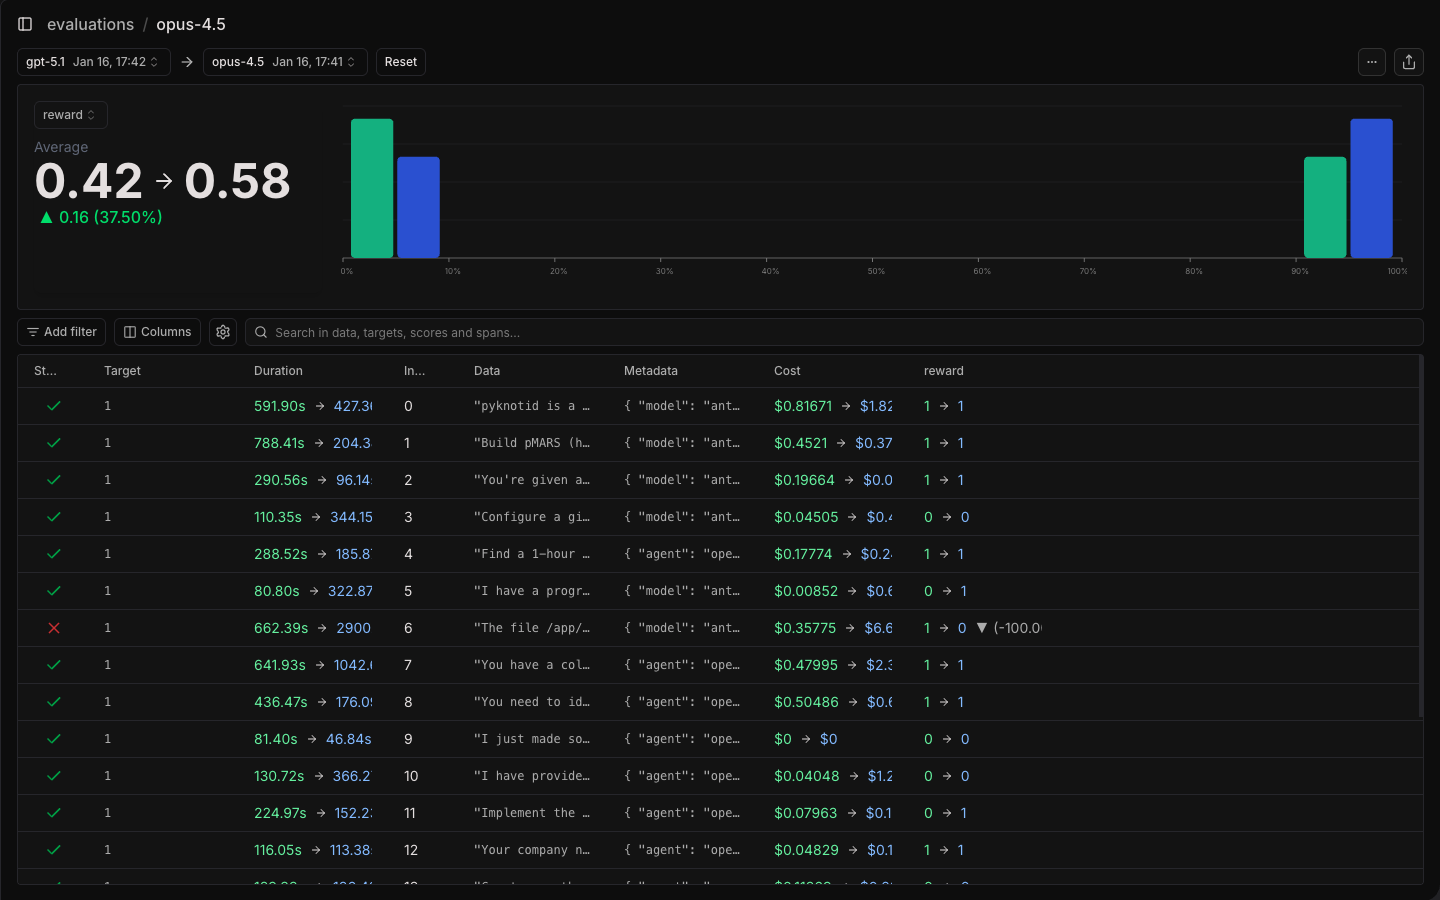
Backed by Y Combinator (S24) and processing traces from thousands of AI agents in production, Laminar is the open-source observability platform that treats agent debugging as a first-class engineering discipline rather than an afterthought. Its OpenTelemetry-native SDK auto-instruments Vercel AI SDK, LangChain, OpenAI, Anthropic, Gemini, Browser Use, Stagehand, Mastra, Pydantic AI, and the OpenAI Agents SDK with a single line of code, capturing every LLM turn, tool call, and sub-agent delegation as nested spans with full input/output data and token costs. The Signals engine lets you describe failures in plain language — "agent is stuck in a loop" or "tool returned empty results" — then reads every trace and alerts via Slack when it detects a match. A built-in debugger records runs and replays them from cache so each iteration takes seconds, designed for Claude Code, Cursor, or Codex to drive the repair loop via the MCP server or CLI. Run code-first evaluations in Python or TypeScript locally or in CI/CD pipelines, build datasets from production traces, and query everything with raw SQL through custom dashboards, the in-app editor, or your coding agent. The Rust backend delivers 20x trace compression, a custom real-time streaming engine, ultra-fast full-text search, and gRPC ingestion, while ClickHouse powers columnar analytics and PostgreSQL stores application state. Running on a dedicated VPS on RepoCloud with guaranteed CPU, RAM, and SSD, full root SSH access, and a browser serial console. Apache 2.0 licensed.
Benefits
- One-Line Agent Instrumentation
- Auto-instrument OpenAI, Anthropic, LangChain, Vercel AI SDK, Browser Use, and 10+ frameworks with a single initialization call — no manual span creation or wrapper functions needed for complete trace capture.
- Plain-Language Failure Detection
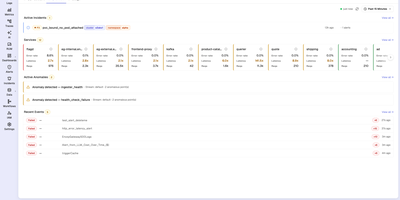
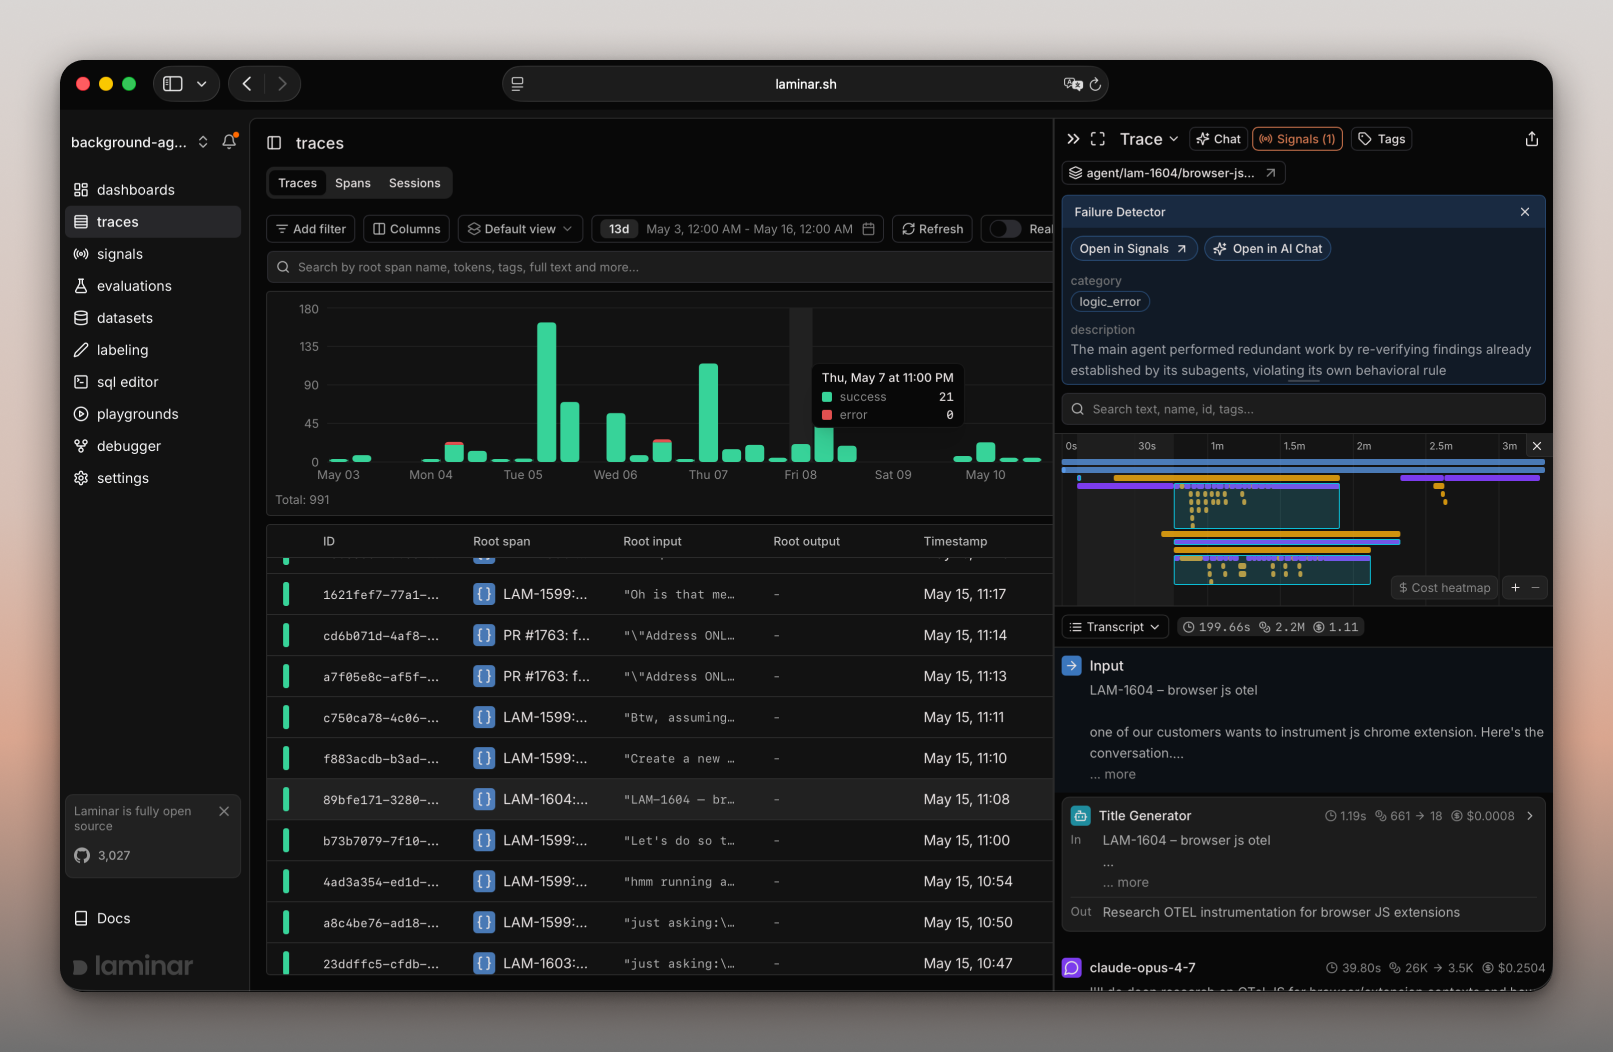
- Signals let you describe agent failures in natural English; Laminar continuously evaluates every trace against your descriptions and pushes Slack alerts when matches are found, eliminating manual log monitoring.
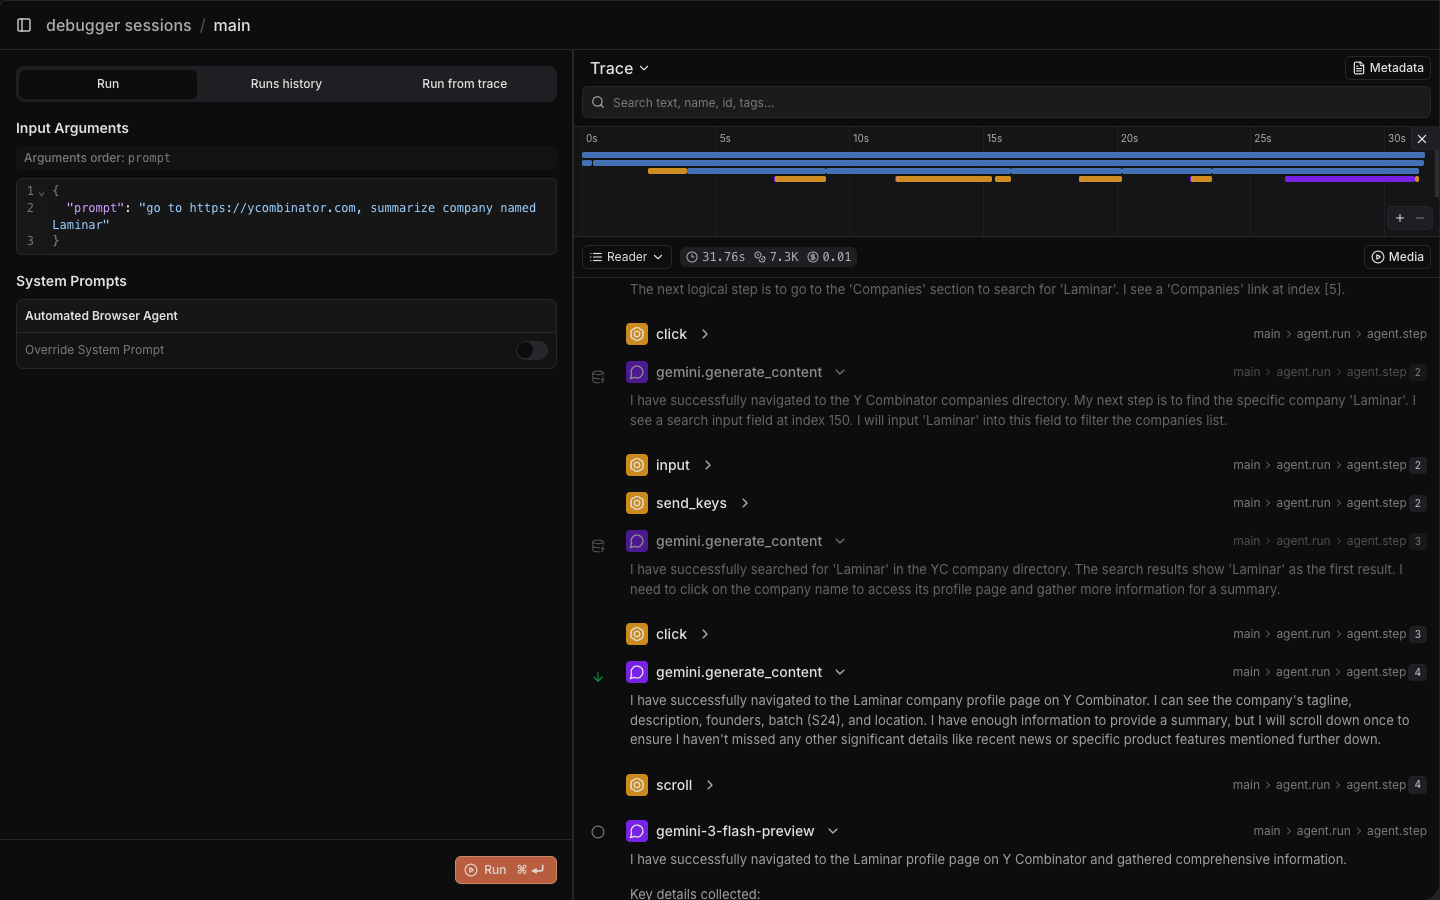
- Coding Agent Debugging Loop
- The debugger records agent runs and replays from cache while Claude Code, Cursor, or Codex iterates on fixes via MCP or CLI, reducing each debug cycle from full live runs to cached seconds.
- SQL Over All Platform Data
- Query traces, spans, signal events, evaluations, and metadata with raw ClickHouse SQL from the UI editor, CLI, or MCP server — answer questions no predefined dashboard can anticipate.
Features
- OpenTelemetry Tracing
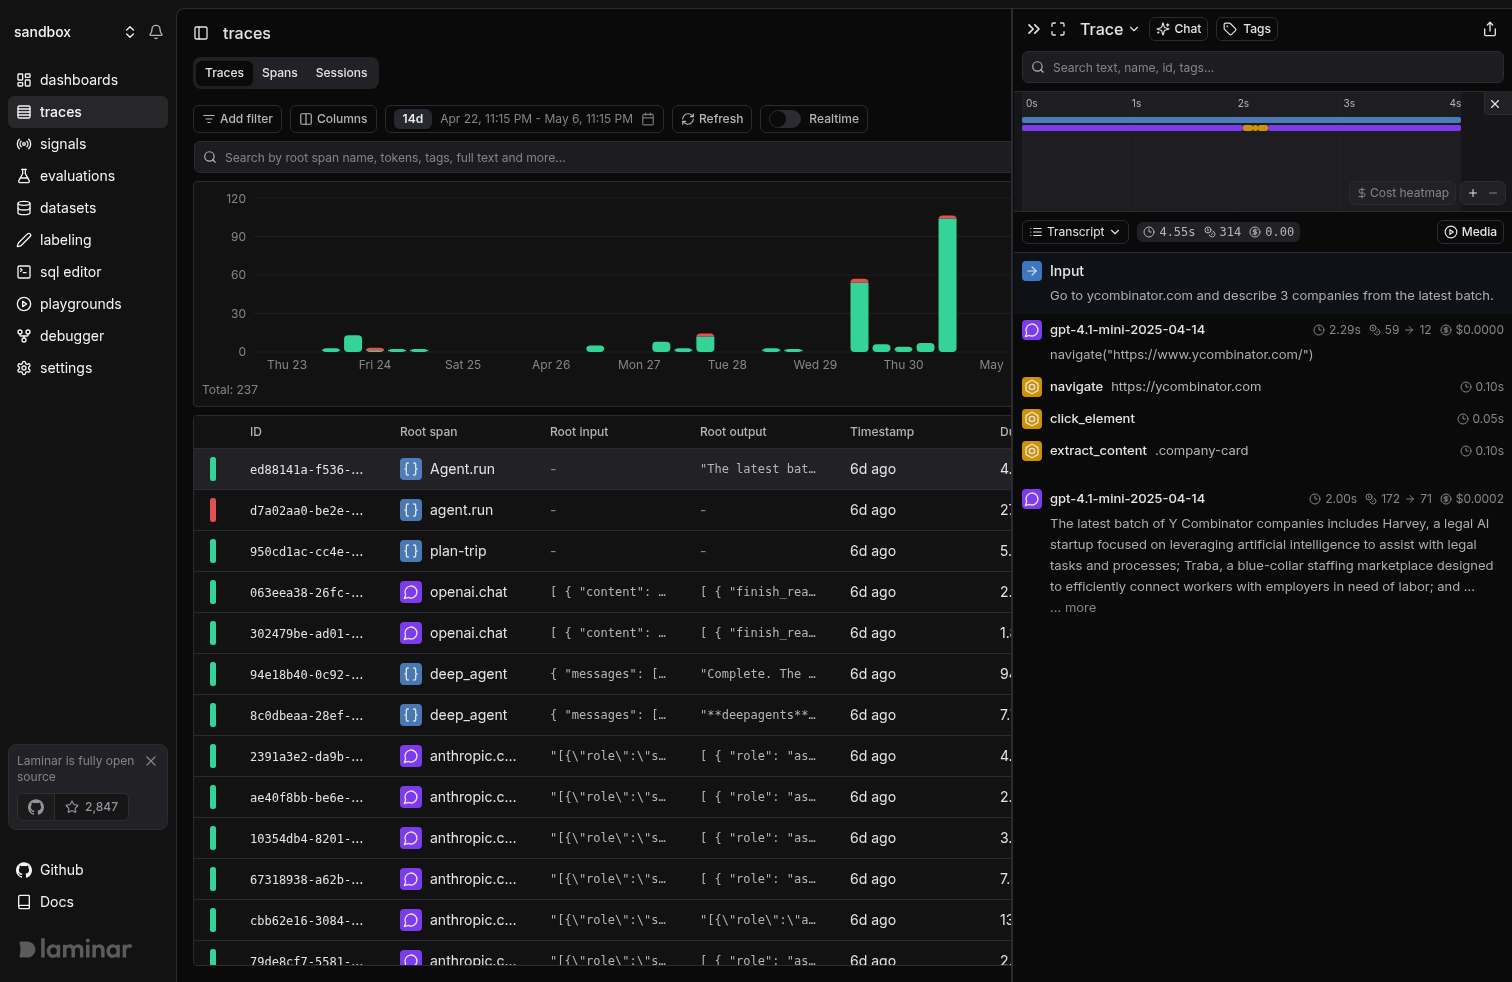
- Native OpenTelemetry SDK with gRPC exporter captures LLM calls, tool invocations, and sub-agent spans with 20x compression for efficient storage and retrieval.
- Code-First Evaluations
- Python and TypeScript SDK runs evals locally or in CI/CD with executor functions, dataset inputs, and numeric scoring evaluators — no proprietary DSL required.
- Custom Dashboards
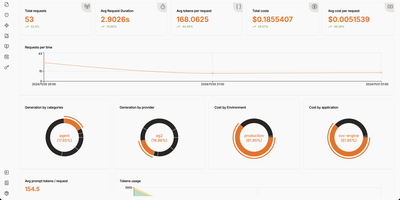
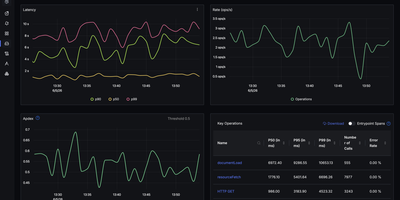
- SQL-powered dashboard builder creates real-time visualizations over traces, metrics, token costs, and signal events with full ClickHouse query support.
- MCP Server Integration
- Exposes query_laminar_sql, get_trace_context, and ask_agent tools for Claude Code, Cursor, and Codex to investigate production issues directly from the IDE.
- Data Annotation Studio
- Custom rendering UI for fast production trace labeling, dataset curation, and evaluation ground-truth creation with export to the eval SDK.
- Real-Time Trace Streaming
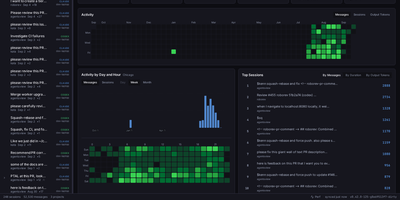
- Custom Rust engine streams spans as they arrive, rendering agent runs as human-readable transcripts with collapsible LLM turns and tool call cards.