Stars
Forks
Watchers
Developer links
Workbench
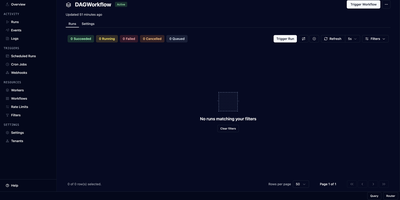
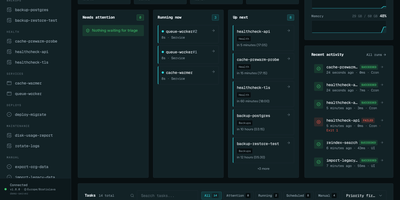
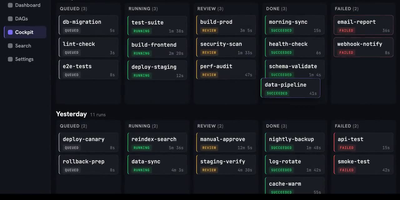
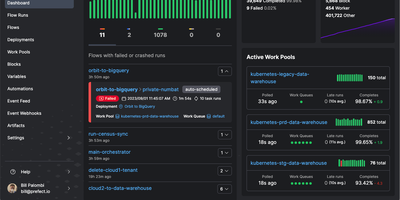
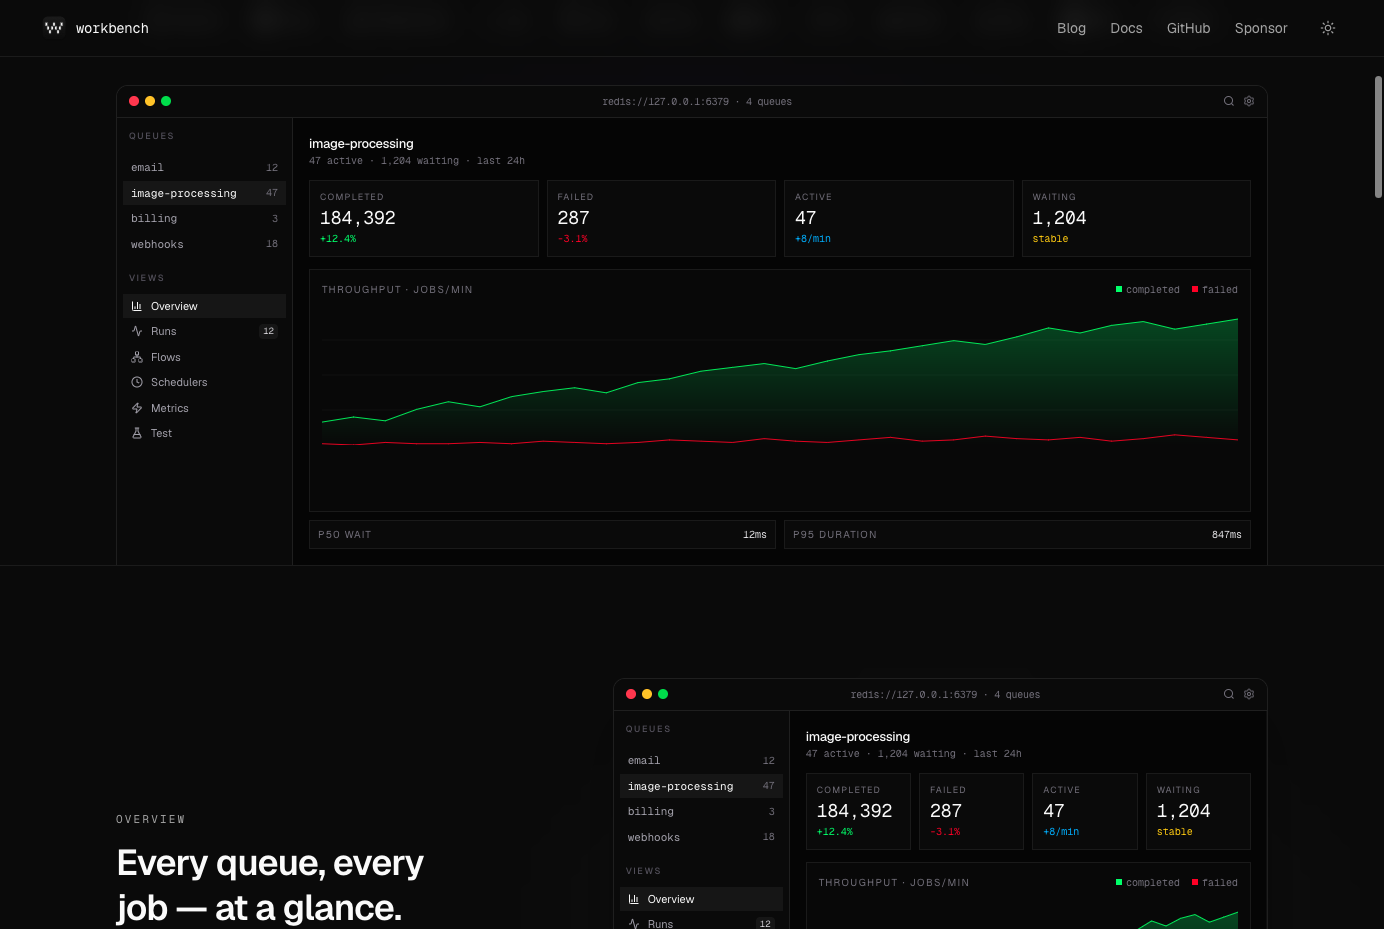
For teams running BullMQ, Workbench makes the inside of your job system visible, searchable, and fixable from a single browser dashboard. Live counters track completed, failed, active, and waiting jobs per queue alongside p50 and p95 latency and throughput, so a backing-up queue announces itself before your users do. Every run sits in a filterable table where you can expand the full payload and attempt history, retry with a keystroke, or click a line in a failed job's stack trace and land on that exact file in your editor. Failures are grouped by error class and ranked by frequency with a 24-hour trend, which makes a fresh regression obvious the moment it spikes. Parent and child jobs render as a real graph you can drill into and replay subtree by subtree, schedulers can be paused or edited without a redeploy, and new jobs can be enqueued from a form that validates the payload first. Running on a dedicated VPS on RepoCloud with guaranteed CPU, RAM, and SSD, full root SSH access, and a browser serial console. MIT licensed.
Benefits
- See Every Queue At Once
- Live completed, failed, active, and waiting counters update as workers move jobs, with p50 and p95 latency and throughput sparklines per queue, so queue health is visible without shelling into Redis.
- Failures Grouped, Not Buried
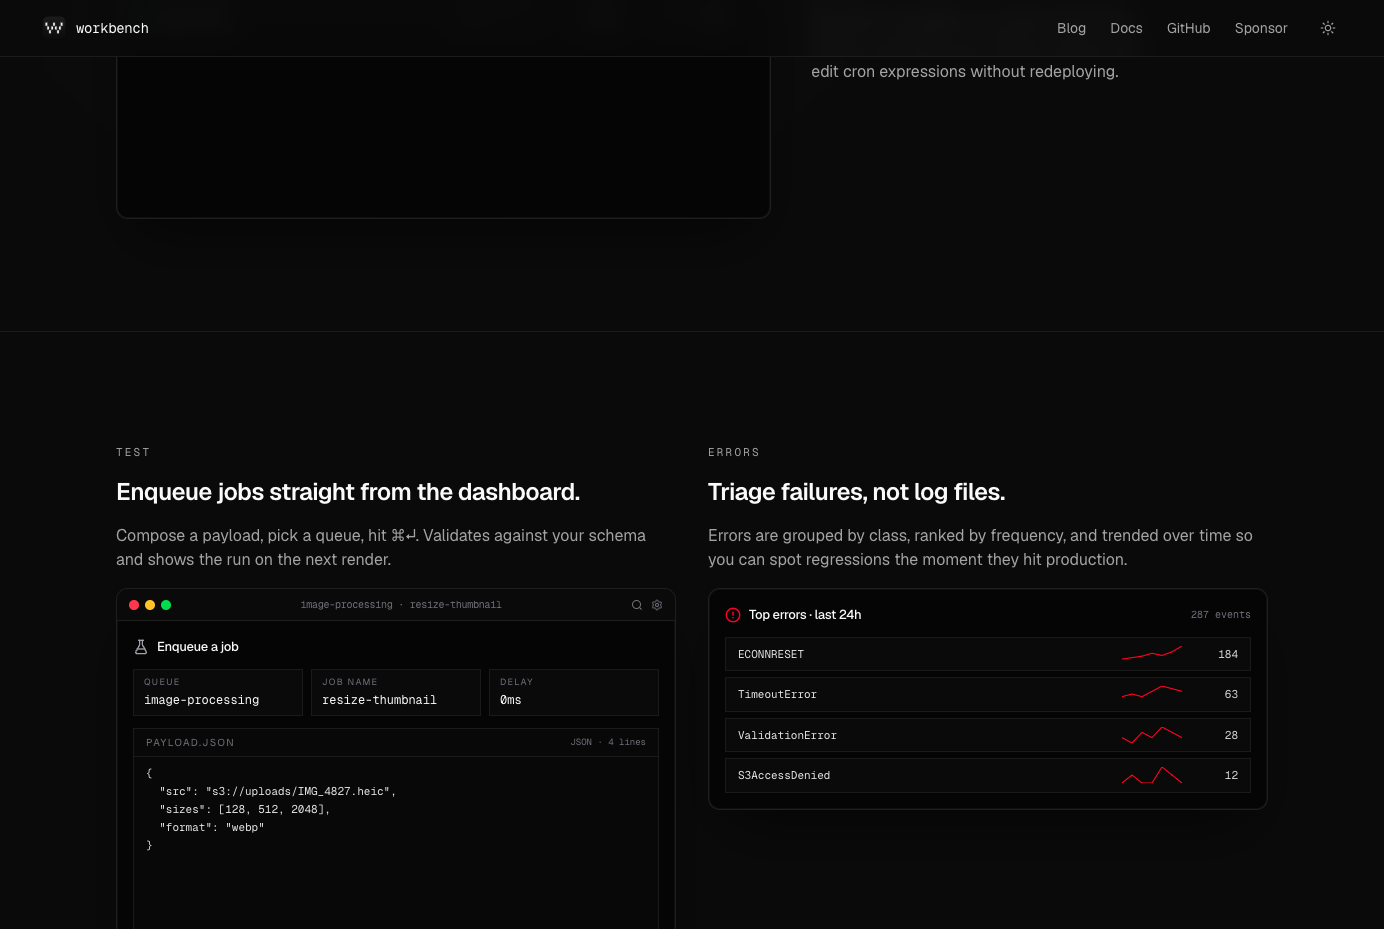
- Errors are grouped by class, ranked by frequency, and trended over 24 hours, and a click on any stack-trace line opens that file in Cursor or VS Code, turning log archaeology into triage.
- Flows You Can Replay
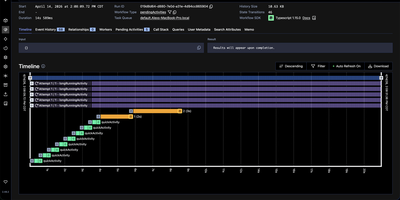
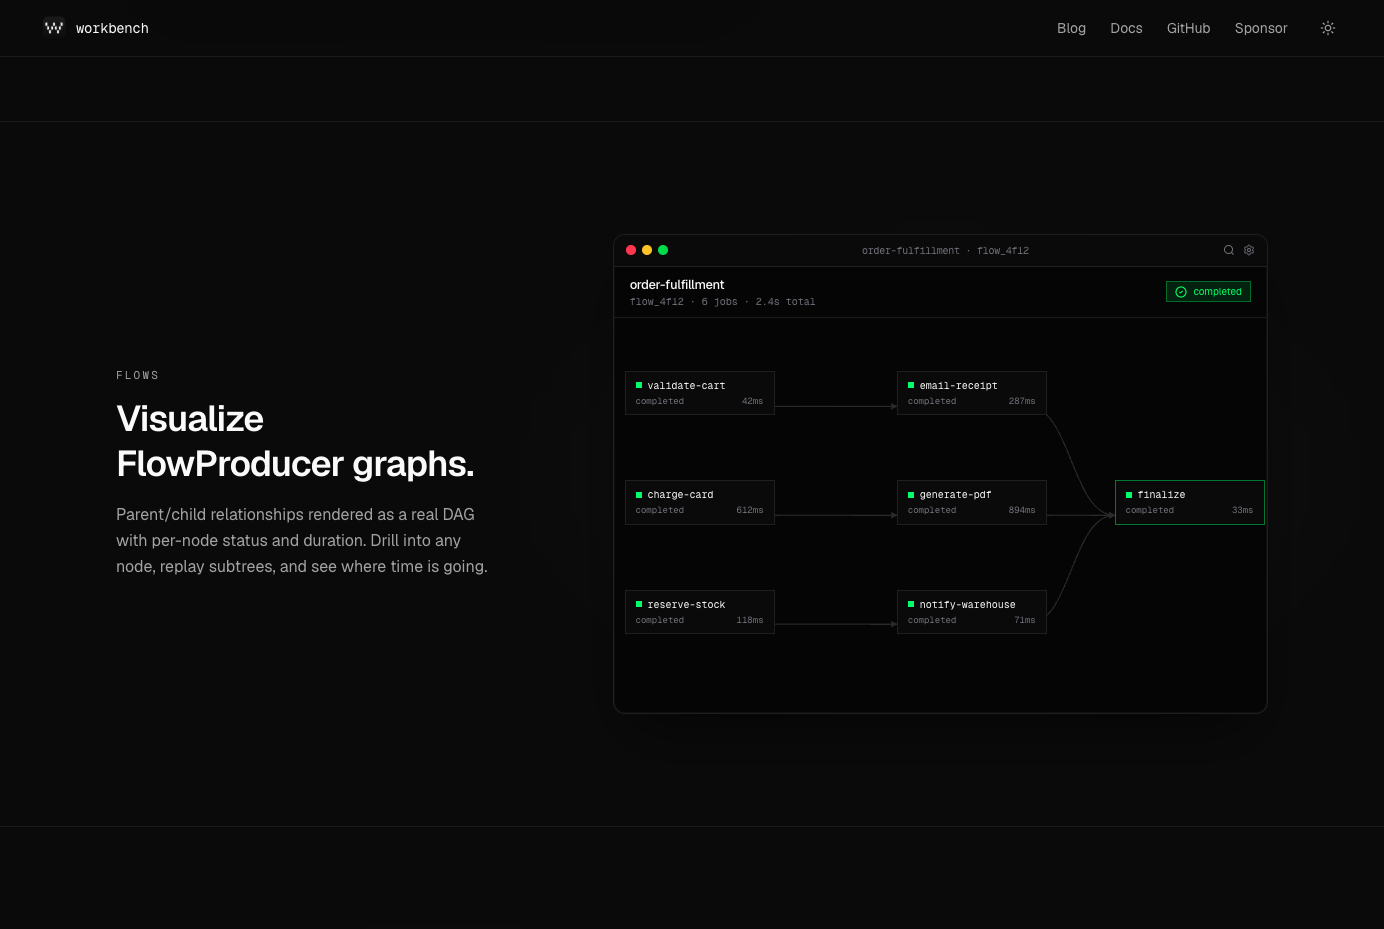
- FlowProducer parent and child jobs render as a DAG with per-node status and duration, and any subtree can be replayed, which shows exactly where a multi-step pipeline spends its time.
- Schedulers Without Redeploys
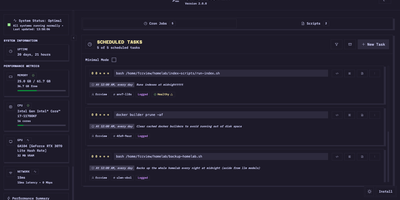
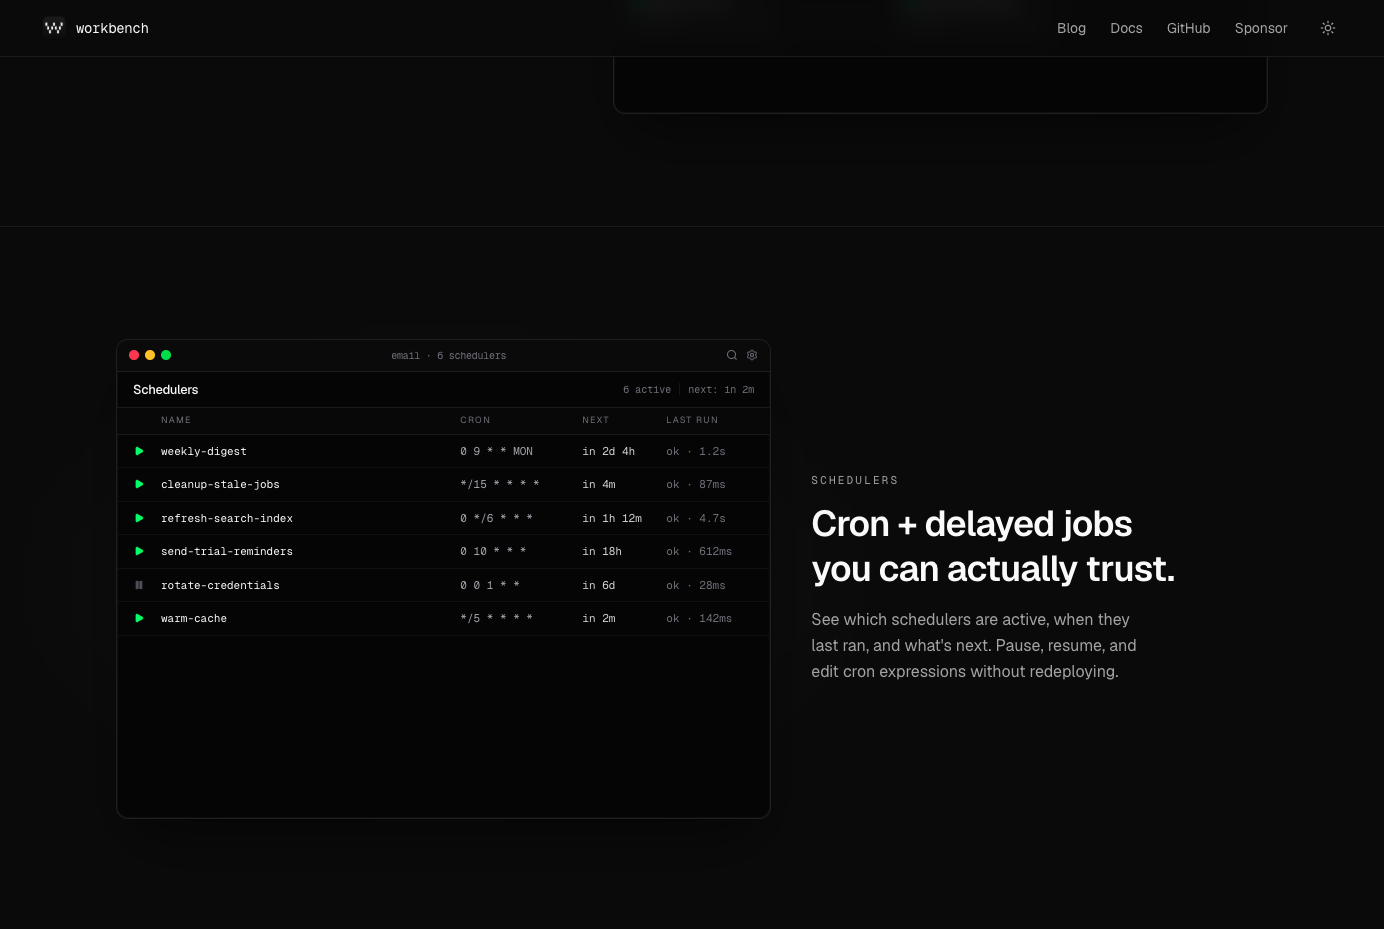
- Cron and delayed schedulers show when they last ran and what fires next, and can be paused, resumed, or edited from the dashboard, while a validated enqueue form fires one-off jobs instantly.
Features
- Run Inspector Table
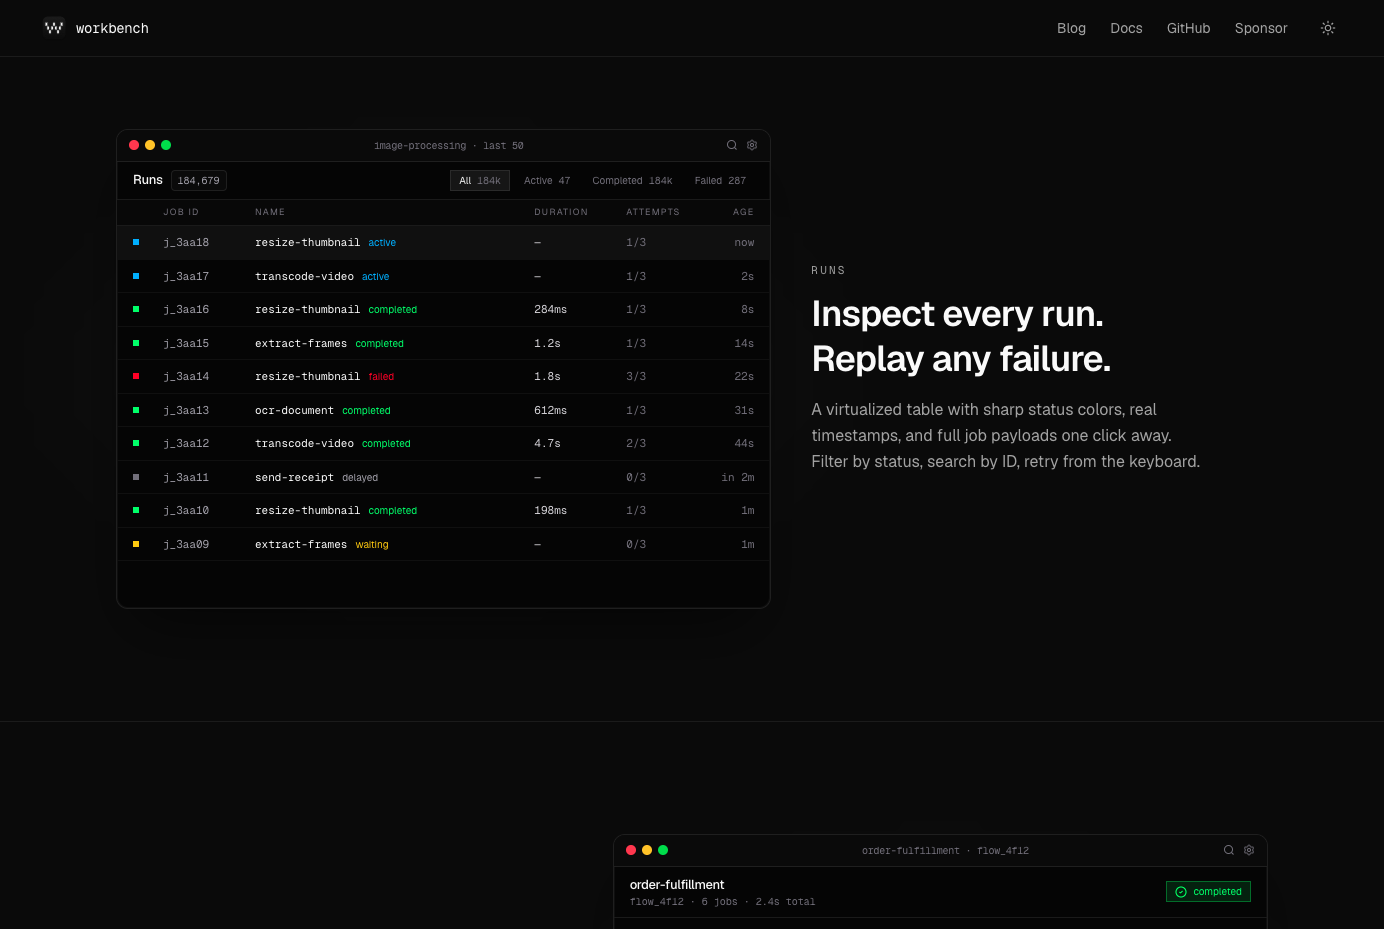
- A virtualized table lists every job across your queues with status filters and ID search, expanding inline to the full payload, logs, and attempts history for each run.
- FlowProducer DAG View
- Parent and child relationships render as an interactive graph with per-node status and duration, supporting drill-in and subtree replay for complex BullMQ flows.
- Error Triage Trends
- Failed jobs group by error class with frequency ranking and a 24-hour trend per class, and stack traces deep-link into Cursor or VS Code at the failing line.
- Scheduler Management
- View active cron and delayed schedulers with last and next run times, then pause, resume, or edit cron expressions from the UI without redeploying your workers.
- Thirteen Framework Adapters
- First-party packages mount the dashboard inside Hono, Express, Fastify, NestJS, Next.js, Nuxt, Astro, Koa, Elysia, AdonisJS, TanStack Start, Bun.serve, and h3 applications.
- Standalone Docker Container
- The GHCR standalone image serves the dashboard on port 3000 with only REDIS_URL and QUEUE_NAMES to set, basic auth enabled by default, plus an MCP server for editor chat clients.