Metabase
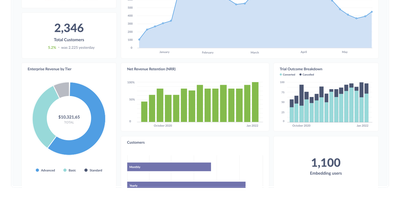
The most widely deployed open-source BI tool, Metabase is a visualization and query layer that sits on top of your existing databases without ingesting or copying data. Non-technical users ask questions through a visual query builder with drill-through menus that answer follow-ups like "broken down by month" without writing a new query, while analysts use the native SQL editor with variables and templates for complex work. Questions assemble into interactive dashboards with filters, auto-refresh, fullscreen mode, and custom click behavior, and dashboard subscriptions email or Slack scheduled reports to stakeholders. It connects to 20+ data sources including PostgreSQL, MySQL, MongoDB, SQL Server, BigQuery, Snowflake, Redshift, and ClickHouse - always querying in place, so there is no second data store to secure, sync, or pay for, and results are always current. Models and metrics let a data team define official, reusable starting points so self-service stays consistent, collections with permissions organize content, and alerts fire when a metric crosses a threshold. The practical effect is cutting the ad-hoc query queue that lands on the data team, since non-technical staff can answer their own questions. Written in Clojure, licensed AGPL, and shipped as a single JAR or Docker image with an embedded application database - a working BI instance runs before most tools finish their installer - the open-source edition has no limits on users, dashboards, or connected databases, where commercial BI platforms price per viewer as well as per creator.
Garage UI
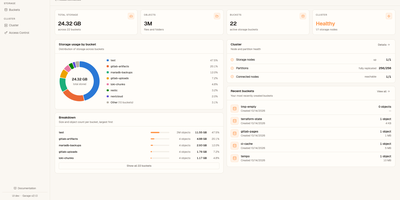
Garage UI is the web dashboard that Garage object storage never shipped, turning an admin API that speaks JSON over HTTP into screens your whole team can use. Create and configure buckets, browse objects with drag-and-drop uploads, and preview images, video, PDFs, and text inline instead of downloading files just to check what they are. A recursive search finds objects across a whole bucket, and bucket settings carry size and object-count quotas so one tenant cannot quietly eat the cluster. Access keys are created in the UI and assigned per-bucket permissions, replacing error-prone command-line key surgery. The cluster overview watches node status, layout configuration, and storage usage, so a degrading node shows up in the dashboard before it shows up as an outage. Sign-in flexes to your setup: no auth on a trusted network, basic admin credentials, the Garage admin token, or OIDC single sign-on through providers like Keycloak and Authentik. With OIDC teams enabled, access control maps token claims to bucket prefixes with named permission presets, and unmatched users are denied by default rather than promoted. Zero-config startup reads your existing garage.toml, so the first login takes minutes. Running on a dedicated VPS on RepoCloud with guaranteed CPU, RAM, and SSD, full root SSH access, and a browser serial console. MIT licensed.
CoreObs
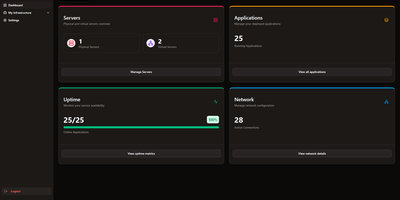
CoreObs delivers a unified self-hosted dashboard that replaces the typical combination of Uptime Kuma, Homer, and separate monitoring tools with a single interface for managing your entire server infrastructure. The Next.js frontend with shadcn components provides a modern dark-themed UI displaying server hardware metrics collected by a lightweight Go agent that leverages Glances for hardware abstraction — streaming real-time per-core CPU load, RAM utilization, NVIDIA GPU statistics, disk usage, system uptime, and load averages via WebSocket connections. The application registry tracks all self-hosted services with configurable uptime monitoring, availability history charts, and instant notifications through Discord, Telegram, Pushover, and email when services go down or recover. Quick-access links provide one-click navigation to each application's management panel directly from the dashboard. The network visualization module built on React Flow enables creating visual topology maps of your infrastructure with drag-and-drop nodes representing servers, switches, and services connected by labeled edges. Server data can be organized with tags, copied between entries, and monitored with configurable pagination and compact view modes. Deploy via Docker Compose with three containers — the Next.js web interface, the Go monitoring agent, and PostgreSQL 17 for persistent storage. Running on a dedicated VPS on RepoCloud with guaranteed CPU, RAM, and SSD, full root SSH access, and a browser serial console. MIT licensed.
MikroDash
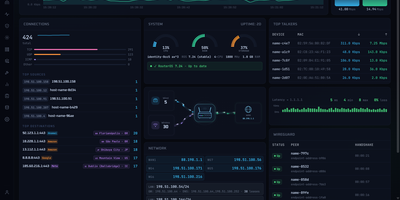
Watching a MikroTik RouterOS v7 router in real time is what MikroDash is for: live traffic, connections, Wi-Fi clients, DHCP leases, and WireGuard peers reach the browser the moment anything changes. Cards drag into any layout, and the arrangement follows your account to every browser. Managing a fleet happens on the Devices page, which shows routers as cards, a list, or a world map with 24-hour connectivity, last backup, open alerts, and pending updates. Rolling out a change starts in Config Management: choose one of 20 ready-made templates or capture your own, then deploy to one router or the fleet with a restore point, a canary router, and an automatic revert if a change cuts MikroDash off. Scheduled backups are kept only when something changed, with a diff and a guarded restore. New sites join through a generated script that calls home over a built-in WireGuard tunnel, even from behind NAT. Alerts reach SMTP, Telegram, ntfy, Discord, Slack, Gotify, Pushover, and Apprise. Troubleshooting stays in the browser with ping, traceroute, torch, bandwidth tests, a packet sniffer, and a RouterOS terminal. Read-only API access covers every page and alert, while roles, OpenID Connect sign-in, and an audit trail of every write govern shared use. Off by default, an optional assistant answers from live router data and asks before changing anything. Running on a dedicated VPS on RepoCloud with guaranteed CPU, RAM, and SSD, full root SSH access, and a browser serial console. MIT licensed.
portracker
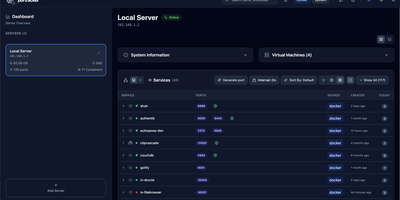
No spreadsheet has to track which service owns which port, because portracker discovers every service and port on your servers and keeps the list current from a self-hosted dashboard. Begin with a single port, shown with its owning service, its source (Docker or the host system), and its address, with internal container ports told apart from ports published to the host. Step back and ports gather into services: expandable cards carrying an icon, a health dot, and a port count, in list, grid, or table layouts, where a Why this status popover names the failing component and the rule that fired. Step back again and each server gets its own panel with hostname, OS, CPU, memory, and uptime, plus TrueNAS apps, VMs, and LXC containers once an API key is added. Step back once more and the whole fleet appears, because other portracker instances can be linked as peers, a VM's instance can be nested under its host, and every server can be searched at once. Along the way, rename services, hide the noisy ones, attach notes, act on a selection in bulk, or press Generate port for an unused number before deploying something new. Optional sign-in with a first-run setup wizard, an autoxpose link that shows public URLs and SSL status, light and dark themes, and keyboard shortcuts finish the picture. Running on a dedicated VPS on RepoCloud with guaranteed CPU, RAM, and SSD, full root SSH access, and a browser serial console. MIT licensed.
Liwan
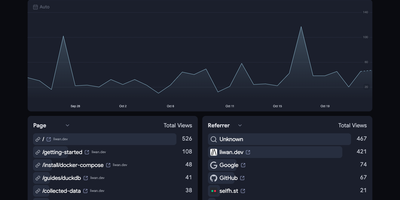
When you want honest traffic numbers without tracking cookies or stored IP addresses, Liwan puts a real-time analytics dashboard on your own server. The dashboard ranks pages, referrers, countries, browsers, platforms, and devices, charts visitors over time, and filters out bot traffic by default. Session metrics add bounce rate, average time on site, and entry and exit pages, while UTM fields attribute visits to campaigns. Collection is adjustable globally and per site: choose how visitors are grouped, whether to store country and city, country only, or no location, and how long events are kept. Drop rules discard internal, test, and local traffic before storage, and a pruning tool applies new settings to history after a dry-run preview. Tracking is one line of HTML, or your own server can send events with custom names and properties. Location can come from a MaxMind database or from Cloudflare, Vercel, and other proxy headers. One instance holds several projects and sites, with team accounts and single sign-on through Google Workspace, Microsoft Entra ID, or an OpenID Connect provider such as Keycloak or Dex. Running on a dedicated VPS on RepoCloud with guaranteed CPU, RAM, and SSD, full root SSH access, and a browser serial console. Apache-2.0 licensed.
Home Screens
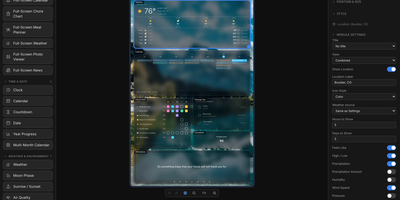
The family calendar is split across phones, the meal plan lives in someone's head, and the chore chart fell off the fridge: Home Screens turns a spare screen into a self-hosted family command center that puts calendars, weather, chores, meal plans, and photos on one shared display. You compose each screen in a drag and drop editor, placing any of 46 built in modules on a configurable canvas: clocks in 18 styles, weather in 14 views, calendars, to do lists, news, stock and crypto tickers, sports scores and standings for 15 leagues, traffic, air quality, and moon phases. Screens rotate through seven transitions, and a hub and spoke setup lets one server drive several physical displays, each with its own layout, dimensions, rotation, and scheduled profile. The phone remote wakes or sleeps displays, adjusts brightness, starts visual timers and morning routines, and runs the family organizer: chore charts with rewards, a meal planner with grocery list, shared to do lists, school timetables, and a notes board. Calendars arrive from Google, iCloud, or any iCal feed, weather from nine providers, and backgrounds from your uploads, Unsplash, NASA, Immich, Google Photos, iCloud, or OneDrive. Modules can appear or hide based on live conditions, plugins add new module types from a directory or a URL, and everything is stored locally with no cloud account. Running on a dedicated VPS on RepoCloud with guaranteed CPU, RAM, and SSD, full root SSH access, and a browser serial console. MIT licensed.
Pipedash
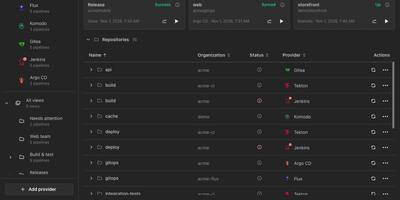
Pipedash unifies pipelines from twelve CI/CD providers into one self-hosted dashboard for watching statuses, reading job logs, and triggering, rerunning, or cancelling runs without opening each provider's site. Connect GitHub Actions, Gitea Actions, GitLab CI, Azure DevOps, Bitbucket, Buildkite, Jenkins, Tekton, ArgoCD, FluxCD, Komodo, or Prow, and every workflow lands in one list grouped by repository. Filters narrow by status, provider, organization, or time range, and saved views with rules, sub views, and pins give each team its own shortlist. Run history records each attempt with its commit, branch, actor, and duration, and opening a run reveals its jobs and a searchable log viewer that streams live output. Trigger forms load the workflow's own inputs, pipeline variables, or job parameters from the provider, so parameterized runs start with real values. Reruns reuse the original inputs, GitHub runs can restart only failed jobs, and stuck builds can be cancelled singly, in bulk, or by repository. Metrics charts track duration, success rate, and run counts per pipeline by hour, day, week, or month with P95 and P99 values. A notifications inbox gathers failures, degraded workloads, long running builds, and provider outages, while health panels place status pages beside the pipelines they describe. Every dashboard action is a REST API route under /api/v1 with bearer authentication, provider tokens stay encrypted at rest, and the server sends no telemetry. Running on a dedicated VPS on RepoCloud with guaranteed CPU, RAM, and SSD, full root SSH access, and a browser serial console. GPL-3.0 licensed.
LightDash
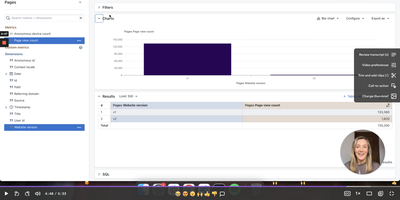
With 5,600+ GitHub stars and deep dbt integration, Lightdash is the open-source Agentic BI platform that treats analytics like software — defining metrics, dimensions, joins, permissions, and caching in a governed context layer that powers dashboards, AI agents, data apps, embedded analytics, and MCP server endpoints simultaneously. The dbt Write-Back feature lets business users create custom metrics and models in the UI, then automatically generates pull requests in GitHub or GitLab so every change flows through code review and CI validation before reaching production. Context-specific AI analysts automatically select relevant models and metrics, build queries, and present insights in plain English, while row-level security, user attributes, and customer-facing permissions ensure data governance at every layer. The platform connects to BigQuery, Snowflake, Redshift, Databricks, PostgreSQL, Trino, and ClickHouse through warehouse adapters, with the TypeScript monorepo built on React, Mantine, Vite, and TanStack Query on the frontend plus Node.js, Express, Knex, and PostgreSQL on the backend. Data teams build analytics with coding agents, preview changes from the CLI, validate in CI pipelines, and review charts and dashboards in pull requests — making the entire analytics lifecycle version-controlled and reproducible. Running on a dedicated VPS on RepoCloud with guaranteed CPU, RAM, and SSD, full root SSH access, and a browser serial console. MIT licensed.
Chartbrew
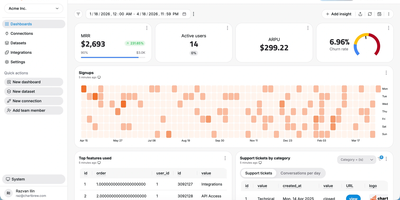
Chartbrew transforms raw database queries and API responses into polished, shareable dashboards without requiring a data engineering team. Connect to MySQL, PostgreSQL, MongoDB, Firestore, or any REST API, then build datasets using the visual query editor with syntax highlighting and auto-completion. Charts render through Chart.js with line, bar, pie, donut, radar, polar, KPI card, and table visualizations, each customizable with colors, legends, filters, and goal indicators. An AI assistant accelerates dashboard creation by generating queries and suggesting chart configurations from natural language descriptions of the metrics you want to track. Reusable datasets let teams prepare data transformations once and share them across multiple charts, while automatic scheduling through BullMQ and Redis refreshes data at intervals from every 10 minutes to monthly. The embed feature generates standalone chart URLs for insertion into external websites, internal tools, or customer portals, and the Reporting API enables programmatic dashboard management and automated report delivery. Team workspaces with role-based permissions control who can view, edit, or manage data connections. Nearly 4,000 GitHub stars reflect steady community adoption. The platform runs on Node.js with Express and Sequelize ORM, supporting MySQL or PostgreSQL as its application database. Running on a dedicated VPS on RepoCloud with guaranteed CPU, RAM, and SSD, full root SSH access, and a browser serial console. FSL-1.1-MIT licensed (converts to MIT two years after each release).
CLIProxyAPI Dashboard
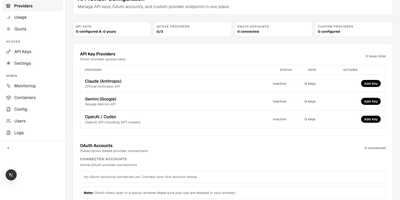
CLIProxyAPI Dashboard puts a web console in front of CLIProxyAPI so you manage AI providers, keys, quotas, and containers through forms instead of YAML files. Connect Claude Code, Codex, xAI, Antigravity, Kimi, and Devin accounts with OAuth, then add Gemini CLI, GitHub Copilot, Kiro, and Cursor through plugins you install and configure from the settings store. Any OpenAI-compatible endpoint can join as a custom provider with model mappings, and admins can mark a provider as shared so the whole team uses it. You create, revoke, and track API keys with per-user ownership, manage dashboard users and admin rights, and stream live logs beside container health. Quota views track rate limits per provider and per model, and Telegram alerts fire when remaining quota drops below your threshold. Usage analytics break down request counts, provider share, model statistics, error rates, and estimated cost. Configuration syncs to OpenCode automatically, model configurations travel as share codes, and backups can be created, scheduled, previewed, and restored from settings. One-click updates refresh the dashboard and proxy images, containers start and stop from the panel, and automatic TLS keeps the console reachable under your domain. Running on a dedicated VPS on RepoCloud with guaranteed CPU, RAM, and SSD, full root SSH access, and a browser serial console. MIT licensed.
Blocky UI
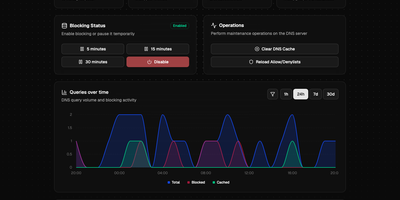
BlockyUI gives your Blocky DNS server a clean browser dashboard for seeing what gets queried, what gets blocked, and how quickly answers come back. Overview cards show total queries, blocked requests, cache hit rate, listed domains, and average response time. Pause blocking for 5, 15, or 30 minutes with one click, or disable it outright, then let it return on its own. Clear the DNS cache and reload allow and deny lists without touching the command line. A queries over time chart switches between 1 hour, 24 hours, 7 days, and 30 days, with filters for a single domain or client. Paginated top lists rank the busiest domains and devices and offer a blocked-only view. The query tool tests how any domain resolves, so a new filtering rule can be checked in seconds. Query logs are searchable and filterable by reason and record type, and they read from MySQL, PostgreSQL, Timescale, SQLite, CSV, or VictoriaLogs. Panels that depend on logging or statistics appear when your Blocky instance supports them, and the dashboard adapts otherwise. Settings live in one YAML file that points at your Blocky server. Running on a dedicated VPS on RepoCloud with guaranteed CPU, RAM, and SSD, full root SSH access, and a browser serial console. MIT licensed.
Homarr
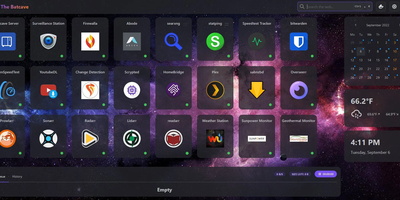
A single pane of glass for every service you run, arranged by drag-and-drop with no YAML or JSON files: Homarr is the modern dashboard for self-hosted infrastructure. Its grid system arranges apps, widgets, and bookmarks on desktop or touch, backed by an icon picker with over 11,000 icons. What separates Homarr from static launchers is 50+ live integrations: Plex, Jellyfin, and Emby media stats, the *arr suite (Sonarr, Radarr) with a unified release calendar, download clients, Pi-hole and AdGuard Home controls, Proxmox, Home Assistant, OPNsense, and Unifi monitoring. Widgets update in real time over WebSockets (tRPC and Redis under the hood), and a built-in search queries thousands of data points across connected services. Custom widgets extend the reach to any HTTP API without code: define endpoint, auth, and refresh interval in the management UI, then render responses as stat grids, tables, progress bars, status indicators, action buttons, or full custom JSX layouts - with an AI-prompt helper for generating templates. Multi-user support is first-class: credentials, OIDC, or LDAP sign-on, groups with granular permissions, and secrets encrypted with AES-256-CBC. A robust background-job system scales it from a Raspberry Pi homelab to deployments serving hundreds of users.
OpenClaw Dashboard
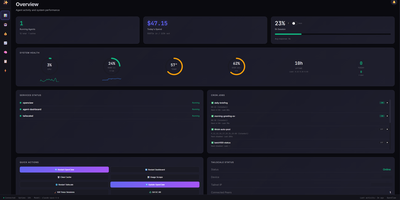
OpenClaw Dashboard is a secure real-time monitoring dashboard for OpenClaw AI agents that tracks live sessions, API costs, rate limits, and host health from one browser page. The overview refreshes every five seconds with live session activity, token totals, and lifetime spending, so you can see what every agent is doing right now. Cost views break spending down by model, session, and time period, and rate limit panels track Claude and Gemini usage against rolling windows with browser alerts before quotas run out. A live feed streams agent messages across all sessions, and a session browser adds search, status filters, timelines, and a 30 day activity heatmap. You can read agent memory files (MEMORY.md, HEARTBEAT.md, daily notes) and edit workspace files, skills, and configuration with JSON validation and automatic backups. Host panels report CPU, memory, disk, and temperature with 24 hour sparklines, plus Docker containers, cron jobs, real-time logs, and one-click service restarts. A security page shows firewall rules, open ports, fail2ban status, and SSH login history, and sign-in uses PBKDF2 hashed passwords with optional TOTP two-factor codes. Running on a dedicated VPS on RepoCloud with guaranteed CPU, RAM, and SSD, full root SSH access, and a browser serial console. MIT licensed.
HomeHub
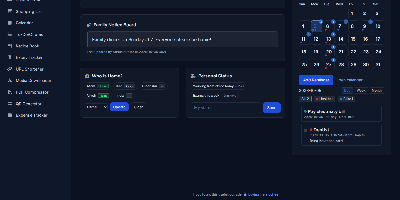
HomeHub gives a household one private page for the everyday coordination that usually scatters across chat threads, fridge notes, and five separate apps. Pin shared notes where everyone sees them, drop files into the shared cloud for the house, and keep one shopping list the whole family edits, with suggestions drawn from what you bought before. Chores become a shared checklist, the calendar holds the dates that matter, and a who's-home view answers the question every family group chat asks in the evening. The expense tracker follows family spending and handles recurring bills like the milk, the newspaper, and subscriptions, while the recipe book and expiry tracker keep the kitchen honest. Small utilities round it out: download media straight to the server, shorten URLs, compress PDFs, generate QR codes, and check the weather without leaving the hub. Every feature toggles on or off in one config file, themes recolor the interface, and there is no account system at all, because the hub trusts your home network instead of a password database. It runs happily on a Raspberry Pi, installs as a PWA on phones, and keeps uploads, media, and data in mounted folders you can back up with any file tool. Running on a dedicated VPS on RepoCloud with guaranteed CPU, RAM, and SSD, full root SSH access, and a browser serial console. MIT licensed.
CashPilot
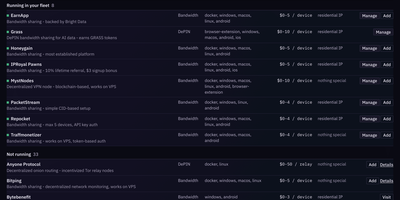
Idle bandwidth and spare hardware earn nothing sitting unused, so CashPilot deploys passive-income services across your servers and shows every balance in one web dashboard. From the catalog you start Docker earners such as Honeygain, Earn.fm, Traffmonetizer, PacketStream, ProxyRack, MystNodes, Storj, and Sia hostd with one click, no compose files to write, and you can add any service the catalog lacks by image name under the same container restrictions. Providers that run as browser extensions, desktop apps, or GPU nodes, 24 of them, are tracked alongside, while 15 built-in collectors read balances every hour into a single earnings history, so a service that runs without earning shows up as a flat line instead of a surprise. When a balance drops, CashPilot treats it as a probable payout and asks you to confirm rather than counting income by guesswork. One worker runs on each server under a single dashboard, with every figure broken down per server and per service. Extra copies of a service can earn through SOCKS5, HTTP CONNECT, or Tailscale exit-node proxies and stop dead if the proxy dies instead of leaking your real address. Earners are fenced off from your LAN, the host, your tailnet, and cloud metadata by default, and per-service guides flag restrictions such as providers that ban datacenter IPs. Running on a dedicated VPS on RepoCloud with guaranteed CPU, RAM, and SSD, full root SSH access, and a browser serial console. GPL-3.0 licensed.

TeslaLogger
TeslaLogger records everything your Tesla or Lucid Air does and stores it on hardware in your own home, building a private history no subscription service controls. Trips are logged with consumption and efficiency, charging sessions capture curves and history, and battery degradation and capacity are tracked over years of ownership. Grafana dashboards visualize consumption, trips, charging statistics, and battery health, and the admin panel's own dashboard can be customized for a quick glance. Public fleet statistics compare your degradation and charging curves against other owners, alongside firmware tracking and a map of fast charging sessions. Custom points of interest label the places your car visits, geofencing data organizes trips by location, and Supercharger invoices download automatically into a local folder. Existing histories import from TeslaFi or TeslaMate, so switching loggers does not erase years of records. A route planner link shares data with A Better Route Planner without handing your account to a third party or keeping the car awake. Eleven interface languages cover most households, and the same software runs in Docker, on a Synology NAS, or on a small Raspberry Pi beside the router, quietly logging through the official Fleet API permissions. Running on a dedicated VPS on RepoCloud with guaranteed CPU, RAM, and SSD, full root SSH access, and a browser serial console. GPL 3.0 licensed.
ServerBee
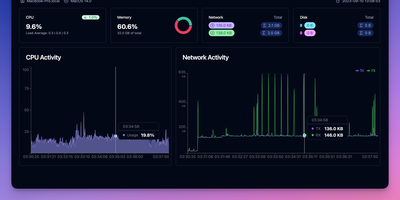
ServerBee delivers complete fleet monitoring from a single Rust binary that embeds both the server and web UI, requiring no external database or heavy runtime. Lightweight agents installed on each node stream CPU, memory, disk, network, load, temperature, GPU, and disk I/O metrics over persistent WebSocket connections to a central server backed by embedded SQLite. The real-time React dashboard presents 17 drag-and-drop widget types across custom layouts, with historical charts spanning one hour to 30 days and monthly traffic statistics with billing-cycle prediction and cost insights including burn rate and per-resource unit cost scoring. Network monitoring covers ICMP, TCP, and HTTP ping probes, service monitors for SSL certificates, DNS records, HTTP keyword matching, TCP ports, and WHOIS expiration, plus network-quality probing across 96 China 3-ISP and international presets with IP-quality and streaming-unlock detection. Remote management features include a web terminal with sandboxed file manager, Docker container stats with logs and events, firewall configuration, and agent auto-update capabilities. Public status pages display 90-day uptime timelines, while alerting supports email and webhook notifications with flexible trigger expressions. A native iOS companion app provides mobile monitoring access. Deploy via Docker or download the single binary for Linux, macOS, or Windows, running on a dedicated VPS on RepoCloud with guaranteed CPU, RAM, and SSD, full root SSH access, and a browser serial console. AGPL-3.0 licensed.