Categories
Analytics Dashboard Business Intelligence Data Visualization Reporting Charts KPI TrackingStars
Forks
Watchers
Developer links
Chartbrew
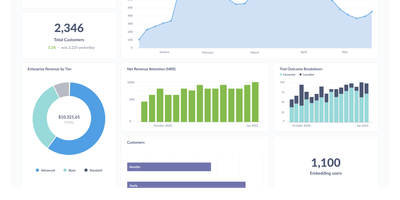
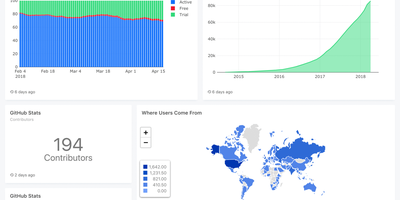
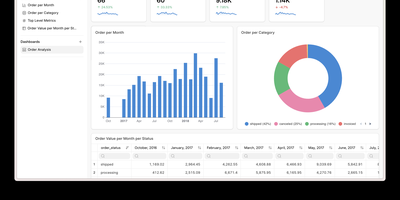
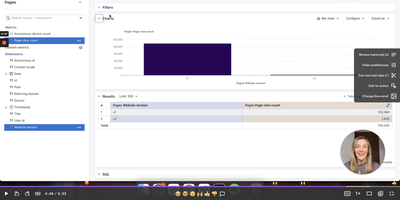
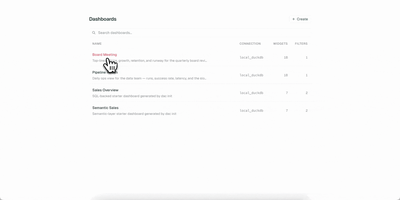
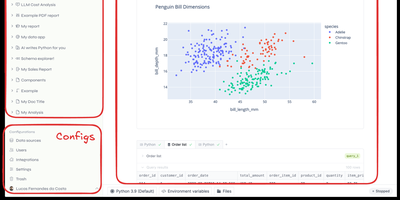
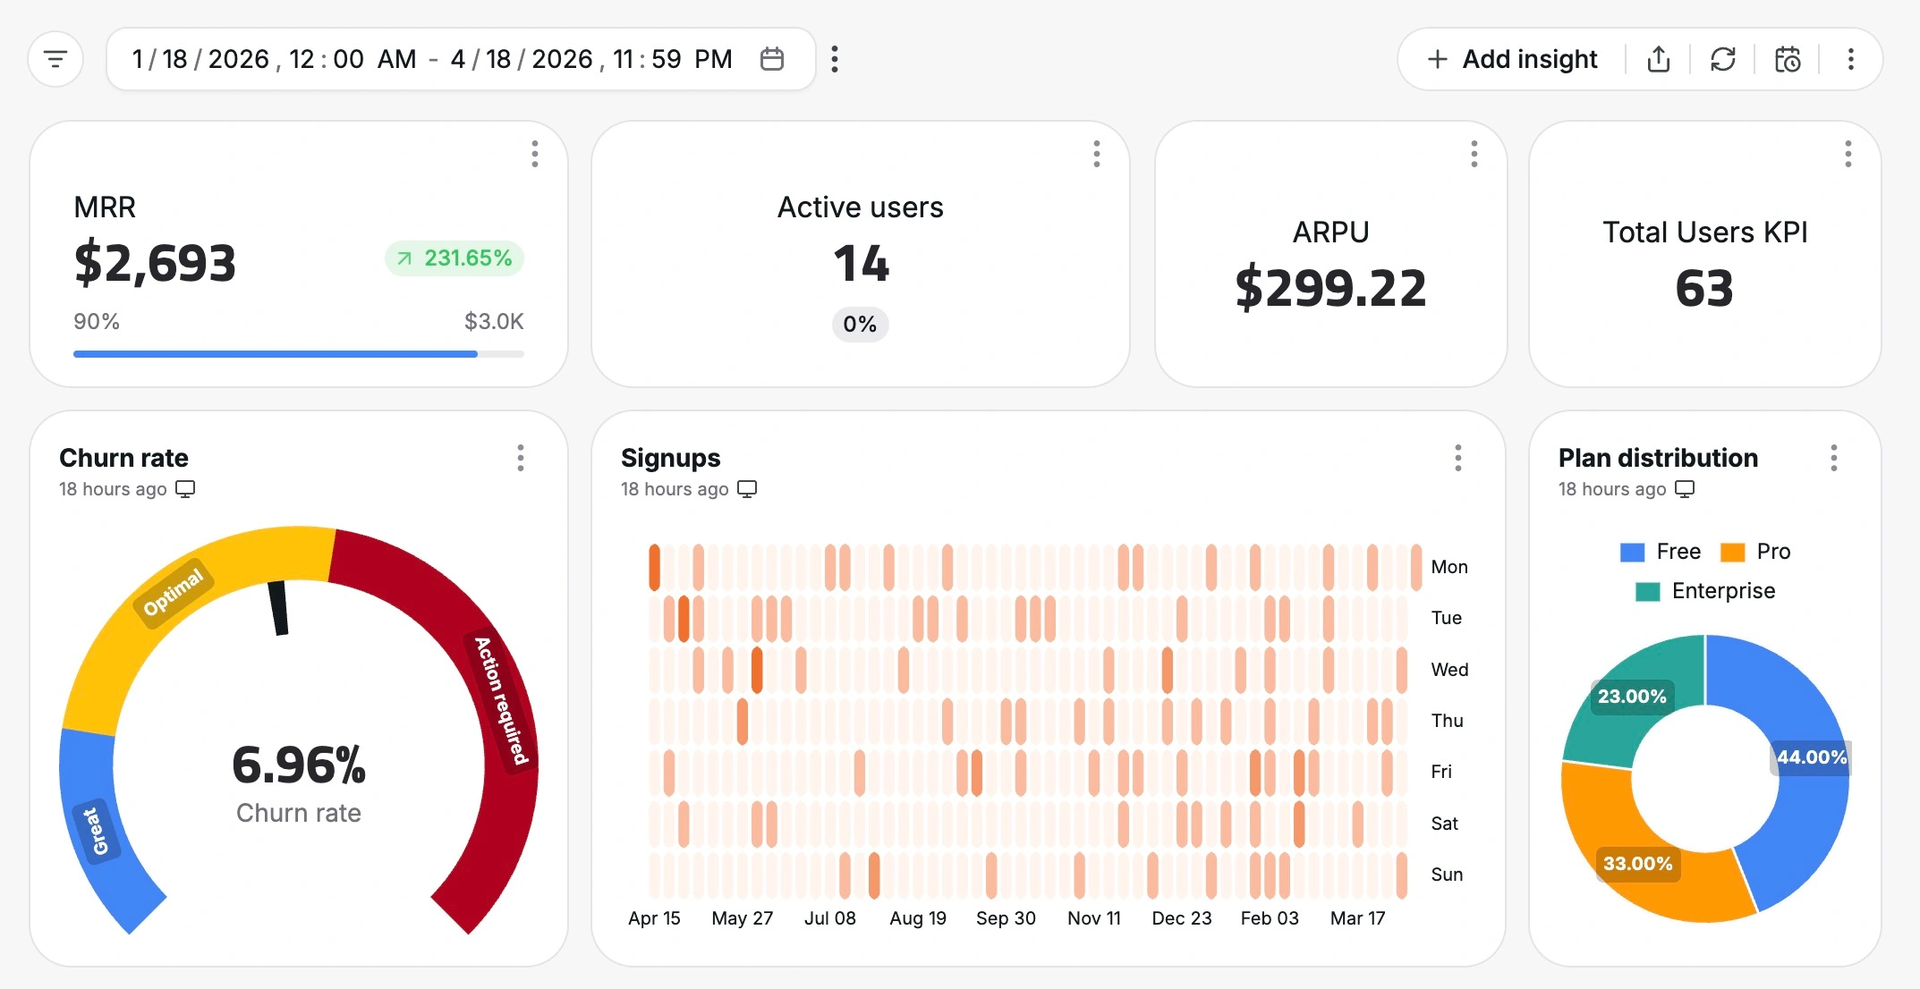
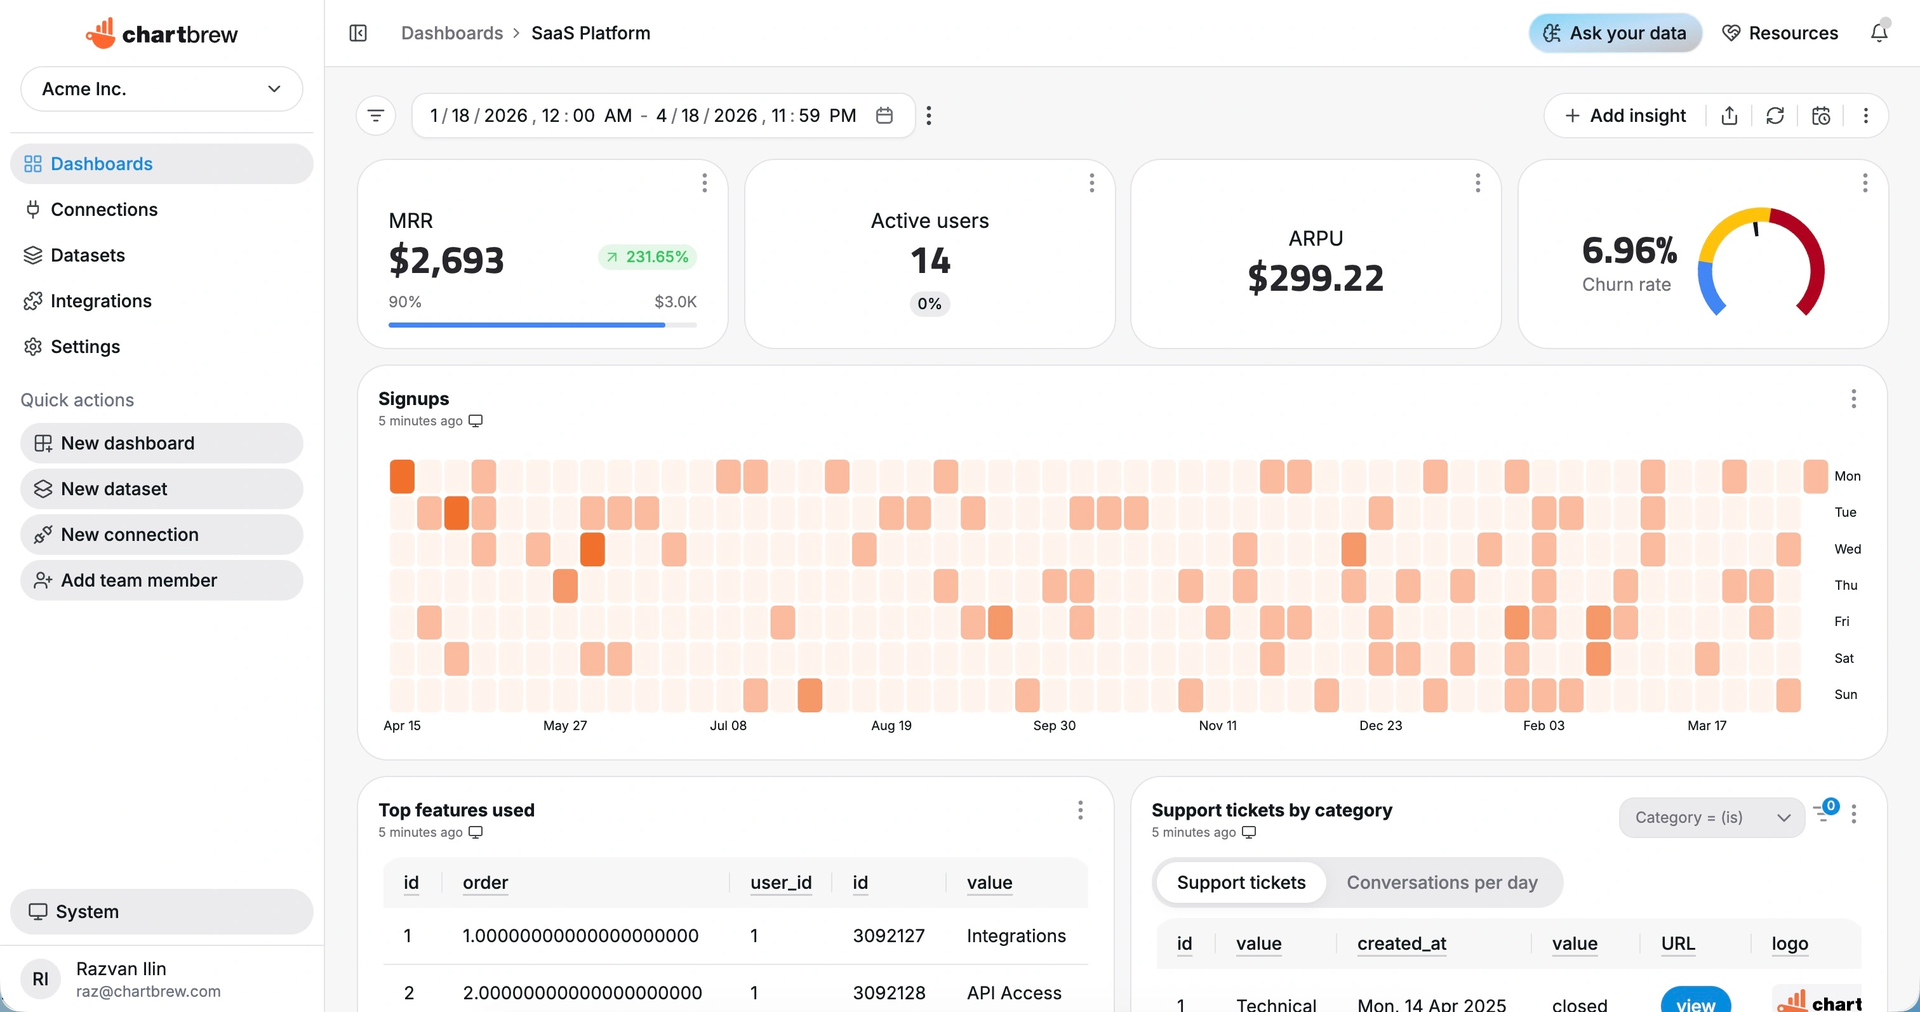
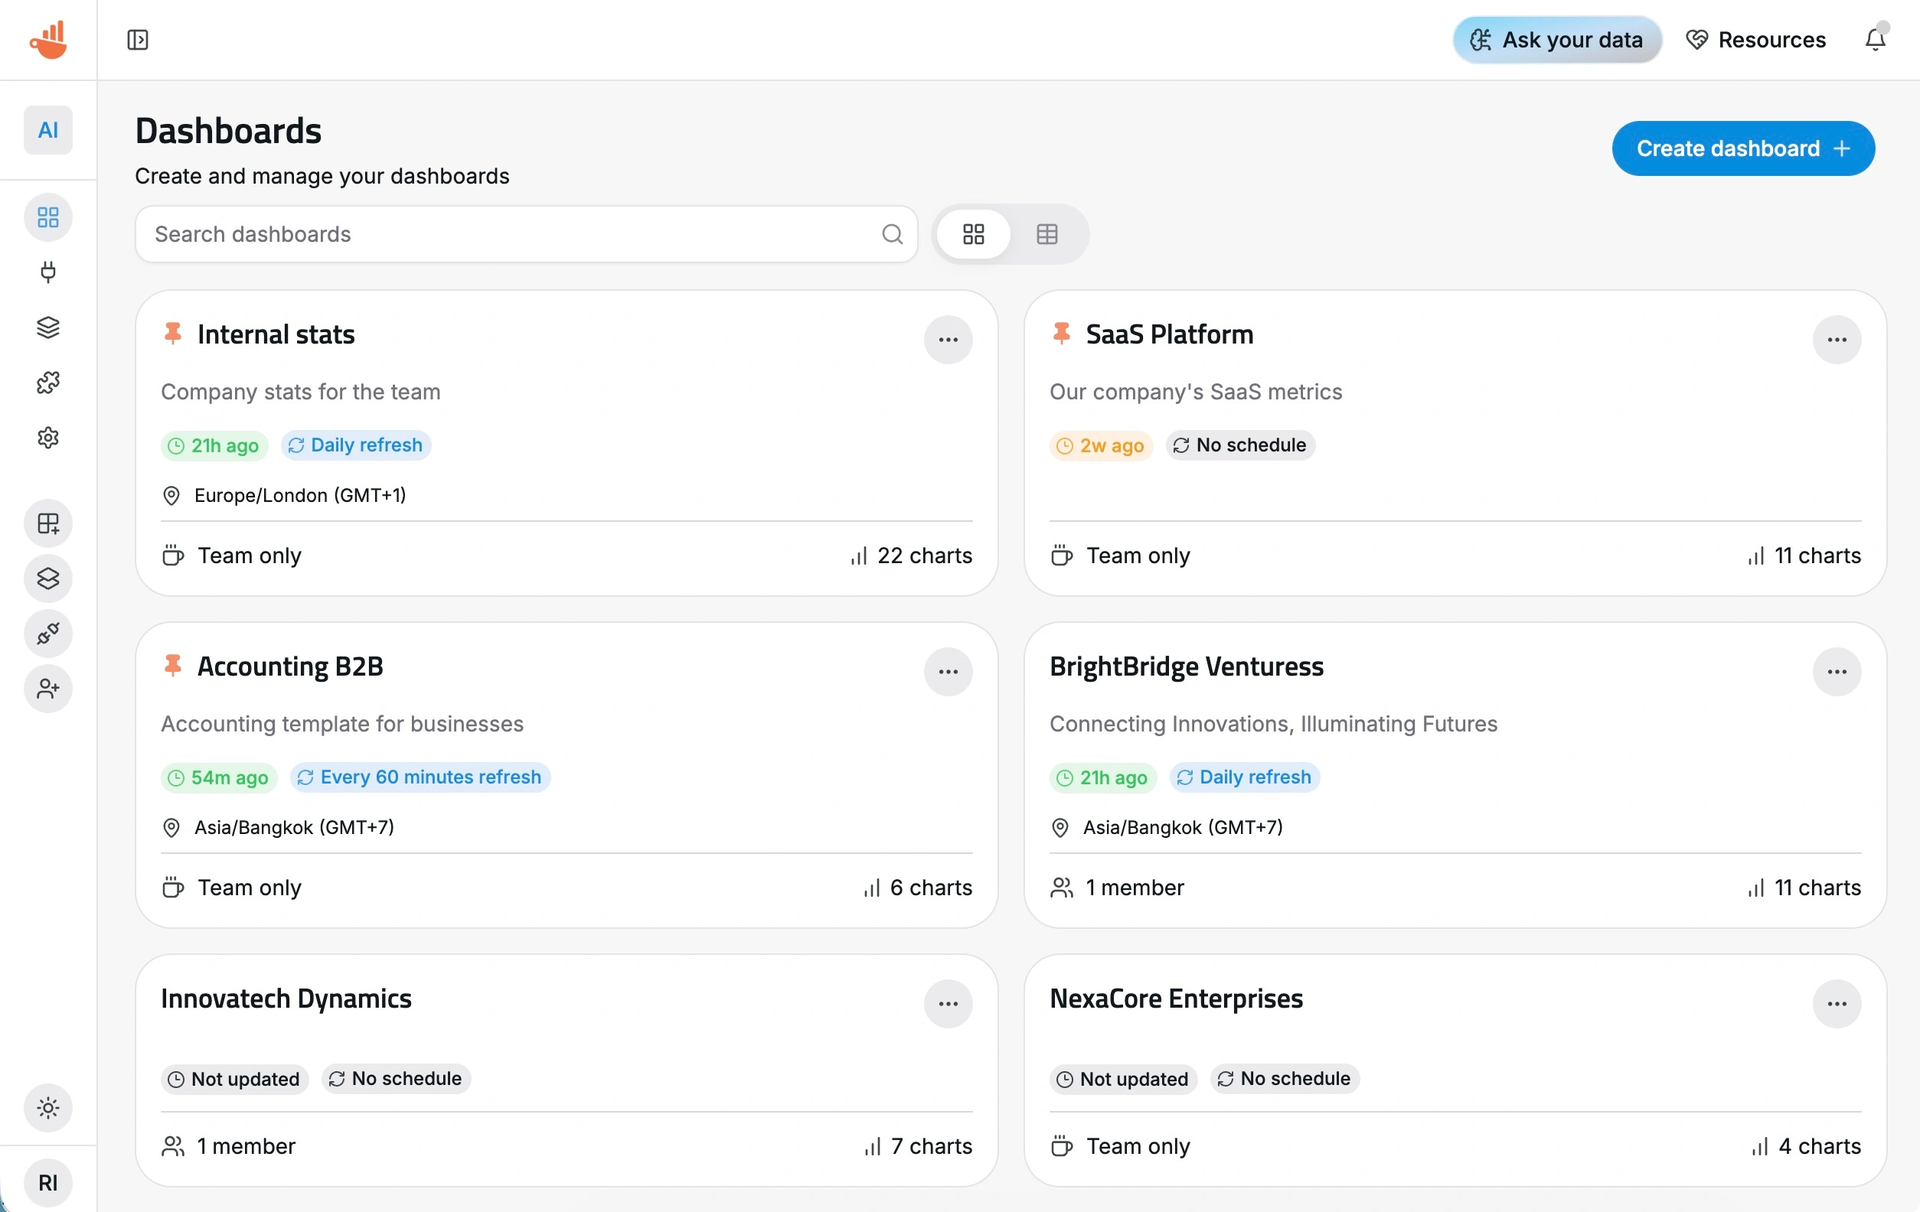
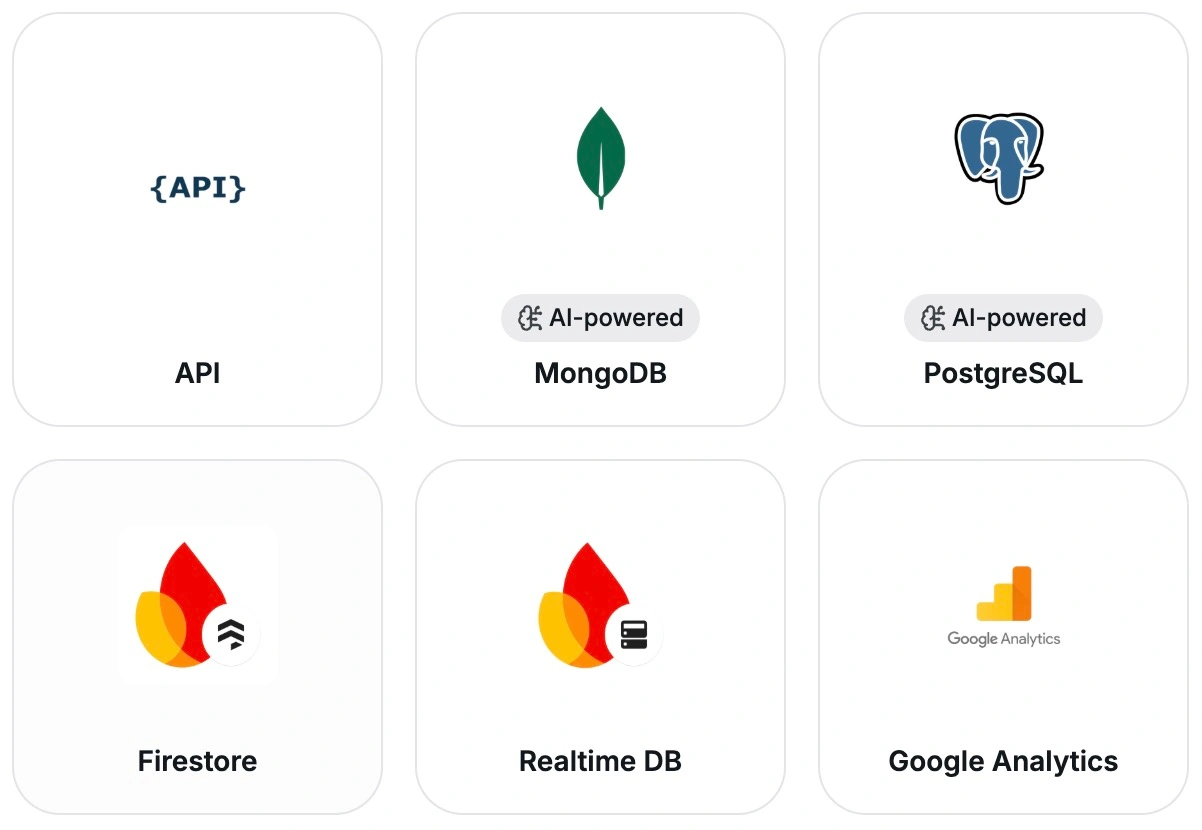
Chartbrew transforms raw database queries and API responses into polished, shareable dashboards without requiring a data engineering team. Connect to MySQL, PostgreSQL, MongoDB, Firestore, or any REST API, then build datasets using the visual query editor with syntax highlighting and auto-completion. Charts render through Chart.js with line, bar, pie, donut, radar, polar, KPI card, and table visualizations, each customizable with colors, legends, filters, and goal indicators. An AI assistant accelerates dashboard creation by generating queries and suggesting chart configurations from natural language descriptions of the metrics you want to track. Reusable datasets let teams prepare data transformations once and share them across multiple charts, while automatic scheduling through BullMQ and Redis refreshes data at intervals from every 10 minutes to monthly. The embed feature generates standalone chart URLs for insertion into external websites, internal tools, or customer portals, and the Reporting API enables programmatic dashboard management and automated report delivery. Team workspaces with role-based permissions control who can view, edit, or manage data connections. Nearly 4,000 GitHub stars reflect steady community adoption. The platform runs on Node.js with Express and Sequelize ORM, supporting MySQL or PostgreSQL as its application database. Running on a dedicated VPS on RepoCloud with guaranteed CPU, RAM, and SSD, full root SSH access, and a browser serial console. FSL-1.1-MIT licensed (converts to MIT two years after each release).
Benefits
- Connect Any Data Source
- Pull data directly from MySQL, PostgreSQL, MongoDB, Firestore, and REST APIs using the built-in query editor with syntax highlighting and auto-completion support.
- AI-Powered Dashboard Creation
- Describe the metrics you want in natural language and let the AI assistant generate database queries, chart configurations, and dashboard layouts automatically.
- Embeddable Charts and Reports
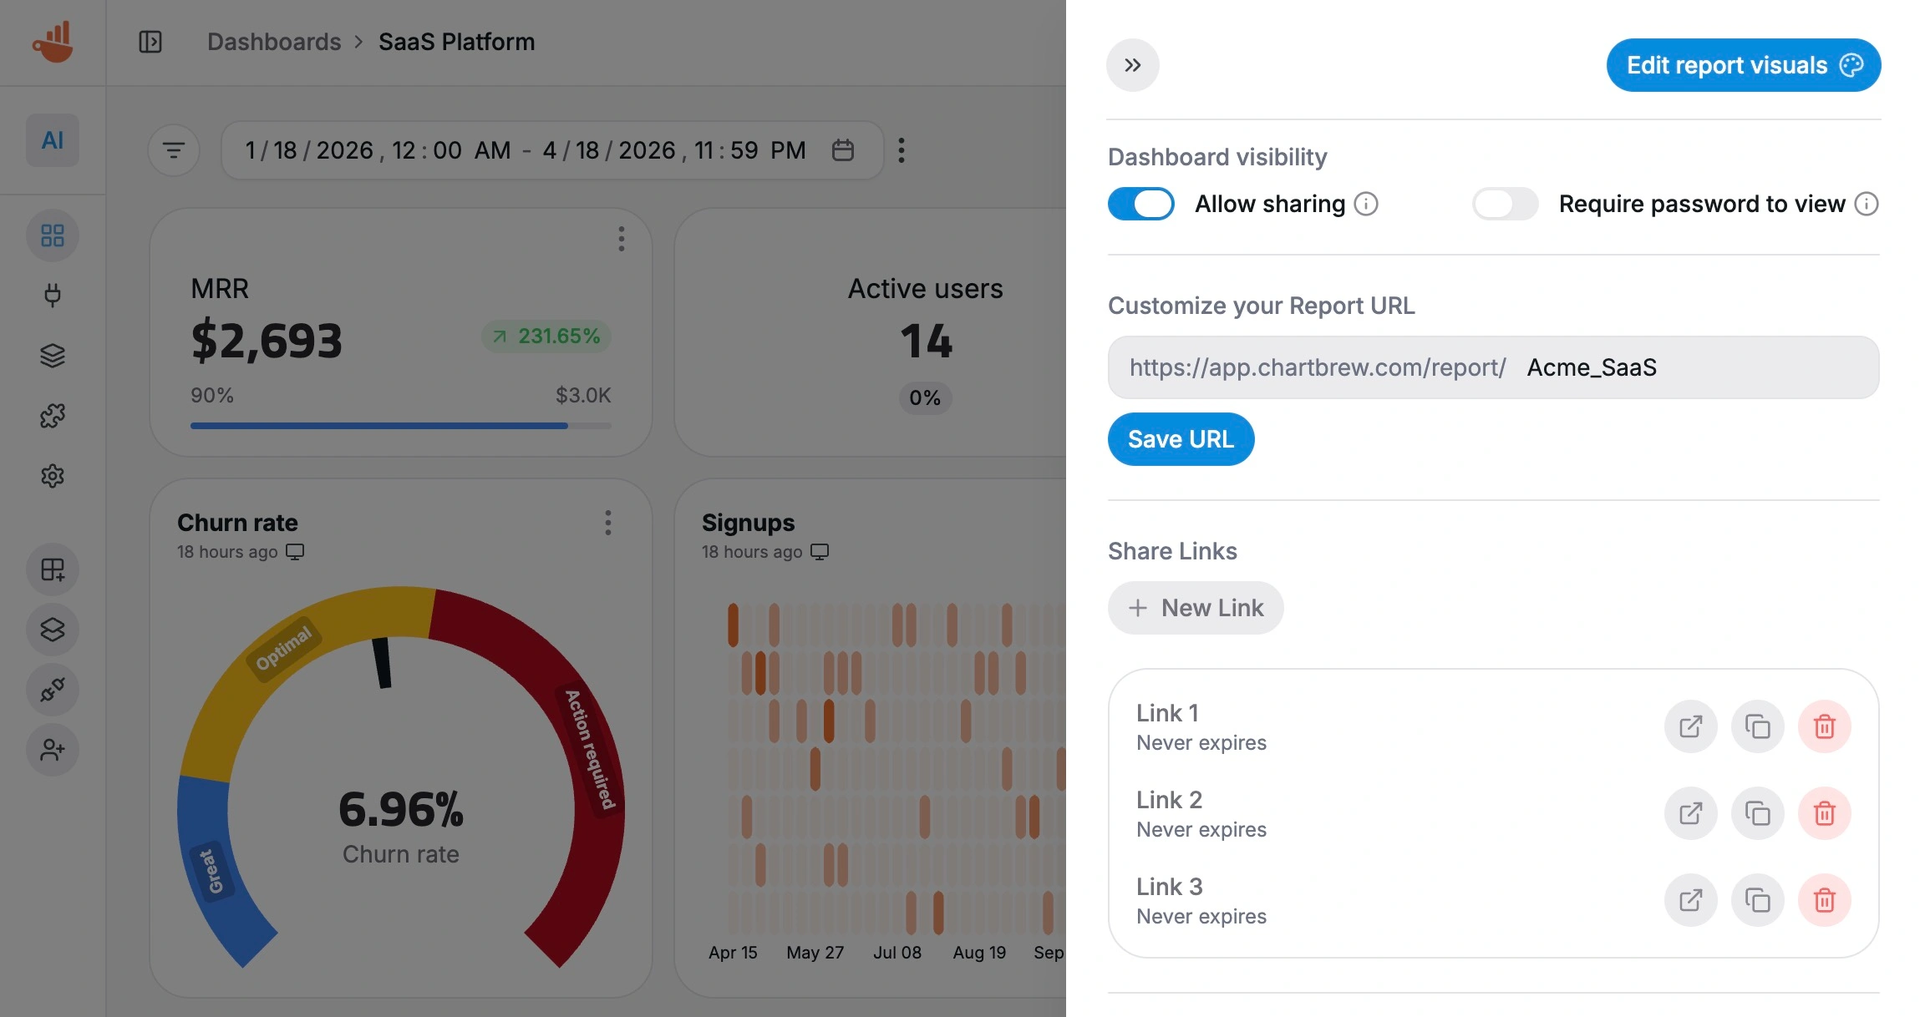
- Generate standalone chart URLs for embedding live, auto-updating visualizations in external websites, internal tools, documentation portals, and customer-facing product dashboards.
- Automated Data Refresh Scheduling
- Schedule dataset updates at configurable intervals from every ten minutes to monthly using BullMQ job queues backed by Redis for reliable background processing.
Features
- Visual Chart Builder
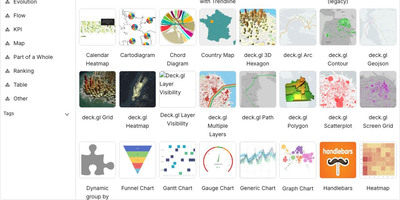
- Create line, bar, pie, donut, radar, polar, KPI card, and table visualizations with Chart.js rendering, custom colors, legends, and goal indicators.
- Query and API Editor
- Write SQL queries or configure API requests with the built-in editor featuring syntax highlighting, auto-completion, and response preview panels.
- Reusable Datasets
- Prepare data transformations once and share them across multiple charts and dashboards, enabling team-wide access to curated data sources.
- Team Collaboration
- Organize projects into team workspaces with role-based permissions controlling who can view dashboards, edit charts, or manage data connections.
- Reporting API
- Automate dashboard management and report delivery programmatically through the REST API for integration with CI/CD pipelines and external workflows.