Stars
Forks
Watchers
Developer links
Blocky UI
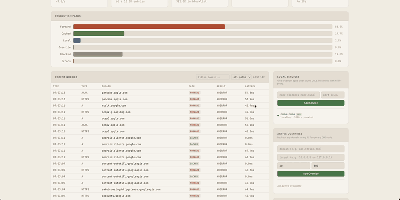
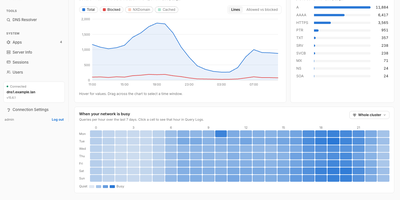
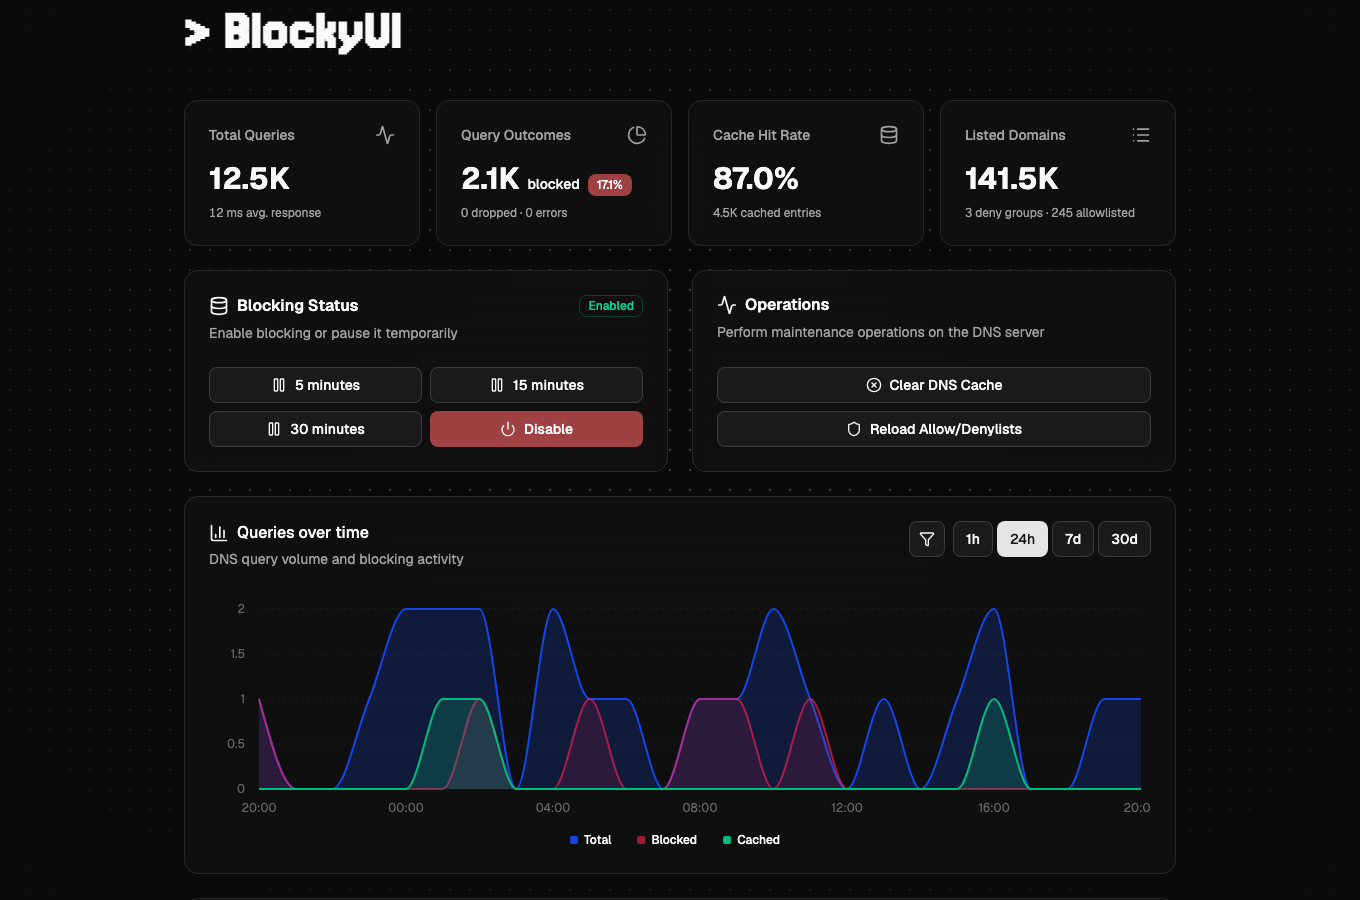
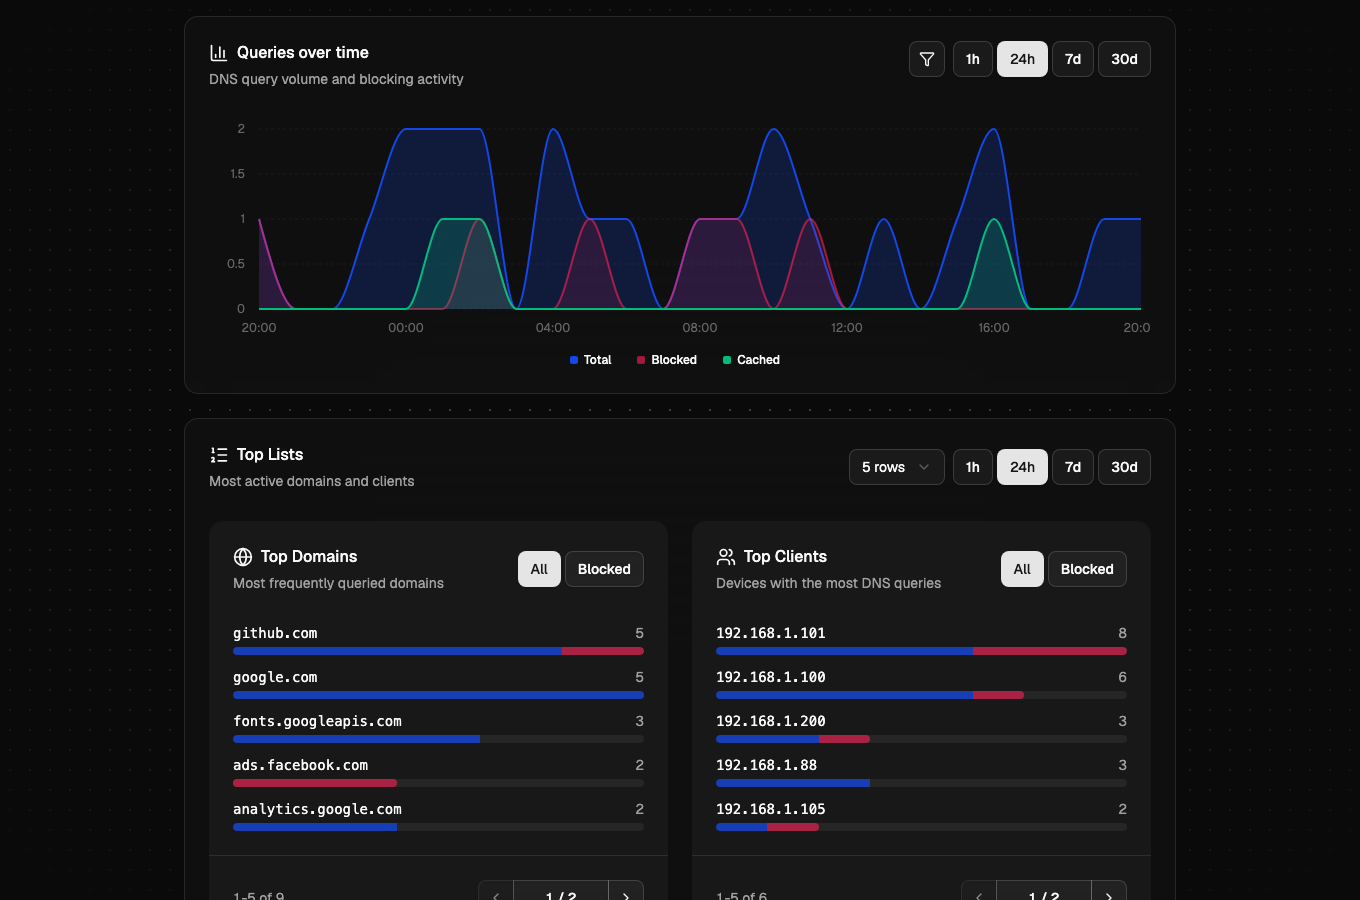
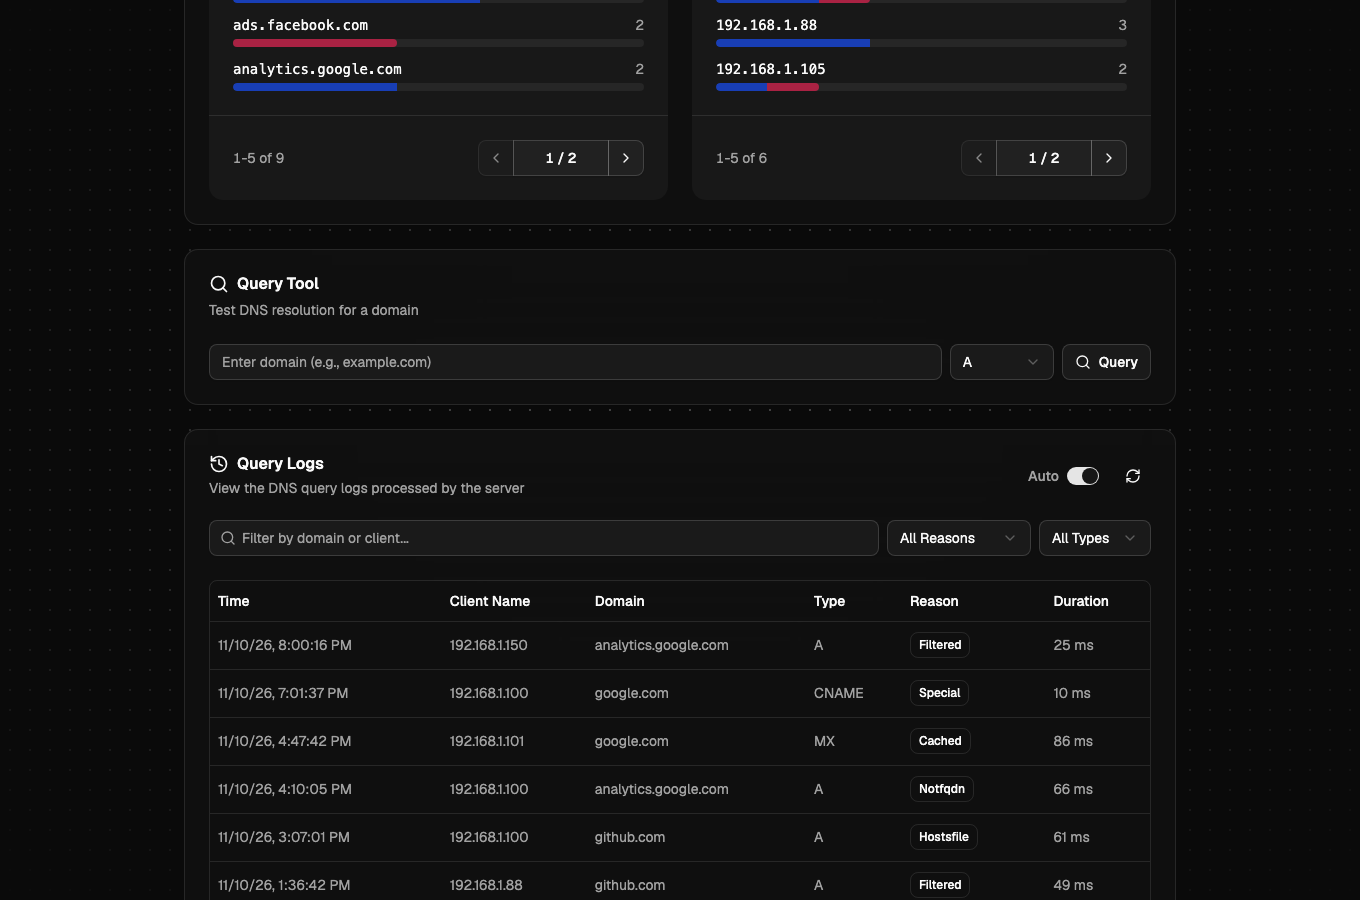
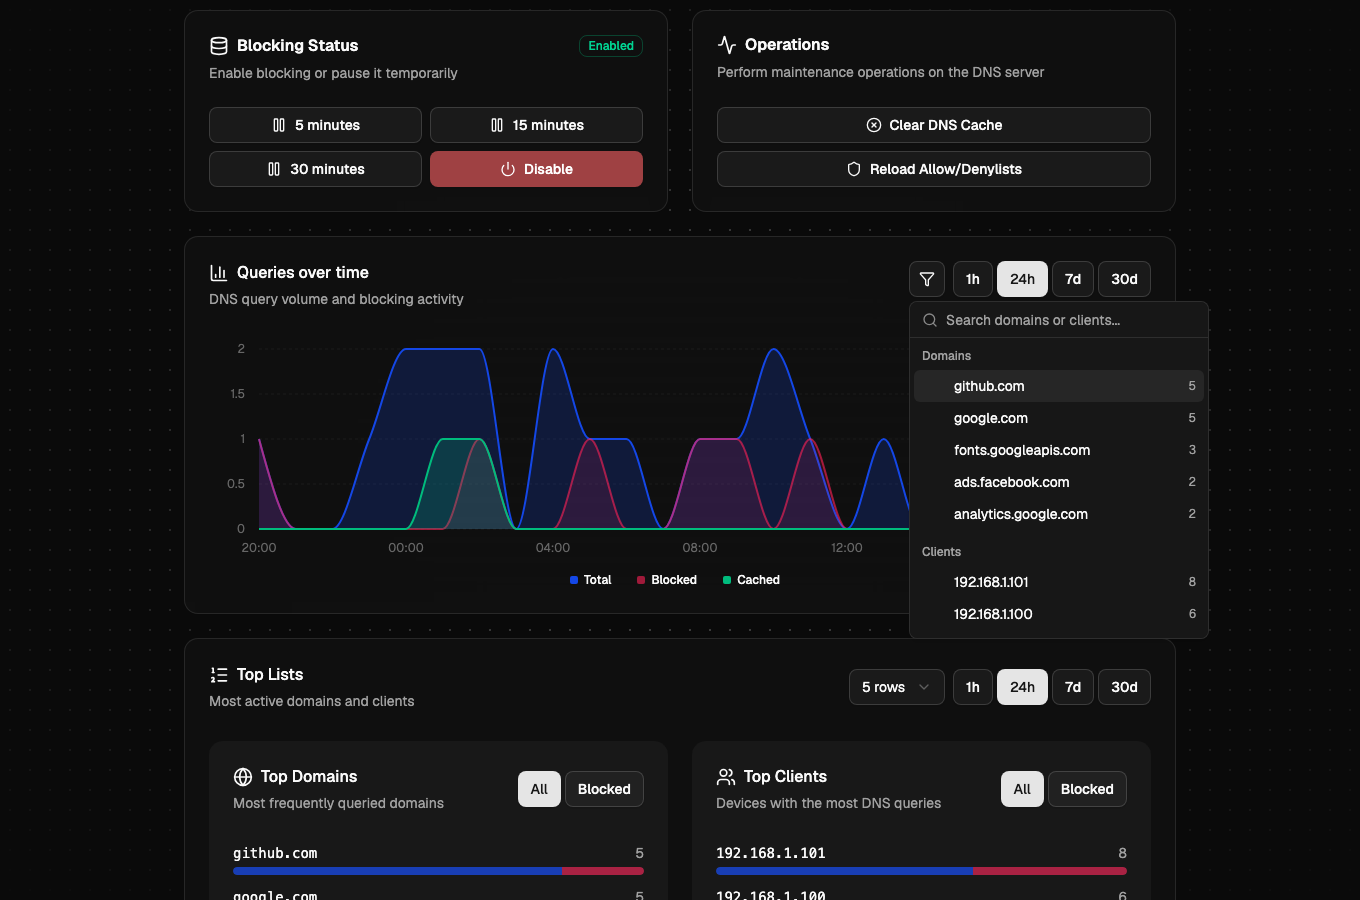
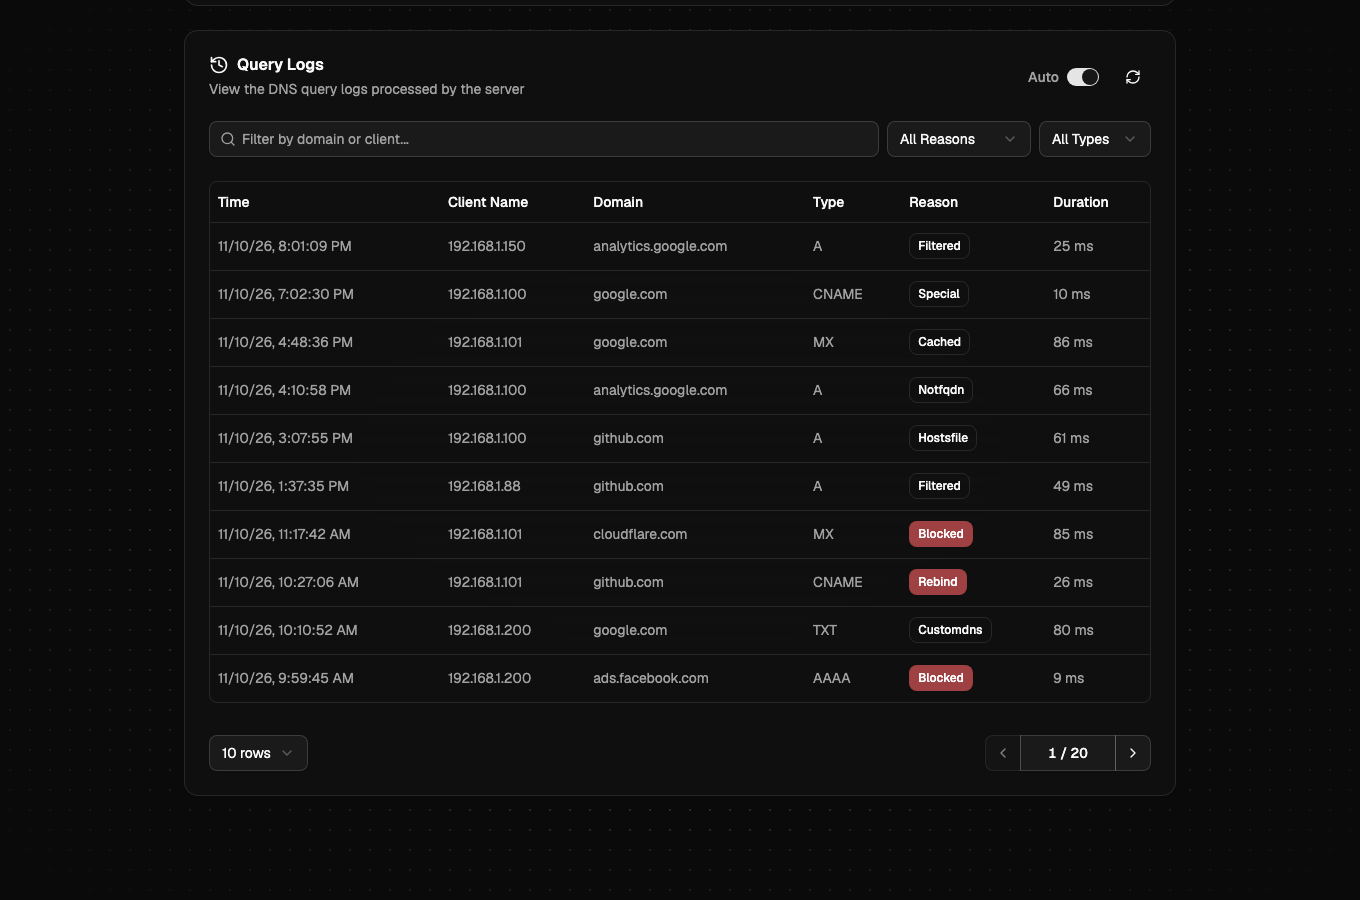
BlockyUI gives your Blocky DNS server a clean browser dashboard for seeing what gets queried, what gets blocked, and how quickly answers come back. Overview cards show total queries, blocked requests, cache hit rate, listed domains, and average response time. Pause blocking for 5, 15, or 30 minutes with one click, or disable it outright, then let it return on its own. Clear the DNS cache and reload allow and deny lists without touching the command line. A queries over time chart switches between 1 hour, 24 hours, 7 days, and 30 days, with filters for a single domain or client. Paginated top lists rank the busiest domains and devices and offer a blocked-only view. The query tool tests how any domain resolves, so a new filtering rule can be checked in seconds. Query logs are searchable and filterable by reason and record type, and they read from MySQL, PostgreSQL, Timescale, SQLite, CSV, or VictoriaLogs. Panels that depend on logging or statistics appear when your Blocky instance supports them, and the dashboard adapts otherwise. Settings live in one YAML file that points at your Blocky server. Running on a dedicated VPS on RepoCloud with guaranteed CPU, RAM, and SSD, full root SSH access, and a browser serial console. MIT licensed.
Benefits
- See Every DNS Query
- Searchable query logs with reason and record type filters show which devices asked for which domains, and if each answer was allowed, cached, or blocked.
- Pause Blocking In One Click
- Presets for 5, 15, or 30 minutes disable filtering temporarily when a site misbehaves, so nobody has to edit configuration files or restart the DNS server.
- Test Rules Before Trusting Them
- The query tool resolves any domain through Blocky and reports the outcome, so you can confirm that a new allow or deny rule behaves as expected.
- Use Your Existing Log Store
- Query logs read from MySQL, PostgreSQL, Timescale, SQLite, CSV, or VictoriaLogs, so the dashboard works with the logging backend your Blocky already uses.
Features
- Overview Statistics
- Cards show total queries, blocked requests, cache hit rate, listed domains, and average response time drawn from Blocky's statistics.
- Queries Over Time
- Chart total, blocked, and cached queries across 1 hour, 24 hours, 7 days, or 30 days, filtered by domain or client.
- Top Domains And Clients
- Ranked lists show the busiest domains and devices, with an all or blocked-only toggle and adjustable row counts.
- Maintenance Operations
- Clear the DNS cache and reload allow and deny lists with one click, without restarting the server.
- Query Tool
- Look up any domain with a chosen record type to test how Blocky resolves or blocks it.