Monitor
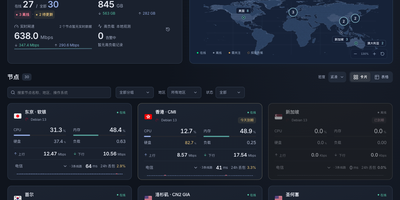
Monitor watches your servers the way a status page should: second by second, from one small binary you run yourself. A lightweight Linux agent on each machine reports CPU, memory, disks, network throughput, connections, and processes to your hub over a persistent connection, and the hub pushes a fresh snapshot to your browser every two seconds. History is kept for charting, so node pages show how load, traffic, and latency behaved over days. Ping tasks run from the hub's side too: define targets once and every agent measures latency to them on its own interval, drawing the curves next to the machine metrics. The public face is a status page you can reskin without touching the server: themes install from the panel, run as static pages against a small public API, and anonymous visitors see only the nodes you marked public, with addresses and hostnames stripped out. Node management stays practical: registration windows hand out tokens safely, installing an agent is one command, and replacing a token disconnects the old connection immediately. When a node goes offline, crosses its traffic allowance, approaches expiry, or someone signs in, alerts go out through Telegram or any webhook. The hub listens only on localhost behind your HTTPS proxy, signs in by password or GitHub OAuth allowlist, and lists revocable sessions. Running on a dedicated VPS on RepoCloud with guaranteed CPU, RAM, and SSD, full root SSH access, and a browser serial console. MIT licensed.
Fail2Ban Report
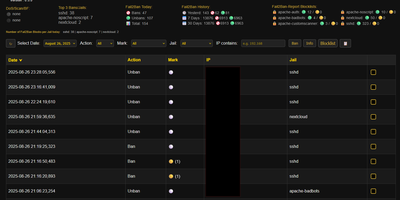
Fail2Ban quietly bans thousands of bots on a typical VPS and just as quietly keeps the whole story buried in a log file nobody reads, and Fail2Ban Report digs that story out into a dashboard you will actually open. Shell scripts convert each day of fail2ban.log into JSON, and the web interface lays every ban and unban on a searchable, filterable timeline you can slice by jail, server, or time window. Aggregated statistics for today, yesterday, seven days, and thirty days show which jails absorb the most attacks, while markers flag repeat offenders and escalating ban counts so persistent scanners stand out from one-time noise. Blocklists live per jail and per server as plain JSON, and ban or unban actions execute through UFW, giving you permanent bans that survive independently of jail restarts. Bulk actions handle whole ranges at once, with a pending state until the next sync applies them. Multiple servers feed one console through a pull-based HTTPS endpoint, so a fleet of small machines reports to a single pane without exposing SSH. Optional AbuseIPDB and IP-Info lookups add reputation and region context to any address. Running on a dedicated VPS on RepoCloud with guaranteed CPU, RAM, and SSD, full root SSH access, and a browser serial console. GPL-3.0 licensed.
Cronstable
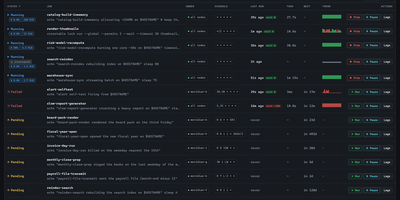
Cronstable gives scheduled jobs what cron never had: retries when they fail, alerts when retries run out, a saved history of every run, and a dashboard to watch it all. Bring your existing crontab or define jobs in YAML, down to business-day schedules, hashed fleet spreading, and per-job time zones, then let failures retry with backoff while alerts head to email, Slack-compatible webhooks, Sentry, or an encrypted push to your phone. Every run is remembered, so history, live logs, and incident timelines answer what happened last Tuesday instead of shrugging. When jobs grow dependencies, they become durable workflows: task graphs with data sharing, dynamic fan-out, sensors, shared resource pools, and approval gates a human taps before the next step runs, with failed tasks replayed selectively instead of starting over. One machine or a whole fleet looks the same from the web dashboard, the terminal, or iOS, and a schedule linter quietly warns you about the job that can never run and the one daylight saving will skip. Running on a dedicated VPS on RepoCloud with guaranteed CPU, RAM, and SSD, full root SSH access, and a browser serial console. MIT licensed.
SerpBear
Unlimited domains, unlimited keywords, daily Google position checks with stored history and trend charts: SerpBear is an open-source search engine rank tracker. Retrieval works through your choice of third-party SERP APIs - ScrapingAnt, ScrapingRobot, SerpApi, SearchApi, HasData - or your own proxy IP pool, and a flexible scrape-strategy system (Basic, Custom, or Smart, set globally or per domain) works around Google's removal of the 100-results-per-page parameter by choosing how many pages to check per keyword. Google Search Console integration adds real visit counts, impressions, and click-through rates per tracked keyword and surfaces top-performing pages and countries; Google Ads integration supplies monthly search volumes and auto-generates keyword ideas from your site's content. Email notifications report position changes daily, weekly, or monthly, a built-in REST API feeds dashboards and reporting tools, and data exports to CSV. Built with Next.js on SQLite, deployed via Docker, installable as a PWA on mobile - with no per-keyword or monthly SaaS fees.
JT-IPAM
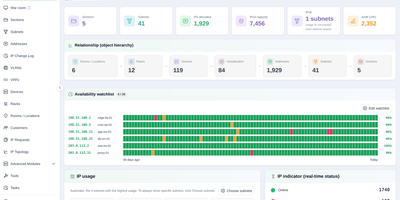
Spreadsheets and sticky notes stop scaling the day your network grows past a rack or two, so JT-IPAM keeps every address, subnet, and device in one searchable system of record. Track subnets and individual IPs with their hostnames, MAC addresses, and owners, then reconcile what you documented against what scan agents actually find through ICMP, ARP, reverse DNS, and SNMP collection from routers and switches. Connect the DNS servers you already run, from PowerDNS and BIND 9 to Windows DNS and Technitium, and flag records that have no matching address in IPAM. Pull devices and virtual machines in from LibreNMS, Zabbix, Proxmox VE, ESXi, Hyper-V, and OpenStack so monitoring and address records stop drifting apart. Draw floor plans and rack elevations, trace a cable across multiple hops, and open an SSH terminal, SFTP browser, or RDP desktop to a device straight from its address page. Route new address requests through configurable multi-stage approval workflows, distribute certificates to web servers and firewalls from central encrypted storage, and keep a full audit trail of every change and console session. Running on a dedicated VPS on RepoCloud with guaranteed CPU, RAM, and SSD, full root SSH access, and a browser serial console. AGPL-3.0 licensed.
Beszel
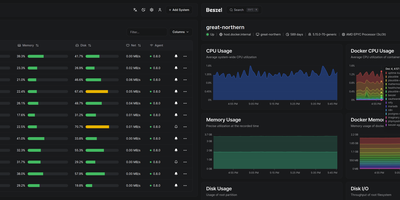
Reaching 24,000 GitHub stars within two years of its first commit in July 2024, Beszel delivers Netdata-grade monitoring dashboards from a single Docker container with no Prometheus stack, no external database, and no complex configuration — just a one-binary hub on PocketBase (SQLite embedded) and a sub-15 MB agent per host that auto-discovers Docker and Podman containers on contact. The agent connects outbound via WebSocket or SSH tunnel, requiring zero open ports on monitored servers and zero manual network configuration. Per-host metrics cover CPU usage, memory with swap and ZFS ARC breakdown, disk I/O across multiple partitions, network throughput, load average, sensor temperatures, battery charge, and GPU utilization with power draw for Nvidia, AMD, and Intel cards — features that competitors lock behind paid tiers. S.M.A.R.T. disk health including eMMC wear indicators and Linux mdraid array status surface hardware degradation before failures occur. Container statistics track CPU, memory, and network history per container with automatic discovery as new containers start. Configurable threshold alerts notify via email, Discord, Telegram, ntfy, Pushover, Gotify, Matrix, Mattermost, Signal, Slack, Microsoft Teams, and Twilio when metrics exceed defined limits. Multi-user accounts with OAuth/OIDC authentication let teams share monitored systems with role-based access, while automatic backups persist data to disk or S3-compatible storage. Running on a dedicated VPS on RepoCloud with guaranteed CPU, RAM, and SSD, full root SSH access, and a browser serial console. MIT licensed.
Dashy
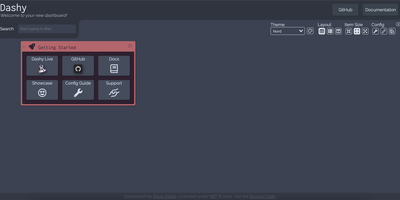
Every service you run, behind one polished start page: Dashy is the most customizable homelab dashboard, built as a Vue.js homepage. Configuration lives in a single YAML file, but you never have to hand-edit it: an integrated UI editor with real-time validation writes changes back to disk, so both config-as-code and point-and-click camps are served. Status indicators put a live health dot next to every app - HTTP checks or pings on custom intervals, with response time and status details on hover - giving you an at-a-glance uptime overview before anything breaks. Over 50 built-in widgets pull dynamic content from the services you already run: Pi-hole and AdGuard block stats, Proxmox lists, Nextcloud status, Netdata CPU/memory history, Prometheus data, plus weather, RSS, crypto prices, and generic iframe/API-response widgets for anything with an endpoint. Instant fuzzy search launches any app as you type, with customizable hotkeys and web-search fallthrough. Theming is deep: dozens of built-in themes, a UI color palette editor, and custom CSS over CSS variables. Alternate views include a fast-loading minimal startpage and a workspace view that embeds apps side-by-side without leaving the dashboard. Icons resolve from Font Awesome, homelab icon packs, emojis, or auto-fetched favicons. Built-in authentication, multi-page support, cloud backup/sync, and multi-language round out an MIT project with a massive community.
Netdata
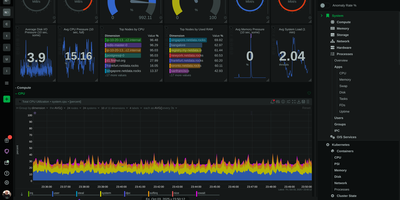
Trusted by millions of engineers and deployed on over 80,000 GitHub stars worth of community confidence, Netdata delivers true real-time monitoring at per-second granularity — 10-60x faster than Prometheus, Datadog, or any conventional monitoring stack that averages away the transient anomalies lasting 2-10 seconds where most production incidents originate. A single installation command deploys the agent with zero configuration, automatically discovering every running process, container, systemd service, network connection, disk, and application on the host within seconds. Unsupervised machine learning trains multiple models per metric directly at the edge, detecting anomalies without thresholds, baselines, or manual tuning. The distributed Parent-Child architecture scales horizontally from a single Raspberry Pi to fleets exceeding 100,000 nodes while maintaining sub-2-second visualization latency and storing metrics at approximately 0.5 bytes per sample through tiered compression. Native network monitoring provides live topology maps, NetFlow and sFlow analytics, SNMP device polling across 200+ profiles, and trap handling — capabilities that typically require a separate NPM product. Hundreds of pre-configured alerts cover systems and applications out of the box, with AI-powered root cause analysis surfacing correlated metrics through natural language via MCP-compatible AI assistants. The agent supports Linux, macOS, FreeBSD, Kubernetes, and Docker with eBPF-based kernel observability requiring no application instrumentation. Running on a dedicated VPS on RepoCloud with guaranteed CPU, RAM, and SSD, full root SSH access, and a browser serial console. GPL v3+ licensed.
LogTide
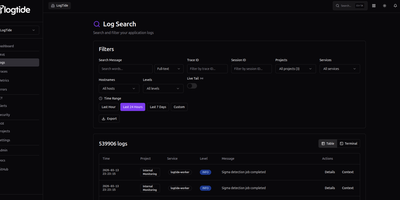
Every production incident starts the same way: someone asks "what do the logs say?" and the answer takes 45 minutes to find. LogTide collapses that search into seconds with a unified observability platform that indexes logs, traces, and metrics into a single queryable interface, backed by your choice of TimescaleDB, ClickHouse, or MongoDB. The log search interface supports full-text queries across millions of entries with filters for trace ID, session ID, project, service, hostname, and severity level, plus a live tail mode that streams new log lines as they arrive. Distributed traces render as waterfall timelines showing every span, its duration, and cross-service dependencies, while correlated logs for each trace are one click away. The metrics explorer visualizes OTLP gauge and counter data from your applications with system CPU, memory, disk, and network panels that update in near real-time. Where LogTide diverges from standard observability is its built-in SIEM engine: Sigma-compatible detection rules scan incoming logs for security threats like SQL injection, privilege escalation, lateral movement, and C2 communication, surfacing findings on a dedicated security dashboard with severity distribution, detection timelines, and affected service breakdowns. Alerting pushes notifications to Email, Slack, or Discord webhooks when thresholds trip or security rules fire. Native SDKs for Node.js, Python, Go, PHP, Kotlin, and Ruby ship logs with retry logic and circuit breakers, and the platform accepts OpenTelemetry data natively. Running on a dedicated VPS on RepoCloud with guaranteed CPU, RAM, and SSD, full root SSH access, and a browser serial console. AGPL-3.0 licensed.
FileCat
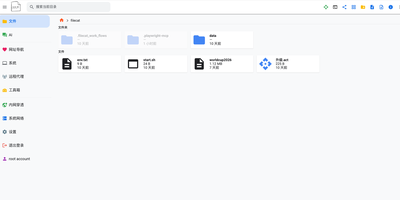
One browser tab can run your whole server, and FileCat is the tab: a self-hosted web file manager that also serves as a lightweight server operations console. Browse, upload, download, and edit files with inline previews for images, video, and Markdown, then keep writing in a Typora-style WYSIWYG Markdown editor or sketch on the built-in Excalidraw whiteboard. Remote storage stops being remote: SFTP, S3, WebDAV, SMB shares, and Baidu Netdisk mount as ordinary local folders under the same operations, and your own directories publish back out over SMB, WebDAV, and SFTP for Windows Explorer and other clients. A web SSH terminal and in-browser RDP sessions reach servers and Windows desktops without separate tools, and the system dashboard watches CPU, memory, disk, and network in real time. Oversized log files open instantly, deep search digs through names and file contents with regex and filters, and custom command pipelines cover CI/CD routines across machines linked by the built-in network tunneling. An optional AI agent, connected to your own model API and reachable through chat platform bots, assists with operations and file tasks, and multi-user permissions with shareable download links decide who touches what. Running on a dedicated VPS on RepoCloud with guaranteed CPU, RAM, and SSD, full root SSH access, and a browser serial console. Apache-2.0 licensed.
HotHost
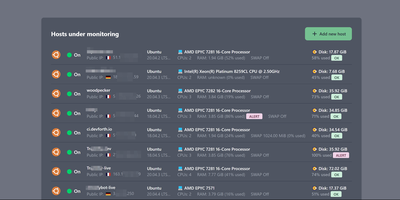
HotHost answers the only two questions that matter about every server you own, is it up and is the disk about to fill, before your users ask them instead. One web container collects metrics from a tiny agent you paste onto each host as a Docker or shell snippet, and the fleet lands in a single table: hostname, public IP, RAM and disk usage, CPU model and cores, swap state, and country. Disk and RAM get loud ALERT badges at a configurable threshold, ninety percent by default, and notifications fire on failure and again on recovery, so a resolved incident closes its own loop. The same console watches your websites directly, requesting each URL on your interval and checking the status code, a required keyword in the response, or basic auth behavior. SSL certificates get an expiration reminder fourteen days out by default, long before the browser warnings start. When memory climbs, the top ten RAM-consuming processes are charted over the last two days, turning "something is eating the box" into a named culprit. Alerts route through Email, Slack, Telegram, or Gmail plugins, and the plugin system accepts your own notifiers. Running on a dedicated VPS on RepoCloud with guaranteed CPU, RAM, and SSD, full root SSH access, and a browser serial console. MIT licensed.
Monoscope
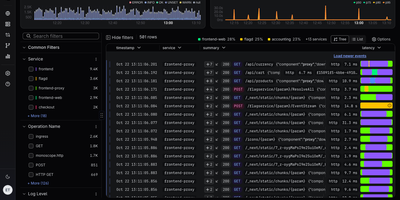
Across logs, traces, and metrics, Monoscope gives engineering teams one self-hosted workspace for finding what broke, asking questions in plain English, and hearing about problems before users do. Start in the Explorer: search events with KQL or an Ask AI prompt, flip between log rows, bar and line charts, log patterns, and sessions, and narrow results with facets for service, level, and HTTP status. Open any span to read its attributes, then follow the full trace across services in a waterfall, timeline, or map view. Live Tail streams new events as they arrive, and the Service Map draws every dependency with its error rate, latency, and requests per second. Build dashboards from widgets with copyable KQL and SQL, then set scheduled monitors with warn and alert thresholds, cron monitors, and uptime checks. An Issues inbox gathers API changes, errors, and log patterns so each one can be acknowledged, archived, or marked as spam, while Reports send scheduled summaries by email. Telemetry arrives over OTLP gRPC on port 4317 from OpenTelemetry SDKs and collectors. The monoscope CLI emits JSON for scripts, and an MCP server at /api/v1/mcp lets Claude, Cursor, and Cline search events and triage issues. Natural-language search uses the OpenAI-compatible model you configure. Running on a dedicated VPS on RepoCloud with guaranteed CPU, RAM, and SSD, full root SSH access, and a browser serial console. AGPL-3.0 licensed.
Relay Pulse
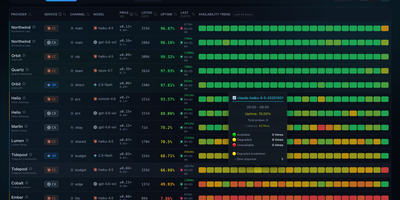
An API relay that answers HTTP 200 with an empty reply is not alive, and Relay Pulse exists to catch exactly that. Every minute, or any interval you set, it sends a tiny real request to each relay, asks a simple arithmetic question, and counts the probe as healthy only when the right answer comes back. Results land in a color-coded availability matrix where green, yellow, and red blocks show good, slow, and failed checks across the last 90 minutes, 24 hours, 7 days, or 30 days. Each row lists provider, service type, channel, model, price multiplier, days listed, uptime percentage, and the latest latency, and hovering a block reveals its probe counts and a breakdown of why it degraded. Filters narrow the table by category, provider, service, channel, vendor, or model, and the page switches between table and card views, four themes, and English or Chinese. Sponsor levels can pin trusted channels to the top, hot and cold boards separate active relays from dormant ones, and Telegram or QQ bots push status changes. Configuration reloads without a restart, templates cover Claude, Codex, and Gemini style endpoints, and a JSON API exposes current status. Running on a dedicated VPS on RepoCloud with guaranteed CPU, RAM, and SSD, full root SSH access, and a browser serial console. MIT licensed.
Huginn
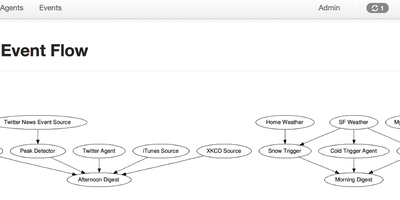
Huginn has established itself as the definitive open-source automation engine for developers who refuse to hand their workflow data to third-party cloud services. The platform lets you build agents that scrape websites, monitor RSS feeds, track weather via APIs, watch Twitter streams, aggregate news, detect price changes, and trigger notifications through email, SMS via Twilio, Slack webhooks, or social media posts to Twitter and Tumblr. Each agent creates and consumes JSON events, propagating them along a directed graph where complex multi-step workflows emerge from simple single-purpose components. The web interface provides visual agent management with drag-and-drop scenario building, real-time event logs, scheduling controls, and a built-in agent library covering dozens of use cases out of the box. Huginn supports Liquid templating for dynamic event transformation, regex-based content extraction, JavaScript-based data manipulation, and HumanTaskAgent for crowd-sourced workflow steps. Custom agents can be packaged as Ruby gems and loaded via the ADDITIONAL_GEMS environment variable without modifying core code. Deployment options include Docker with the official huginn/huginn all-in-one image or huginn/huginn-single-process for production multi-container setups with PostgreSQL or MySQL backends, plus native support for Heroku and OpenShift PaaS platforms. Running on a dedicated VPS on RepoCloud with guaranteed CPU, RAM, and SSD, full root SSH access, and a browser serial console. MIT licensed.
GEOInflow
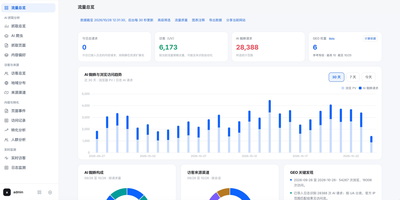
GEOInflow is a self-hosted analytics platform that shows website owners which AI crawlers visit their pages, what those crawlers read, and how much traffic and revenue AI search actually sends back. Import a sitemap, CSV, or JSON inventory and the coverage report compares it against observed crawl logs, flagging important pages that no AI crawler has ever requested and directories where coverage keeps dropping. The built-in catalog recognizes 61 AI crawler identities, including crawlers from OpenAI, Anthropic, Perplexity, Google, Microsoft, ByteDance, Baidu, Kimi, and Tencent Hunyuan, and separates training, AI search, and user-triggered visits. Verification combines declared user agents with official IP ranges and DNS evidence, so a spoofed crawler name never counts as a confirmed visit. Browser tracking connects AI search referrals to landing pages, custom events, goals, funnels, and conversions, letting teams measure whether visibility in AI answers turns into signups and sales. Alongside the GEO reports, teams get pageviews, unique visitors, referrers, geography, devices, heatmaps, retention, and visitor paths, with CSV, JSON, and ZIP exports for any selected scope. Workspaces, team permissions, and public sharing links let agencies and publishers give each client or department its own dashboards without exposing raw data or other sites. Running on a dedicated VPS on RepoCloud with guaranteed CPU, RAM, and SSD, full root SSH access, and a browser serial console. MIT licensed.
mcpspan
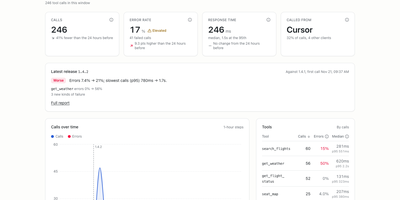
Every tool call, resource read, and prompt get an agent makes on your MCP server lands in mcpspan, with the client that asked, the response time, and the reason for any failure. One line added at startup sends them, with SDKs for eight languages or a proxy that wraps any server without touching its code. The overview charts calls, error rate, and median and 95th-percentile response time per tool, and failures are told apart as crashed handlers, reported errors, refused arguments, and tools an agent asked for that the server does not have. Sessions replay each connection step by step, mark repeated calls, and show what the agent did after every failure: retried, tried something else, or gave up. Release reports set each server version against the one before it, and client versions show whether a client's newest release gets its arguments refused more often. A tool-definition view shows what the tool list costs in tokens each session and which tools agents never call. Alerts go to Slack, Discord, or any webhook, and read tokens let an MCP client such as Claude Code answer questions about the numbers. Anything you can see exports as CSV or NDJSON, calls forward to OpenTelemetry, and README badges show usage. Running on a dedicated VPS on RepoCloud with guaranteed CPU, RAM, and SSD, full root SSH access, and a browser serial console. MIT licensed.
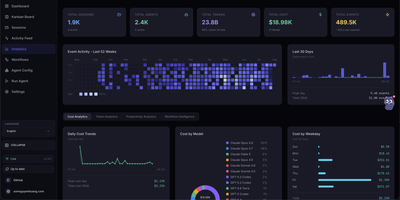
Claude Code Agent Monitor
Claude Code Agent Monitor puts every AI coding agent session on one live control room, so you can see what each agent is doing, what it costs, and where it got stuck. Claude Code, Cursor, and Codex sessions land together in a dashboard, a sessions list, an activity feed, and a kanban board. Open any session to read the full rendered conversation with highlighted code, tool calls, command output, and sub-agent timelines. The analytics page charts spend by model and weekday, token totals, cache hit rates, and a 52-week activity heatmap. Workflow views map parent and child agents, delegation, compactions, errors, and concurrency. An Agent Config explorer lists your skills, subagents, slash commands, hooks, plugins, MCP servers, and memory files in one place. The Run Agent page starts a conversation or one-shot job, streams output, and resumes earlier sessions without leaving the browser. Webhook alerts, push notifications, and a REST API keep the rest of your tooling informed. Running on a dedicated VPS on RepoCloud with guaranteed CPU, RAM, and SSD, full root SSH access, and a browser serial console. MIT licensed.
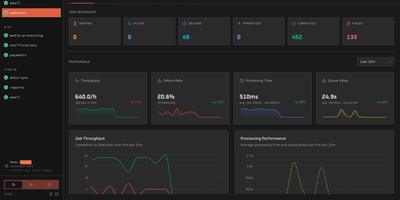
bullstudio
bullstudio turns a pile of opaque Redis keys into a live control panel for your BullMQ and Bull queues, so you can see what is stuck, failing, or delayed without opening a Redis CLI. Point it at a Redis URL and it discovers every queue and prefix on its own, including Redis Cluster setups. The overview page tracks waiting, active, delayed, prioritized, completed, and failed counts next to throughput, failure rate, processing time, and queue delay charts. Open any job to read its input data, logs, return value, and stack trace, then retry, promote, or remove it in one click. Flow view draws parent and child jobs as a color-coded dependency graph, which makes it easy to spot the step where a multi-stage job stalled. Separate screens list connected workers with their concurrency and heartbeat, and show repeatable and cron schedules with their next run time. Pause, resume, drain, or clean a queue directly from the header. Basic authentication, a read-only mode, and a base path for reverse proxies keep access under control. Running on a dedicated VPS on RepoCloud with guaranteed CPU, RAM, and SSD, full root SSH access, and a browser serial console. MIT licensed.