Stars
Forks
Watchers
Developer links
LogTide
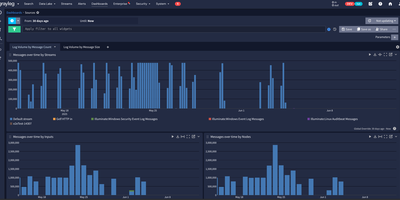
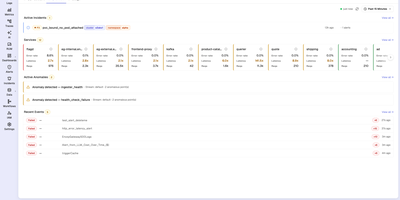
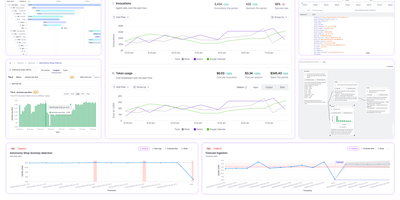
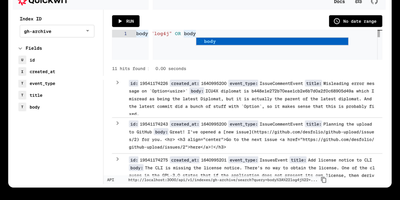
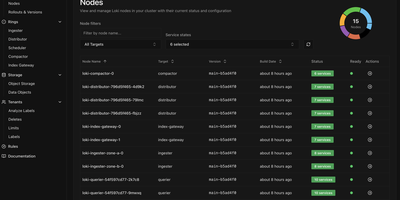
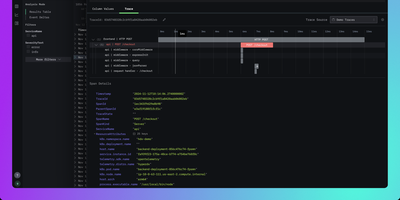
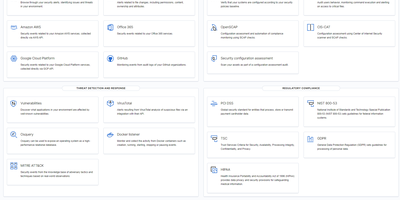
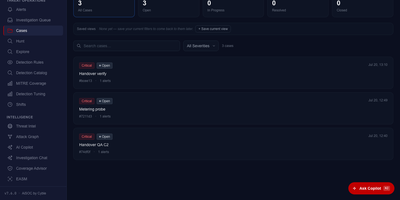
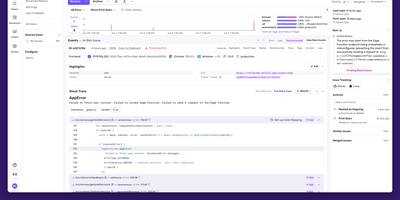
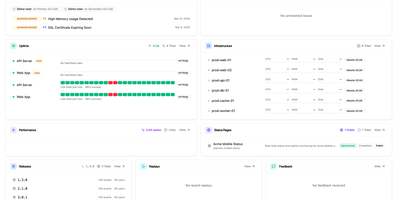
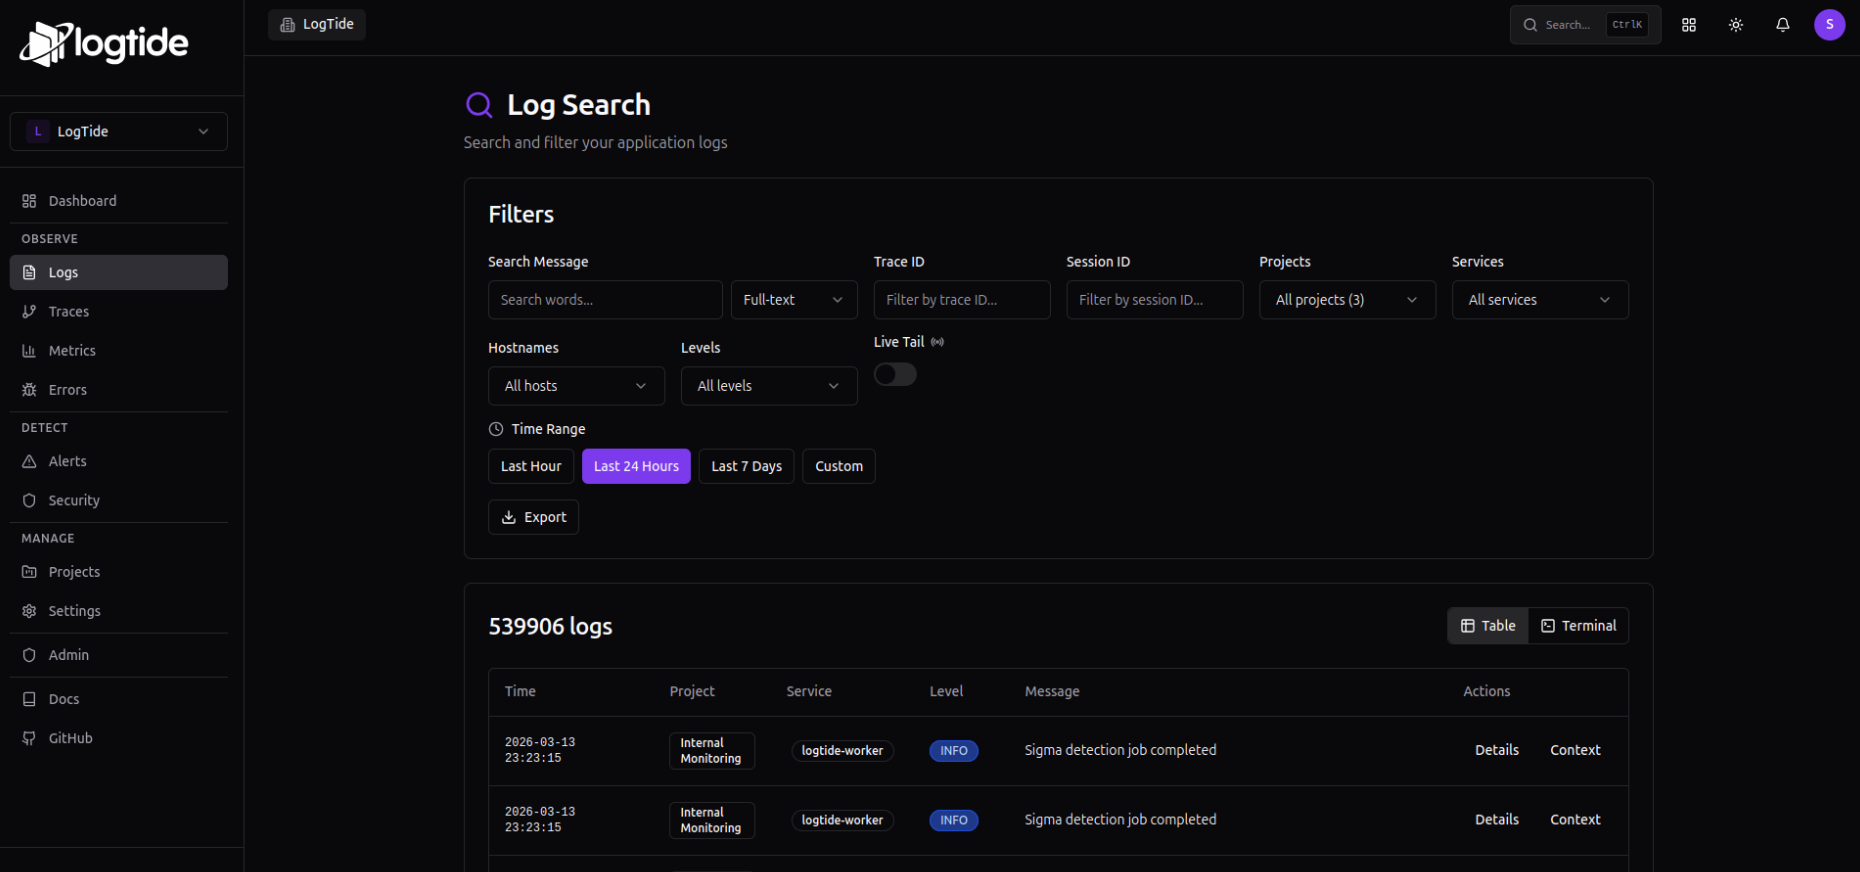
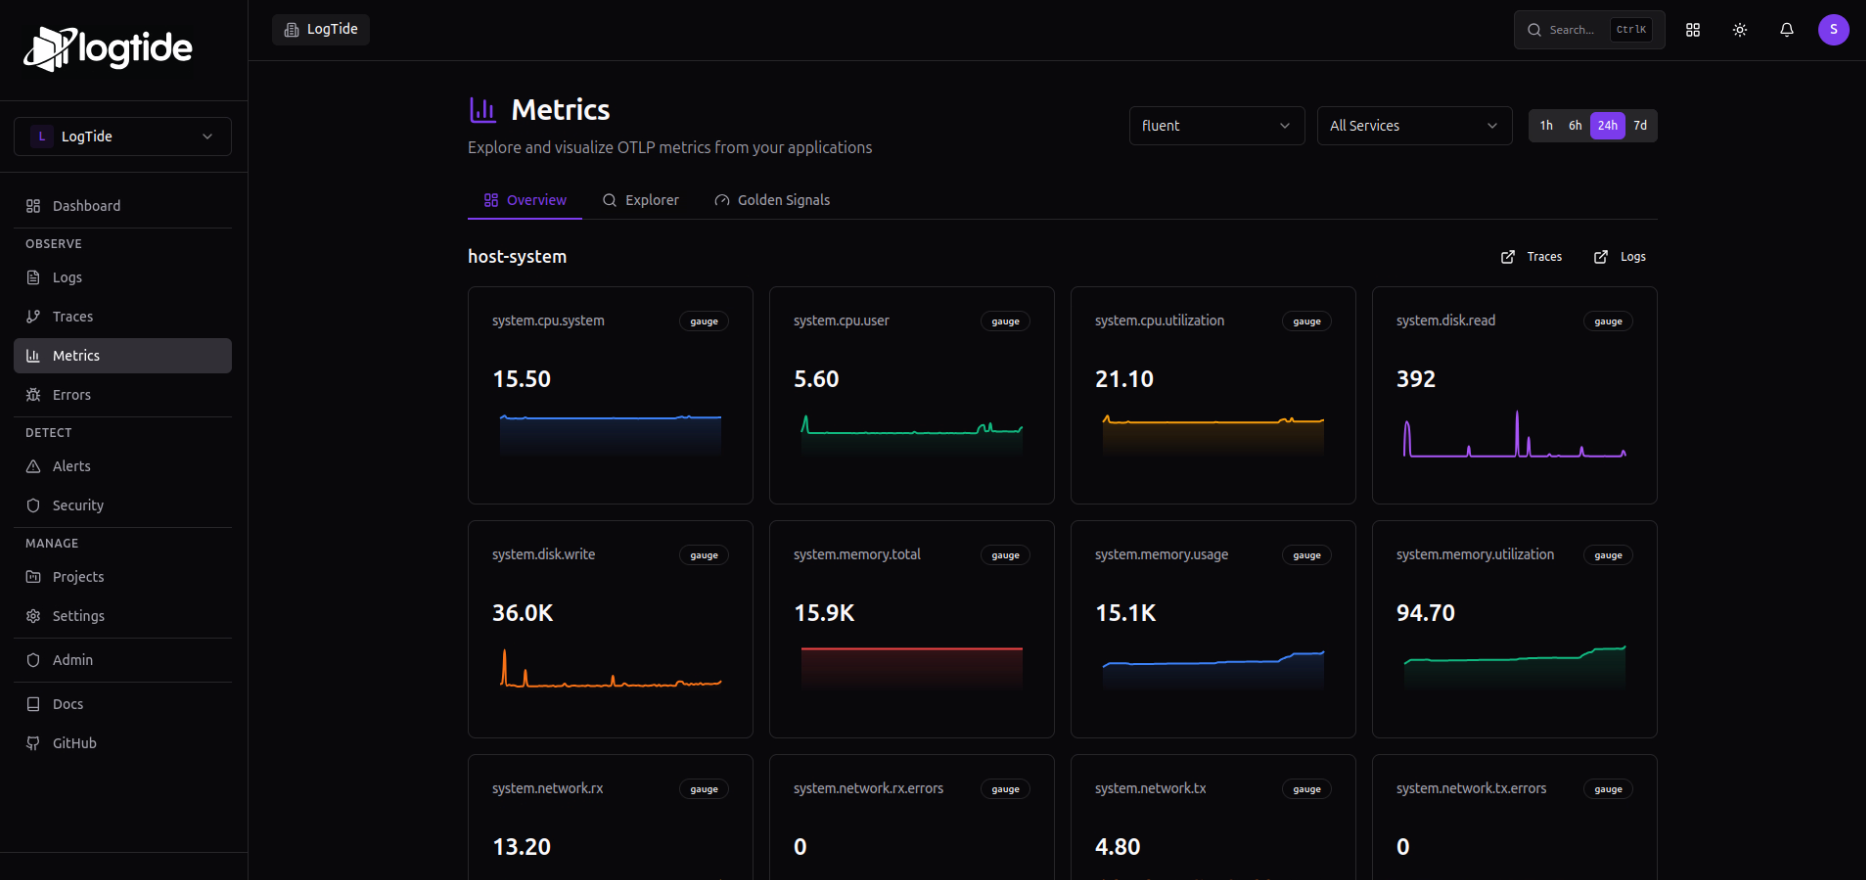
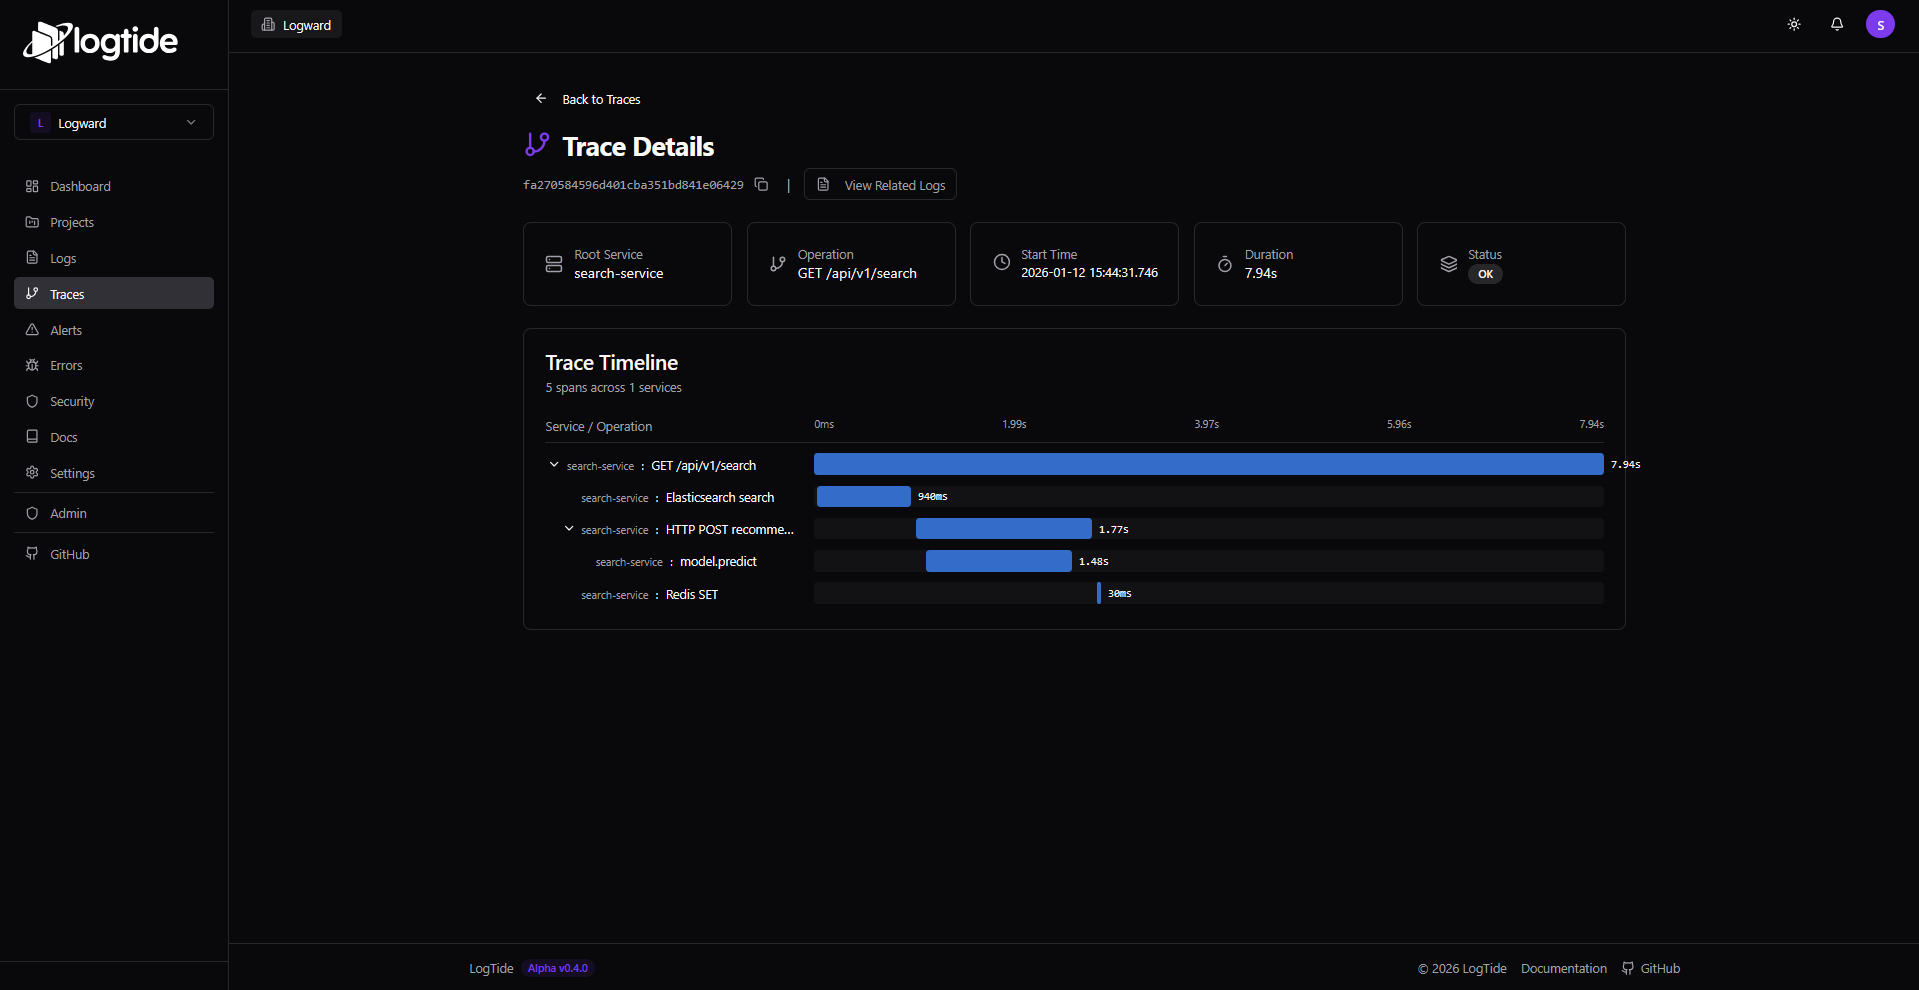
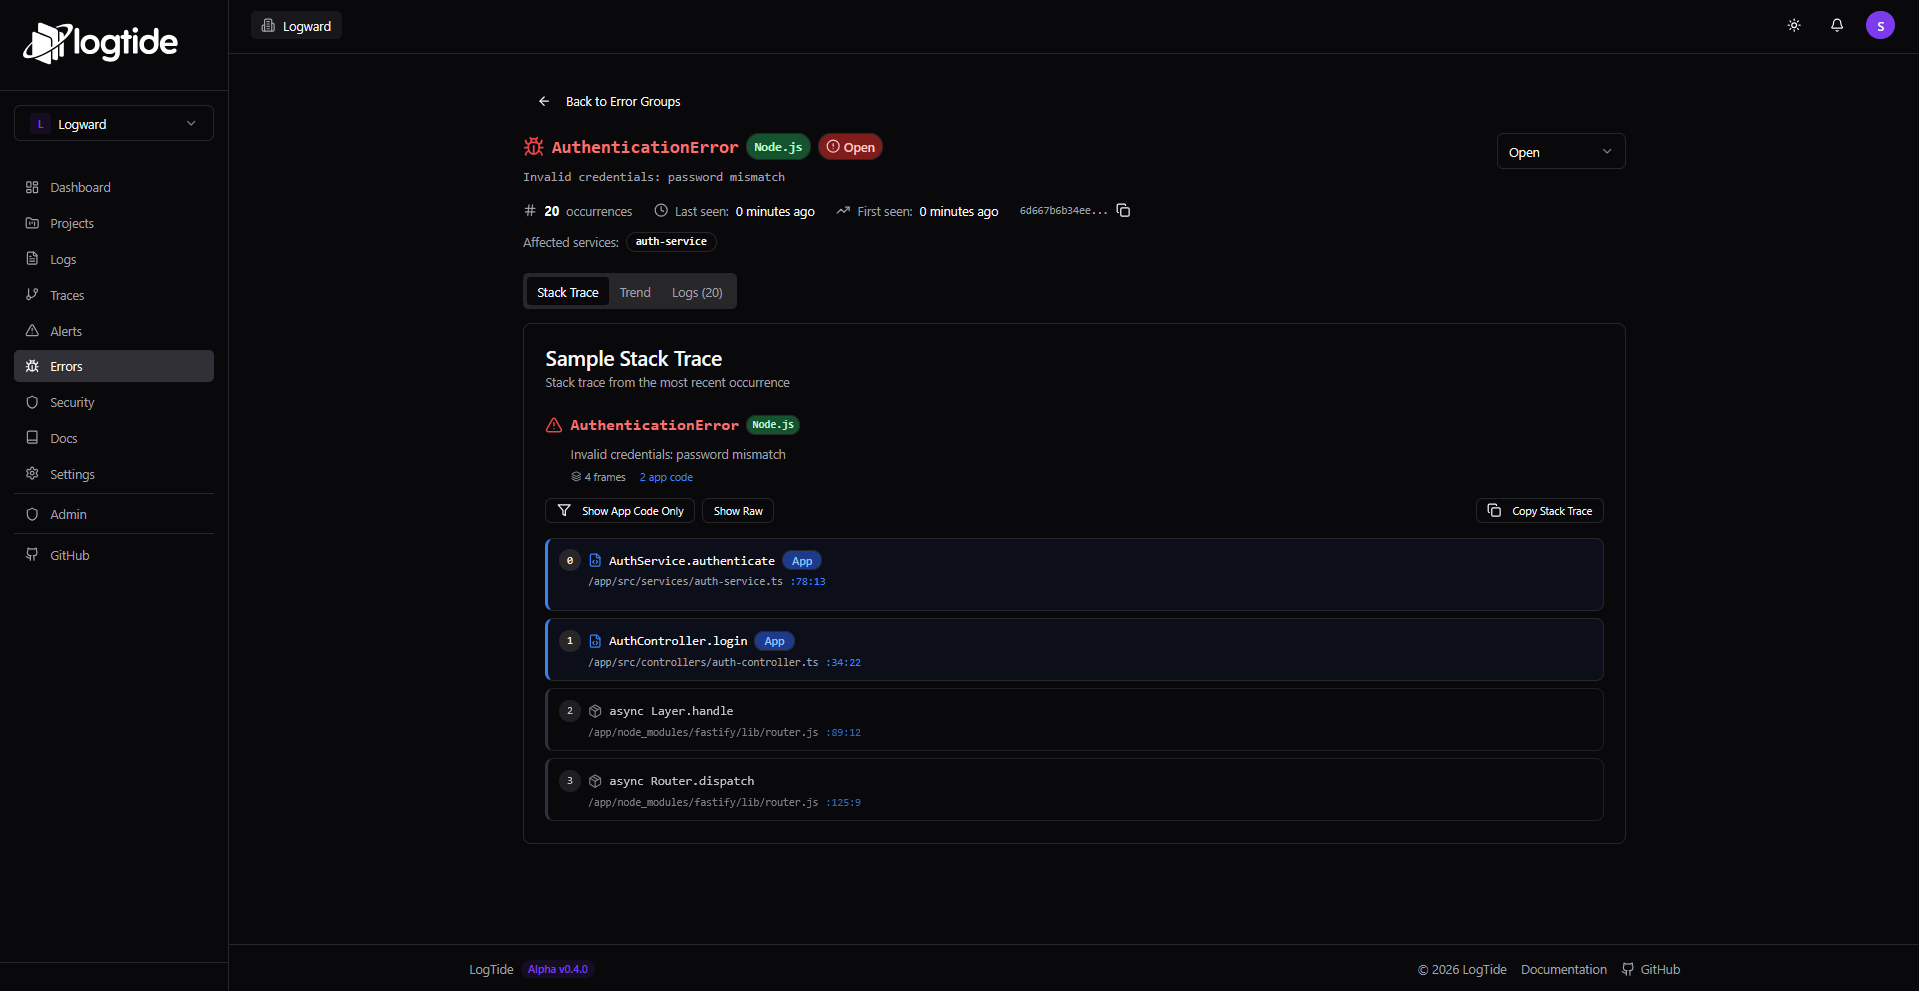
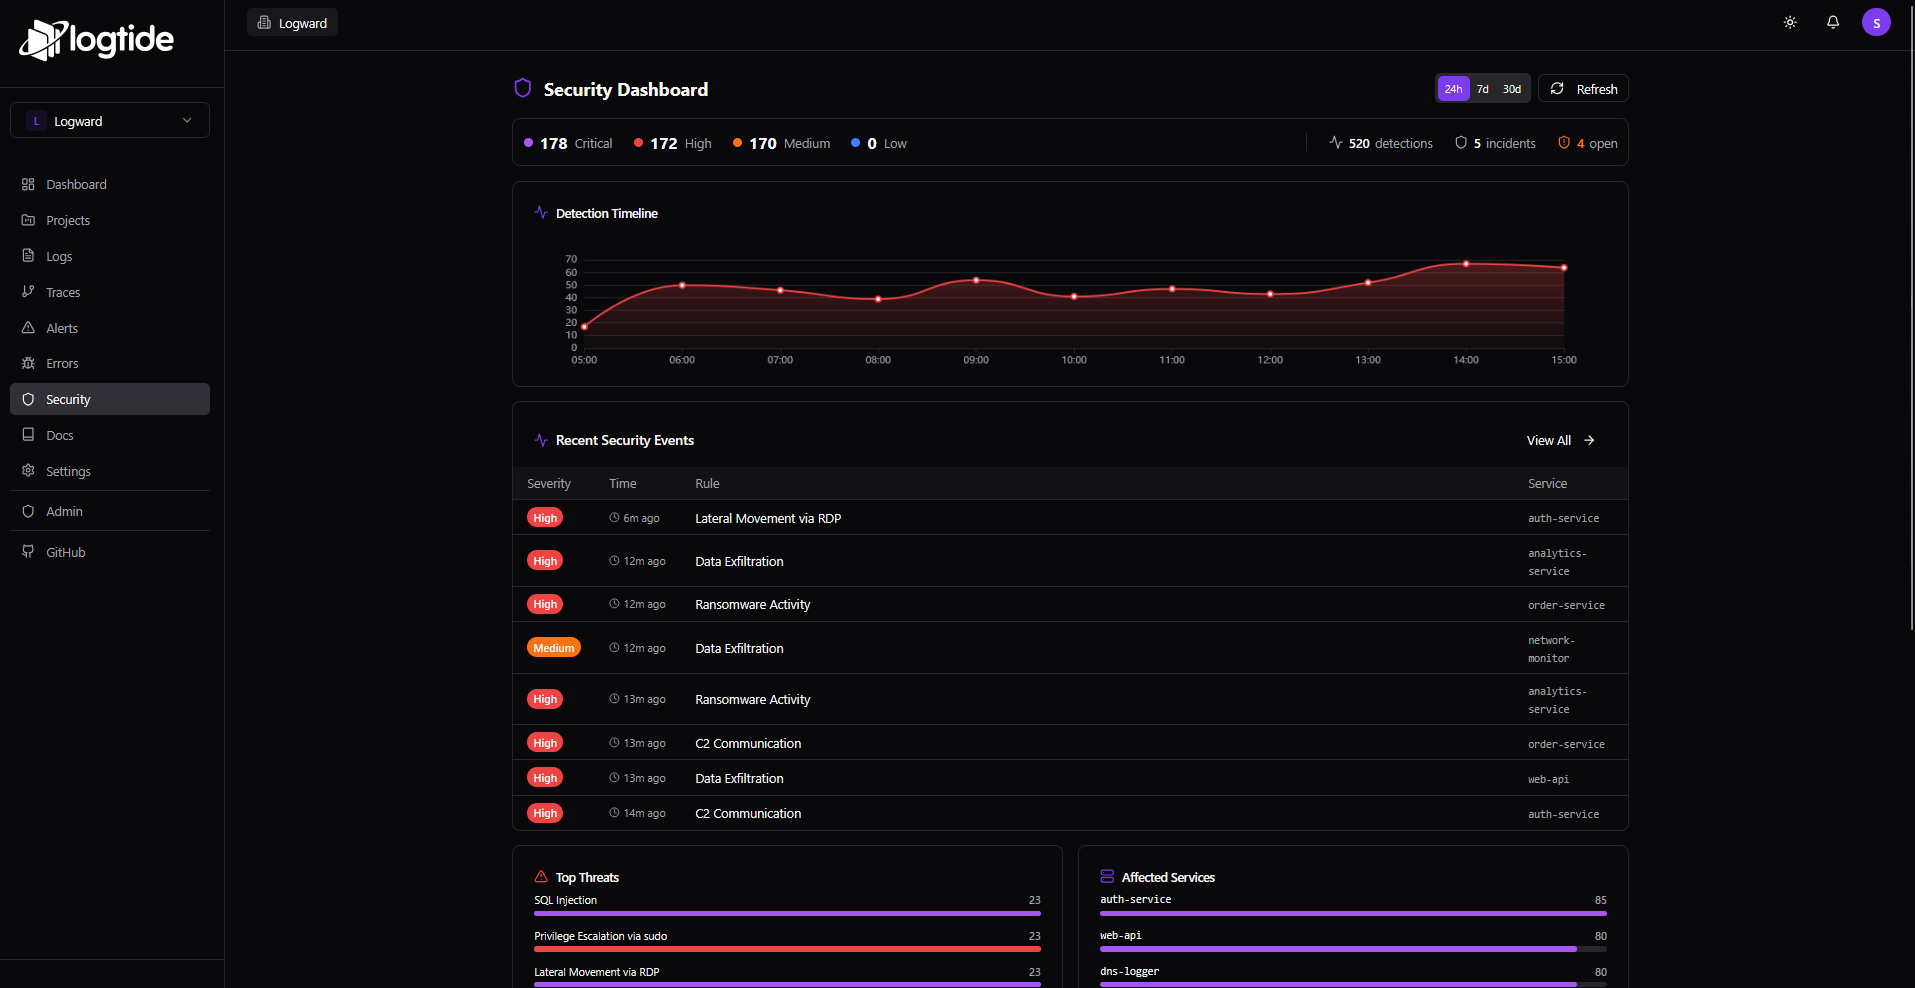
Every production incident starts the same way: someone asks "what do the logs say?" and the answer takes 45 minutes to find. LogTide collapses that search into seconds with a unified observability platform that indexes logs, traces, and metrics into a single queryable interface, backed by your choice of TimescaleDB, ClickHouse, or MongoDB. The log search interface supports full-text queries across millions of entries with filters for trace ID, session ID, project, service, hostname, and severity level, plus a live tail mode that streams new log lines as they arrive. Distributed traces render as waterfall timelines showing every span, its duration, and cross-service dependencies, while correlated logs for each trace are one click away. The metrics explorer visualizes OTLP gauge and counter data from your applications with system CPU, memory, disk, and network panels that update in near real-time. Where LogTide diverges from standard observability is its built-in SIEM engine: Sigma-compatible detection rules scan incoming logs for security threats like SQL injection, privilege escalation, lateral movement, and C2 communication, surfacing findings on a dedicated security dashboard with severity distribution, detection timelines, and affected service breakdowns. Alerting pushes notifications to Email, Slack, or Discord webhooks when thresholds trip or security rules fire. Native SDKs for Node.js, Python, Go, PHP, Kotlin, and Ruby ship logs with retry logic and circuit breakers, and the platform accepts OpenTelemetry data natively. Running on a dedicated VPS on RepoCloud with guaranteed CPU, RAM, and SSD, full root SSH access, and a browser serial console. AGPL-3.0 licensed.
Benefits
- Logs, Traces, and Metrics Unified
- Search millions of log entries, visualize distributed trace waterfalls, and monitor OTLP metrics from a single interface instead of switching between three separate tools.
- Built-in SIEM Security Detection
- Sigma-compatible detection rules scan logs for SQL injection, privilege escalation, ransomware activity, and C2 communication, surfacing findings on a dedicated security dashboard.
- Multi-Engine Storage Flexibility
- Deploy with TimescaleDB for SQL familiarity, ClickHouse for high-throughput analytics, or MongoDB for document-oriented workloads, choosing the engine that fits your scale and query patterns.
- GDPR-Compliant Data Ownership
- All log data stays on your infrastructure with no external dependencies, meeting GDPR and SOC2 audit trail requirements without per-GB fees or vendor lock-in.
Features
- Log Search and Live Tail
- Full-text search across logs with filters for trace ID, session, project, service, and severity. Live tail streams new entries as they arrive in real time.
- Distributed Tracing
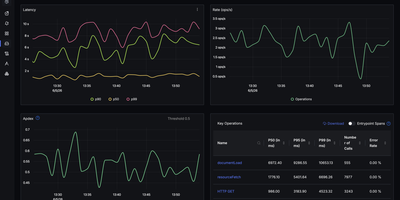
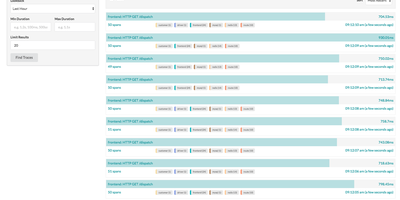
- Waterfall timeline visualization of spans across services with duration breakdown, correlated logs per trace, and root cause identification for slow requests.
- Metrics Explorer
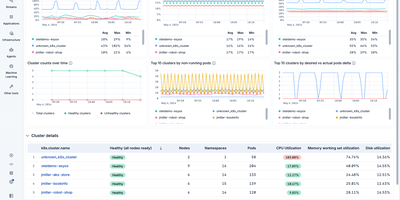
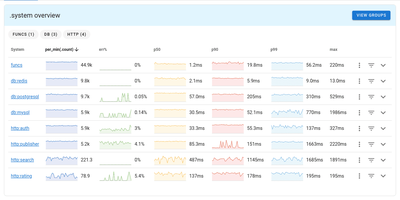
- OTLP metric visualization with system CPU, memory, disk, and network panels, plus custom gauge and counter displays with sparkline charts.
- Security Dashboard
- Sigma-rule-based threat detection with severity distribution, detection timelines, top threats ranking, affected services breakdown, and incident management.
- Multi-Language SDKs
- Native SDKs for Node.js, Python, Go, PHP, Kotlin, and Ruby with retry logic and circuit breakers, plus native OpenTelemetry OTLP ingestion.