SaaS Alternative
Taskforce.shCategories
Self-Hosted Developer Tools Observability Dashboard Redis Job Queues Queue Monitoring BullMQStars
Forks
Watchers
Developer links
bullstudio
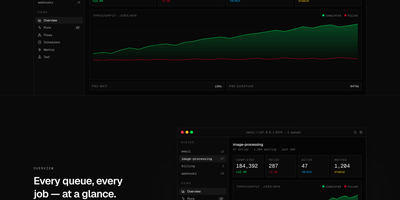
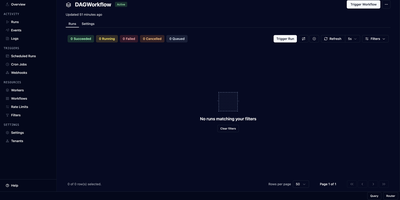
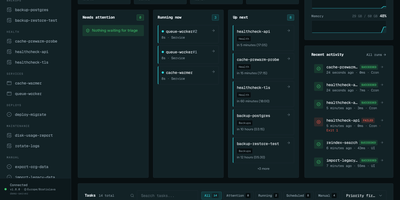
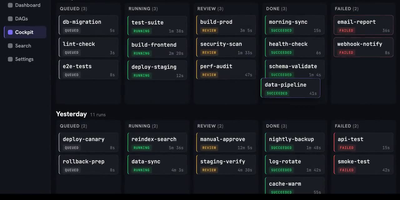
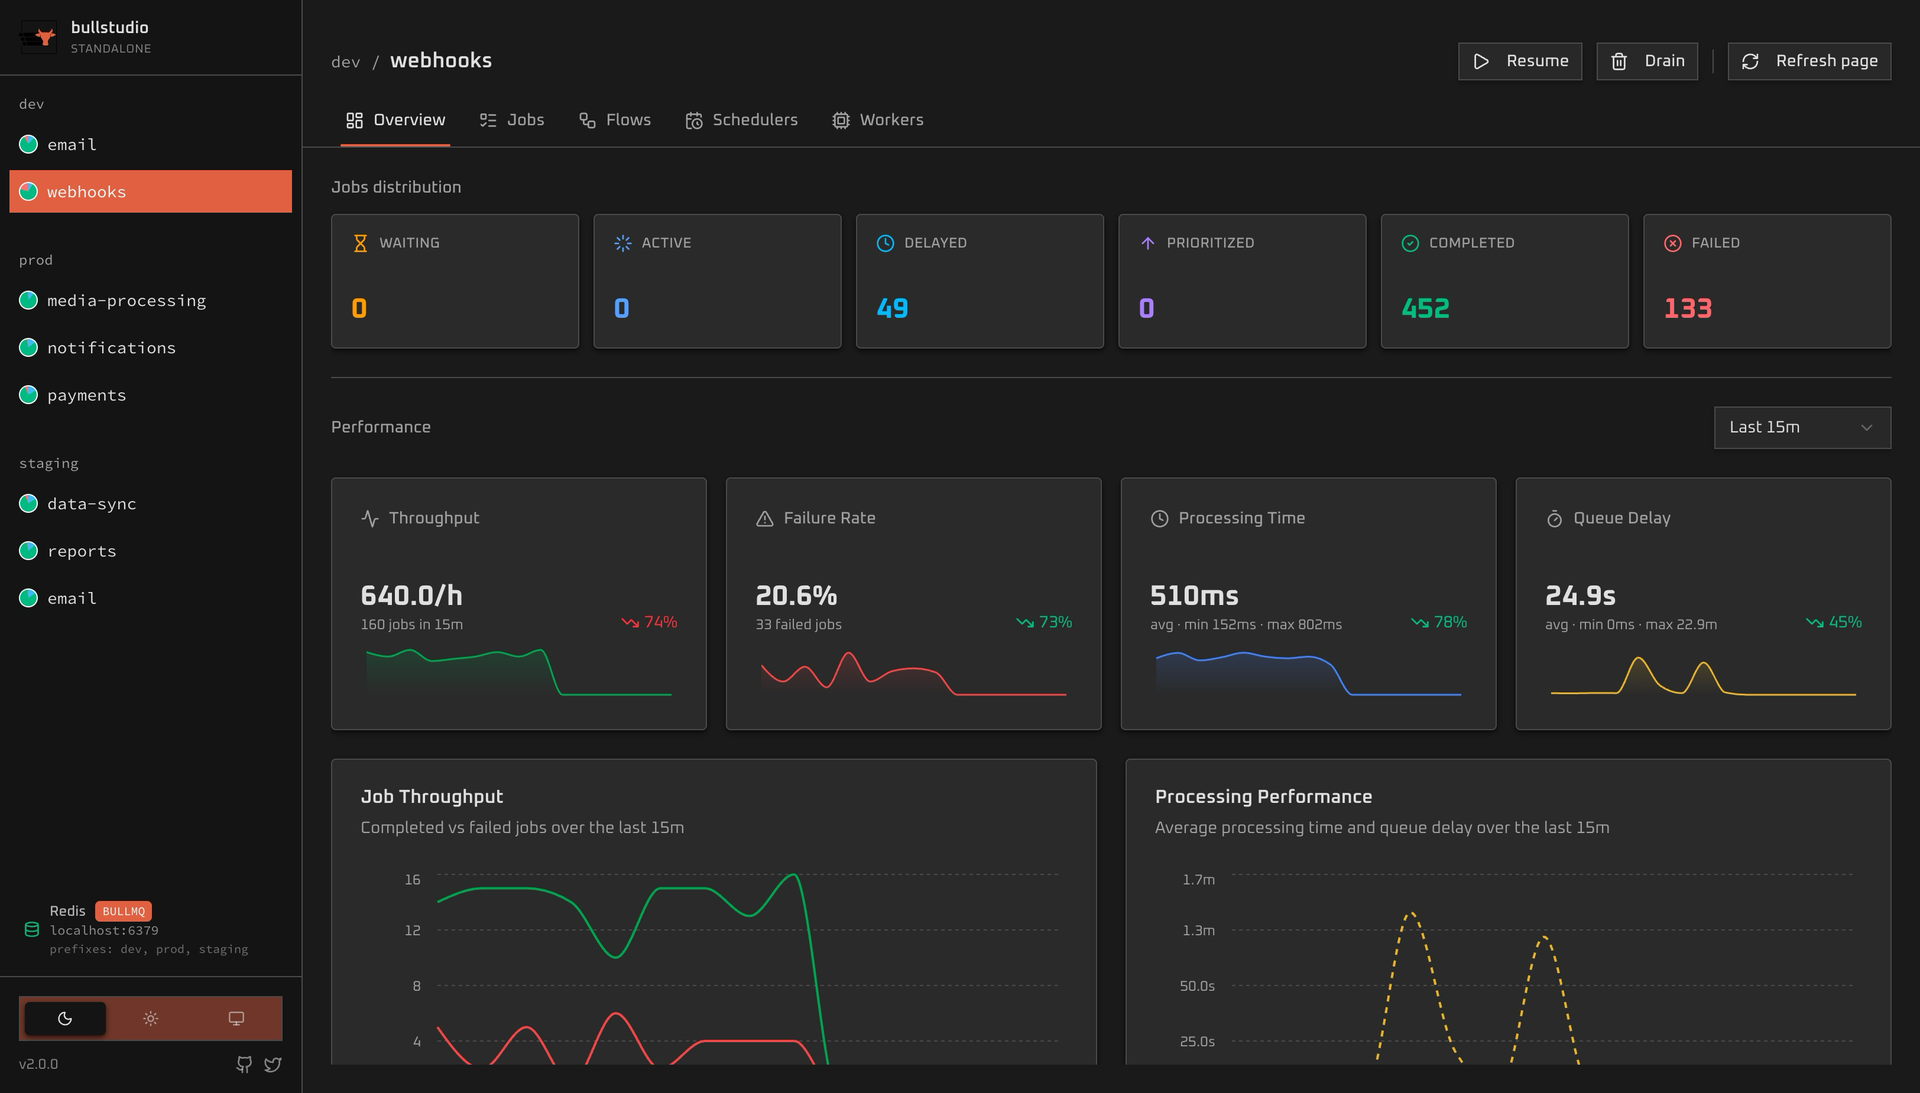
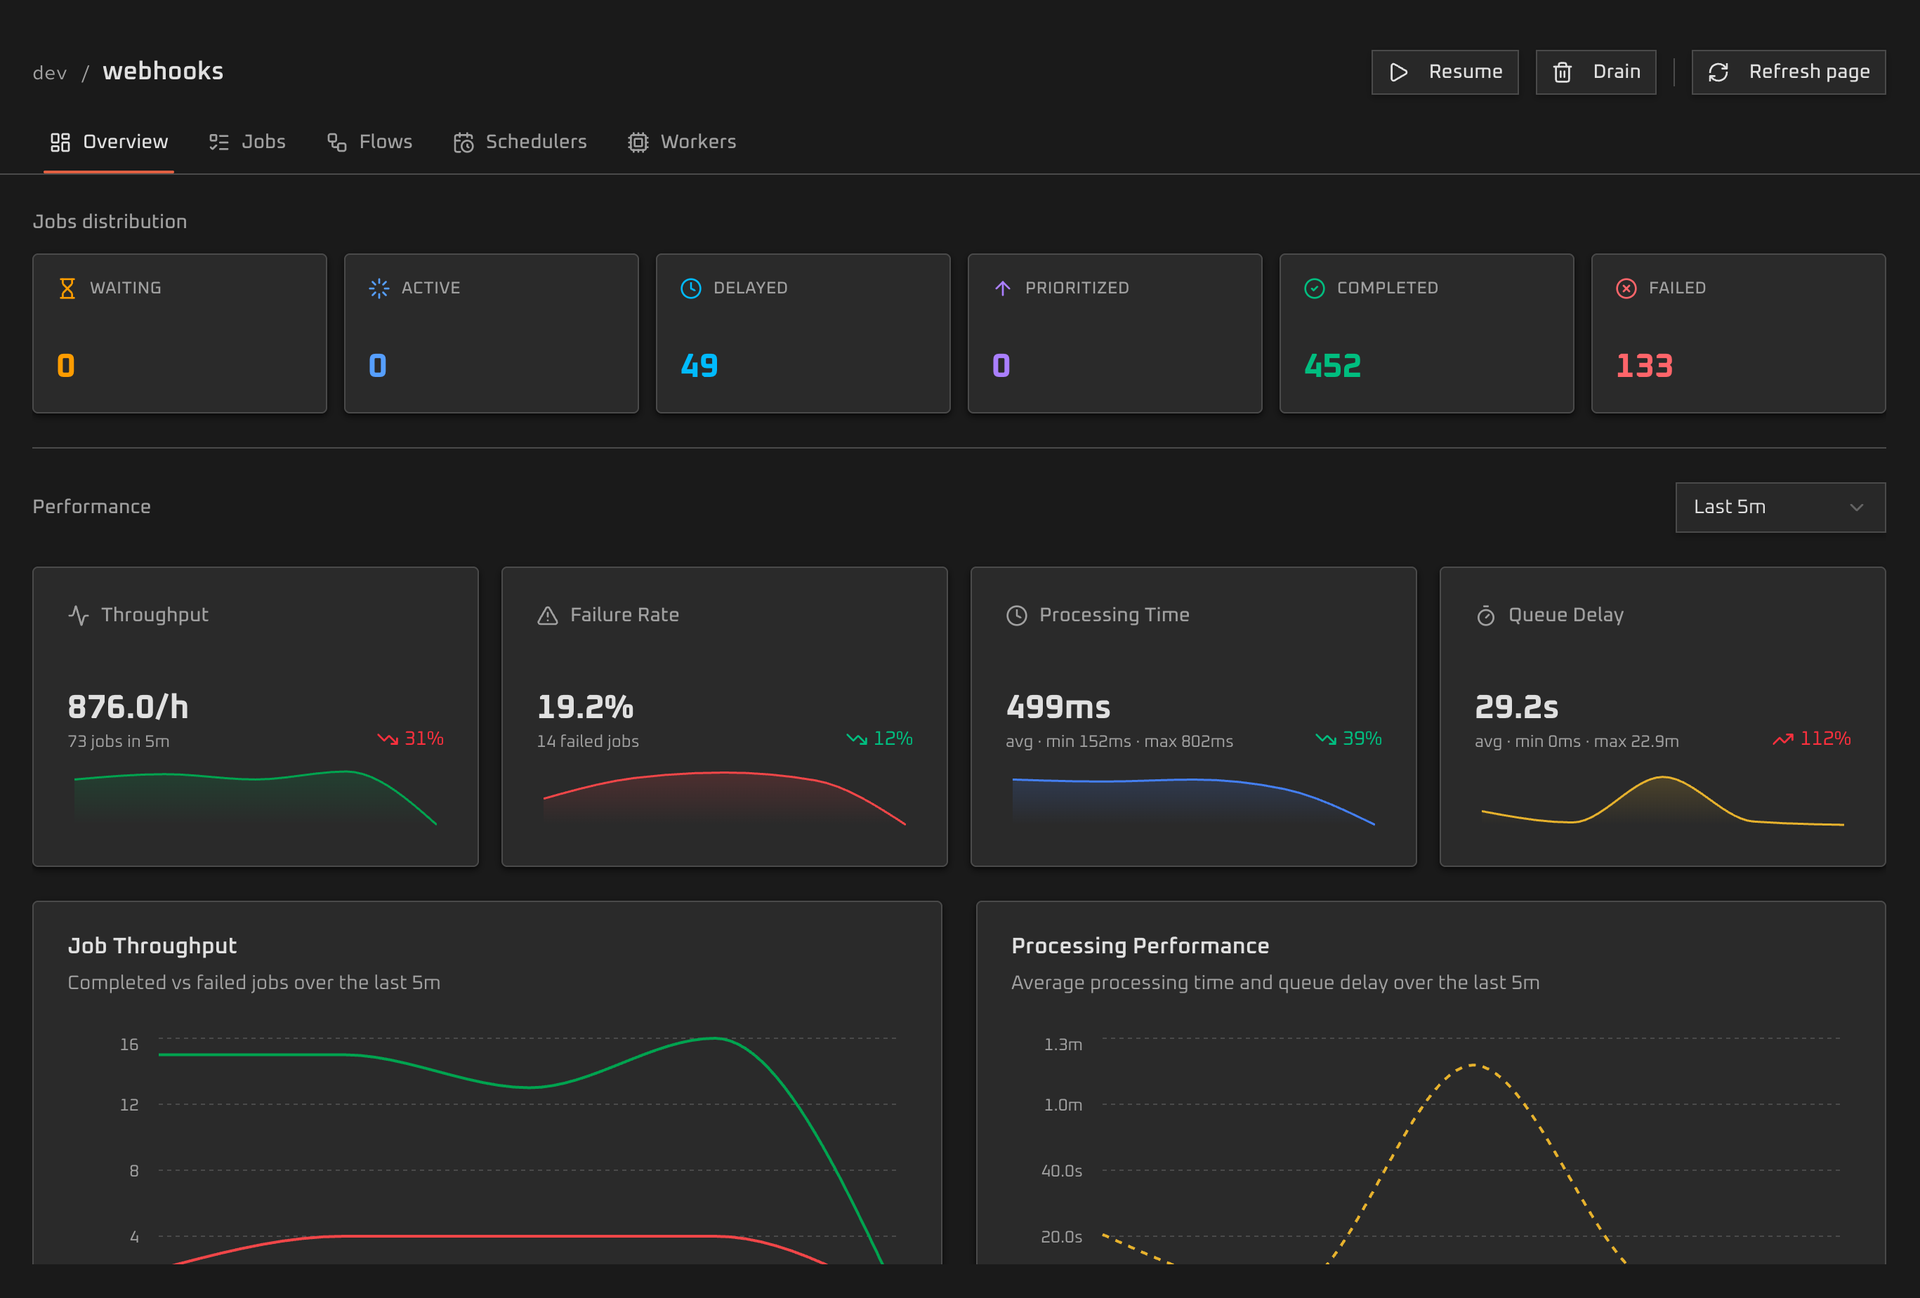
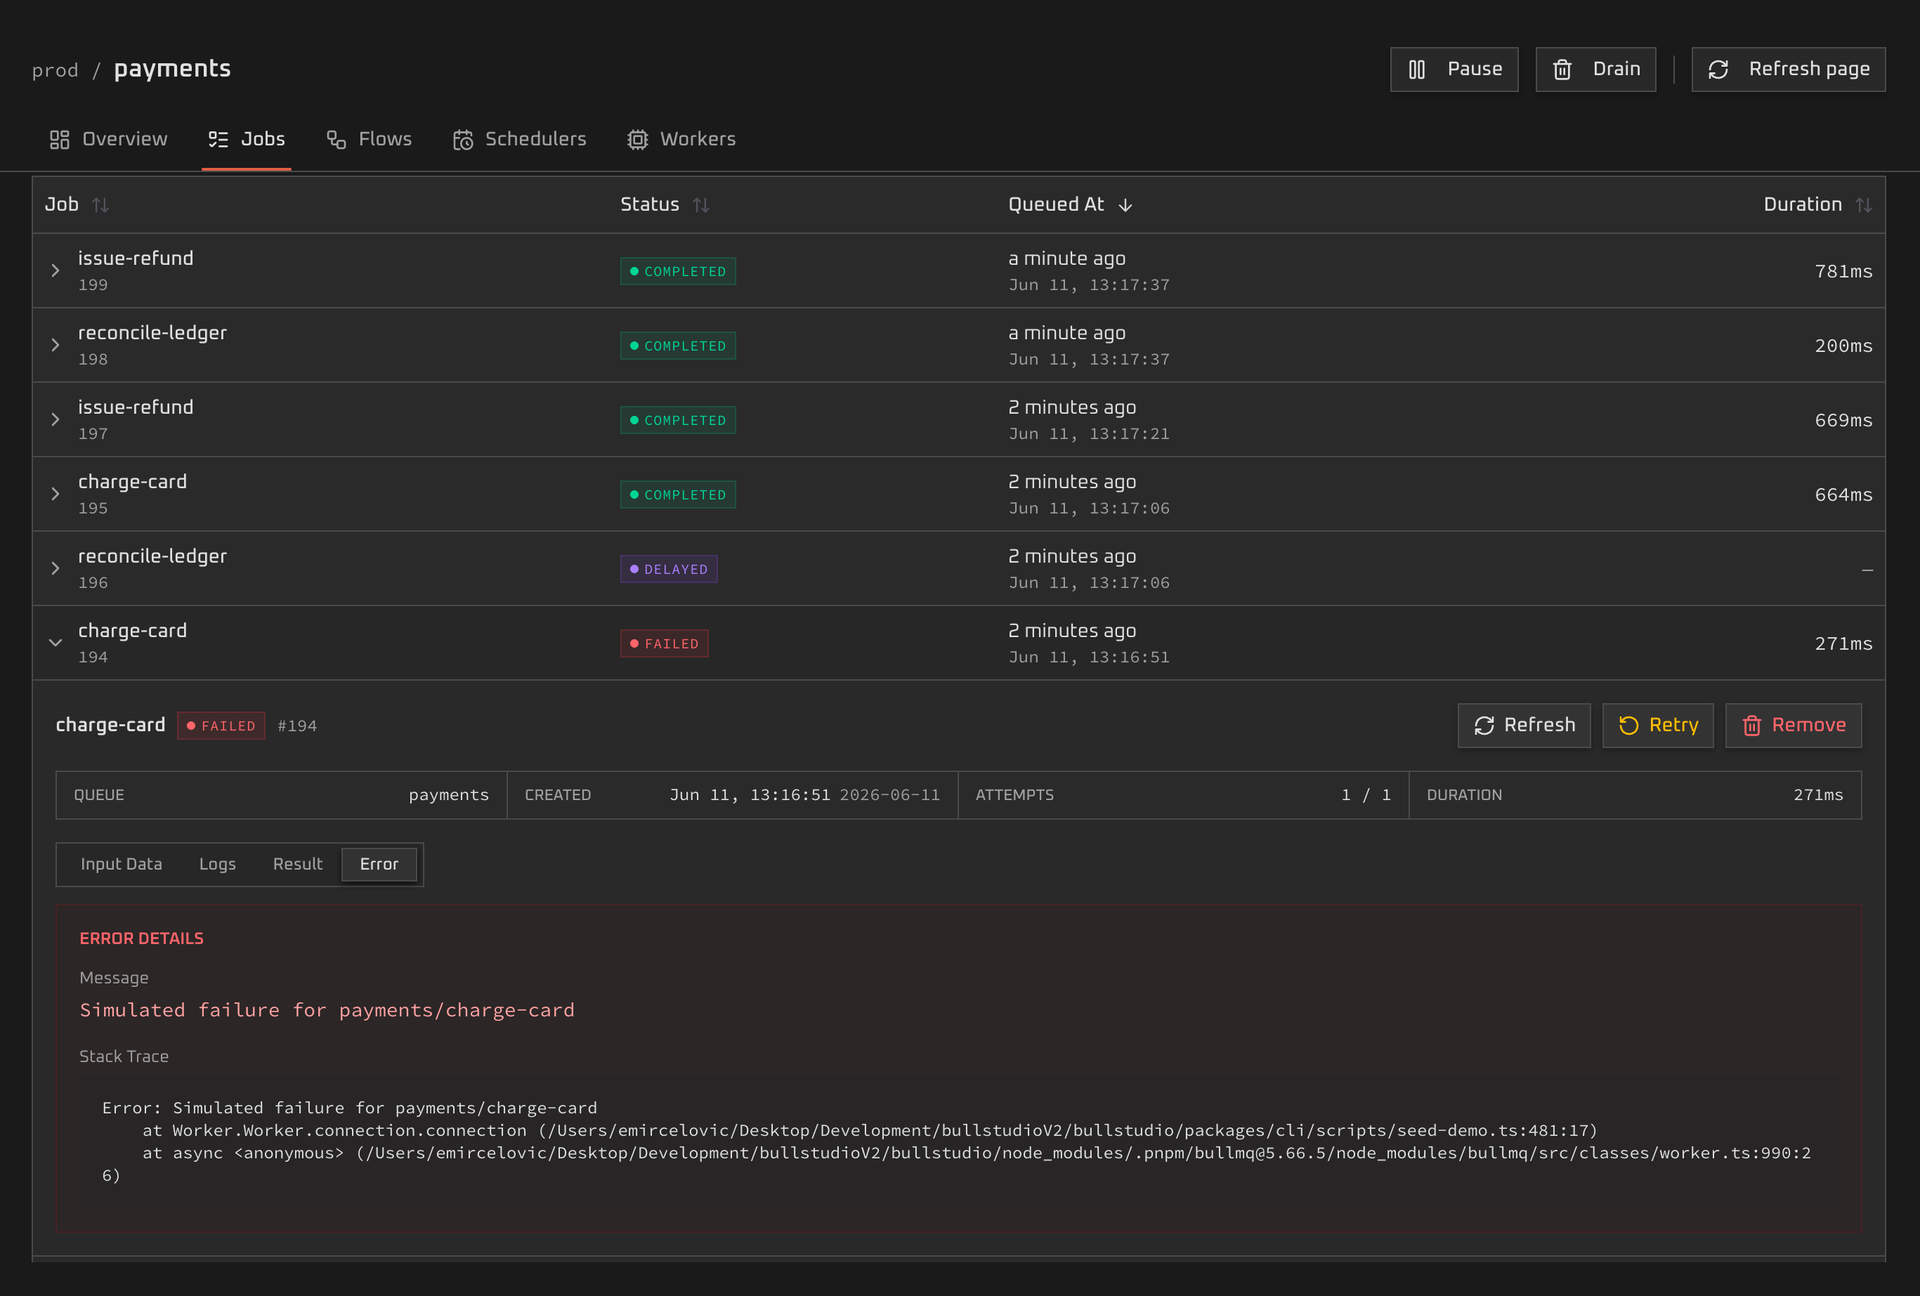
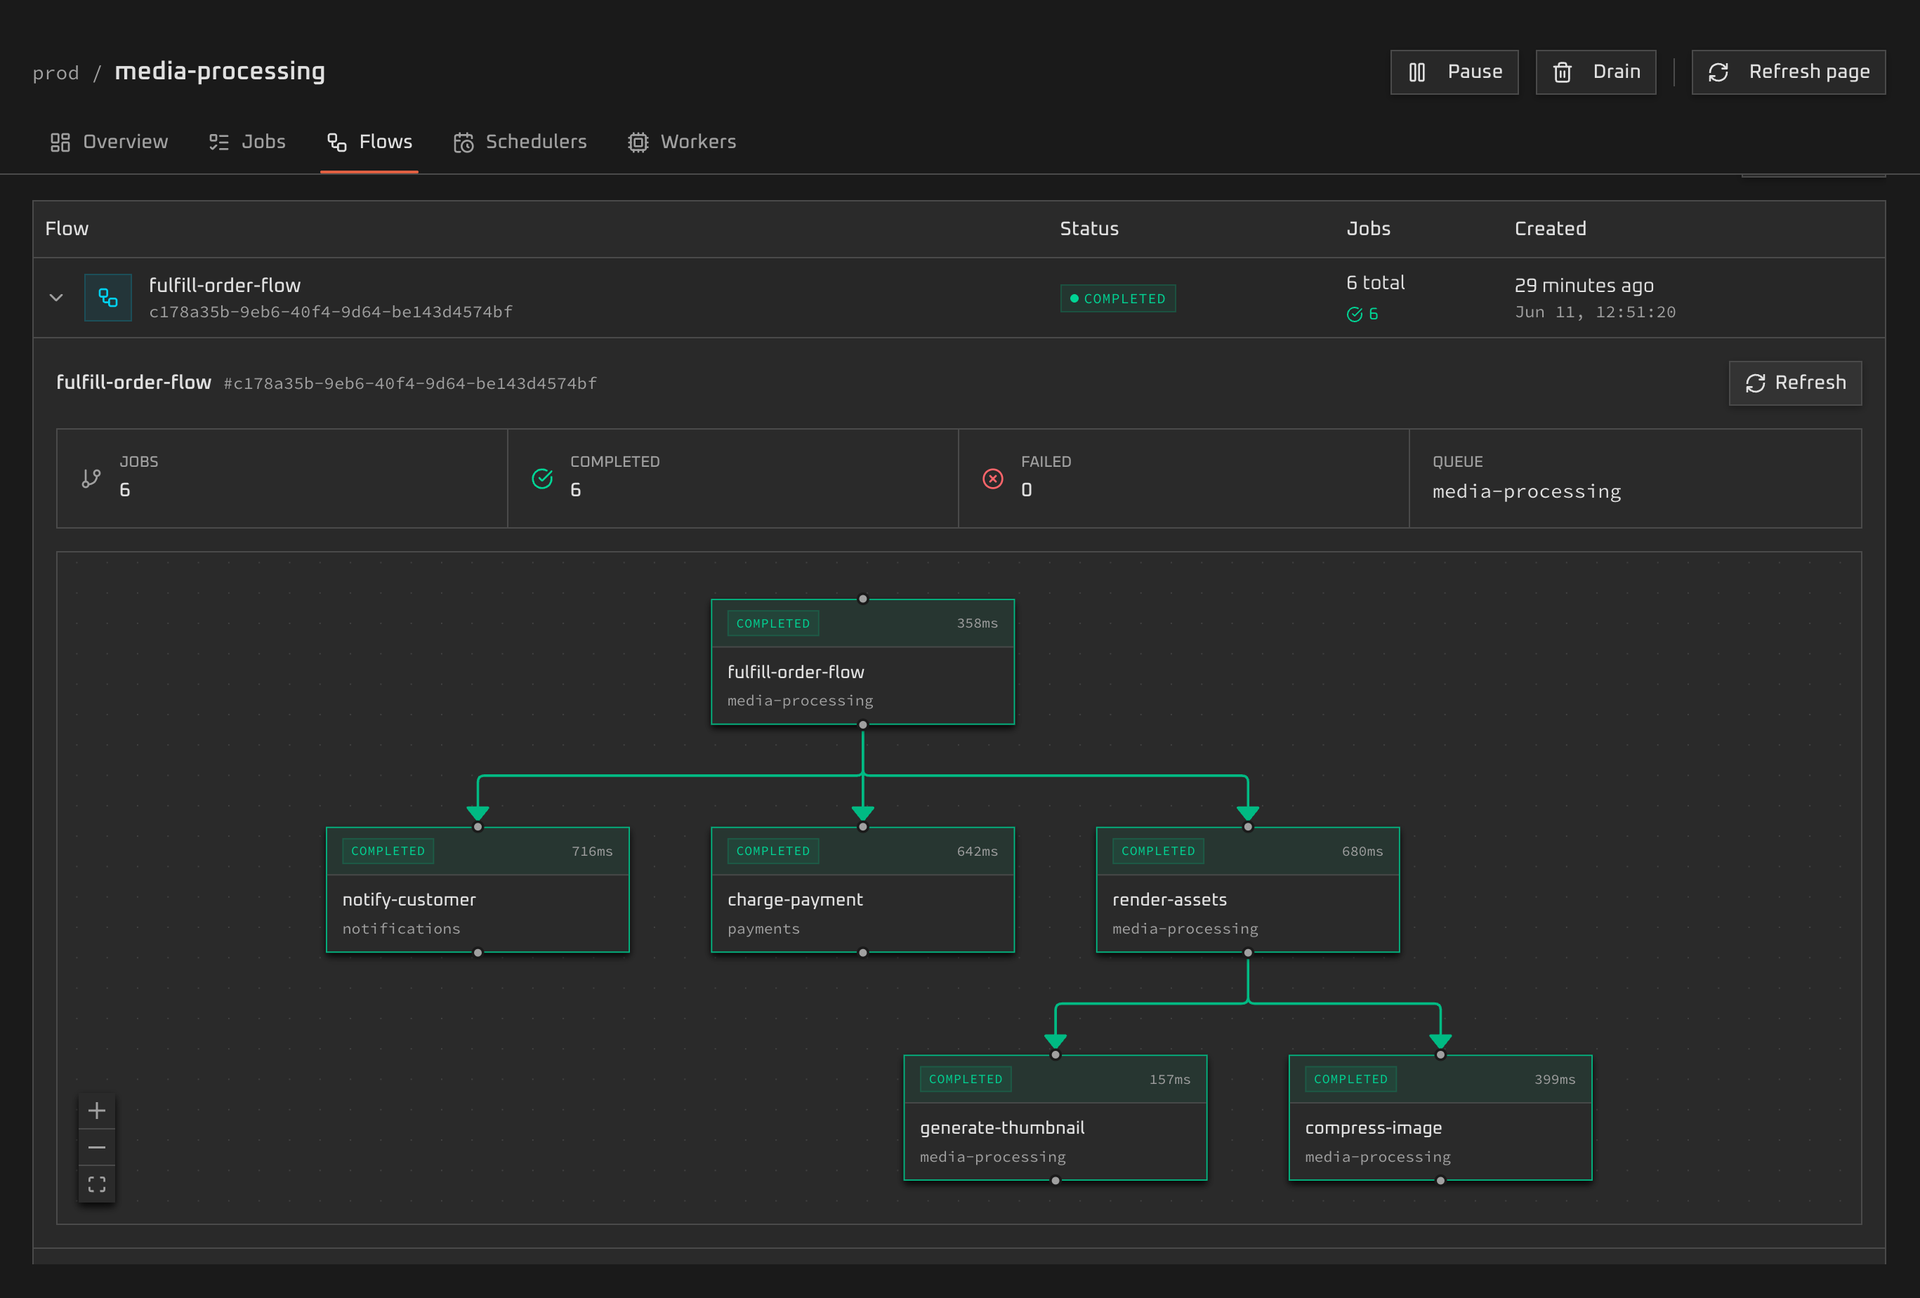
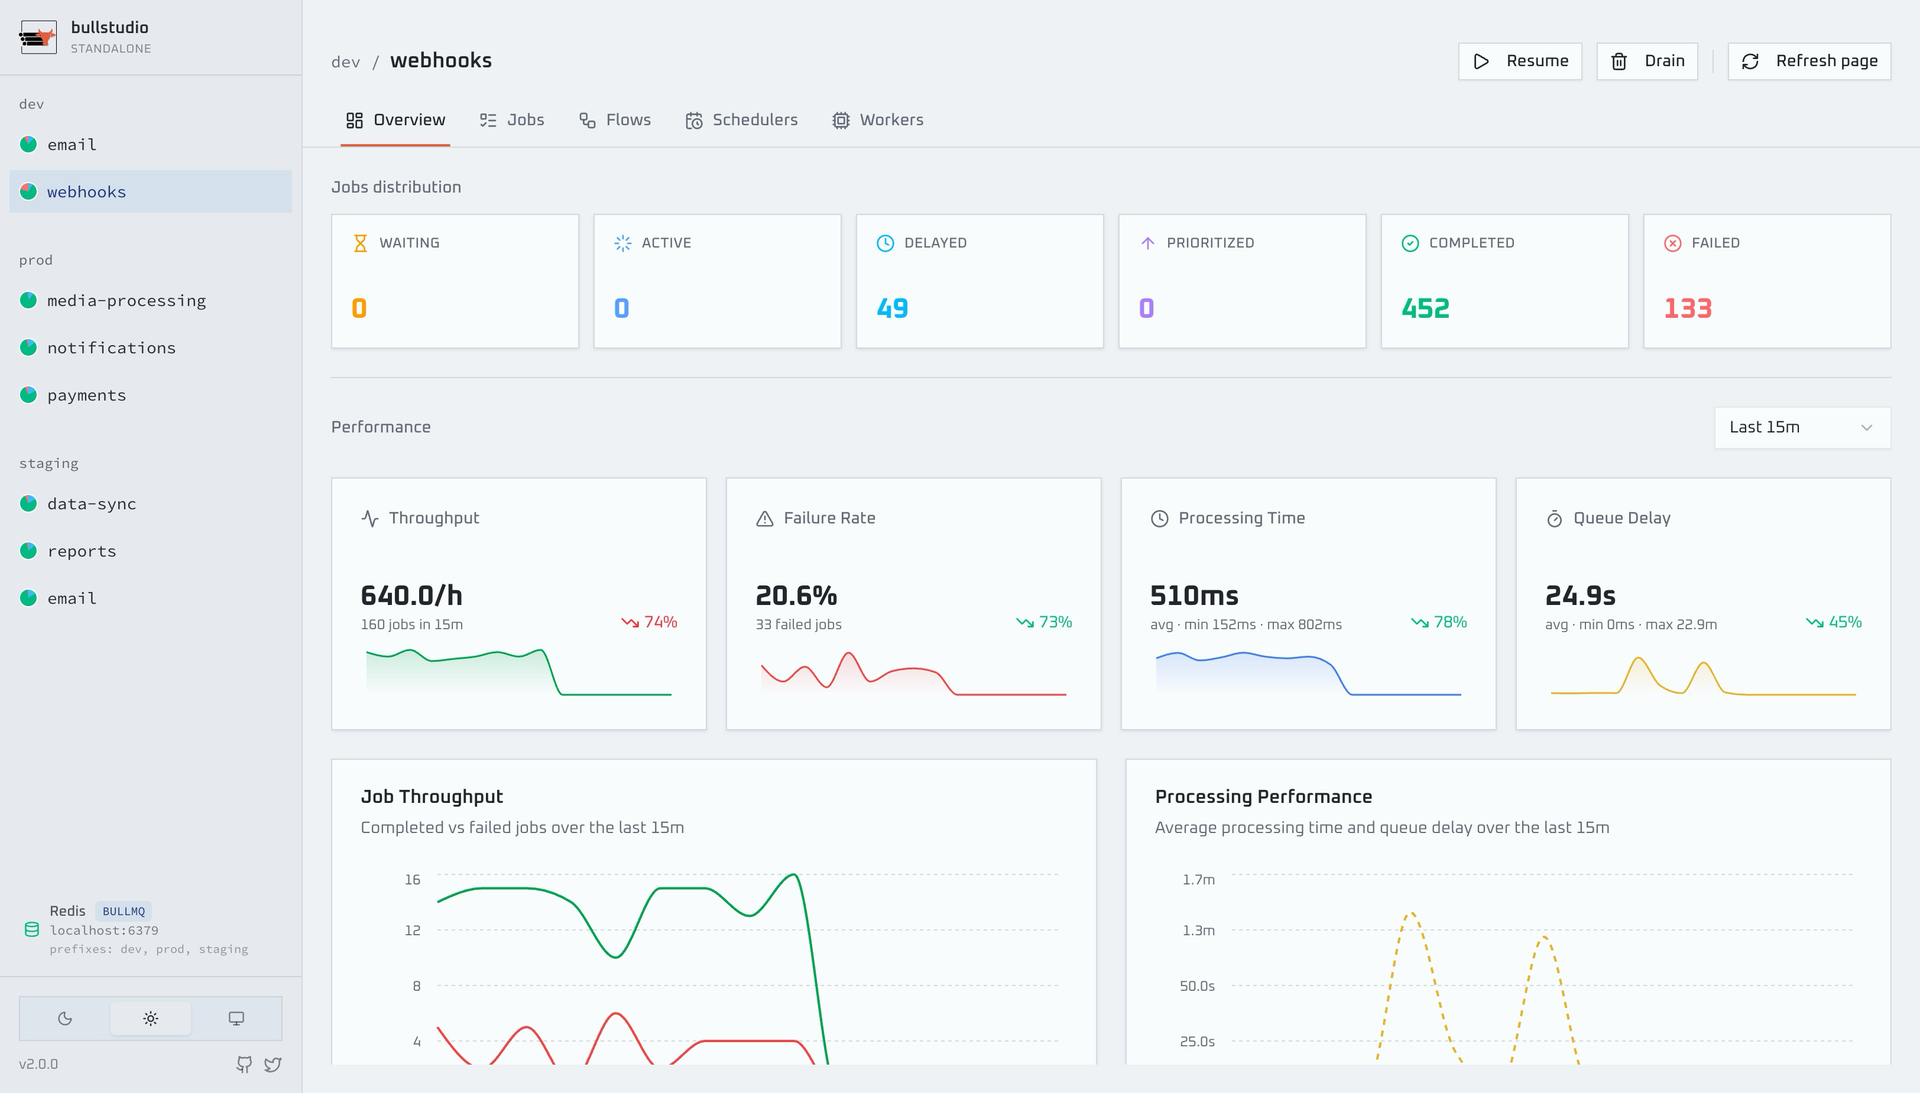
bullstudio turns a pile of opaque Redis keys into a live control panel for your BullMQ and Bull queues, so you can see what is stuck, failing, or delayed without opening a Redis CLI. Point it at a Redis URL and it discovers every queue and prefix on its own, including Redis Cluster setups. The overview page tracks waiting, active, delayed, prioritized, completed, and failed counts next to throughput, failure rate, processing time, and queue delay charts. Open any job to read its input data, logs, return value, and stack trace, then retry, promote, or remove it in one click. Flow view draws parent and child jobs as a color-coded dependency graph, which makes it easy to spot the step where a multi-stage job stalled. Separate screens list connected workers with their concurrency and heartbeat, and show repeatable and cron schedules with their next run time. Pause, resume, drain, or clean a queue directly from the header. Basic authentication, a read-only mode, and a base path for reverse proxies keep access under control. Running on a dedicated VPS on RepoCloud with guaranteed CPU, RAM, and SSD, full root SSH access, and a browser serial console. MIT licensed.
Benefits
- See Queue Health Instantly
- Live counts for waiting, active, delayed, completed, and failed jobs sit beside throughput and failure-rate charts, so backlogs and error spikes show up before users notice.
- Fix Failed Jobs Without Redis
- Inspect payloads, logs, and stack traces for any job, then retry, promote, or remove it from the browser instead of hand-editing keys through a Redis command line.
- Trace Stalled Multi-Step Flows
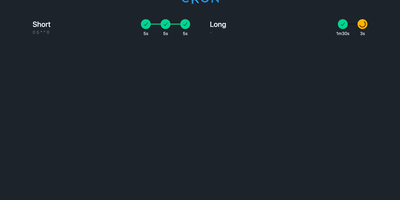
- Parent and child jobs appear as a color-coded dependency graph with per-step status and duration, which shows exactly which stage of a workflow failed or stopped moving.
- Zero Code Integration
- Point the container at a Redis URL and every Bull or BullMQ queue is discovered automatically, with no adapters or changes to the applications that produce the jobs.
Features
- Queue Overview Dashboard
- Per-queue cards and charts show job state counts, throughput per hour, failure rate, average processing time, and queue delay over selectable time windows.
- Job Inspector
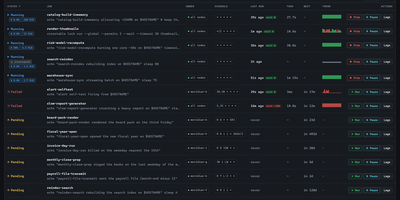
- Browse jobs by state, search by name or ID, and open a row to read input data, logs, results, and errors with retry and remove actions.
- Flow Dependency Graph
- BullMQ parent and child jobs render as a zoomable node graph, color-coded by state, with completion times on every step.
- Workers And Schedulers
- Live worker views list what each worker is processing, and scheduler pages show repeatable and cron jobs with their patterns and next run times.
- Access And Proxy Controls
- Basic authentication, a read-only mode, Redis Cluster support, multi-prefix discovery, and a configurable base path make it safe to expose behind a reverse proxy.