Categories
Self-Hosted Developer Tools AI Agents Monitoring Observability Model Context Protocol OpenTelemetry MCP AnalyticsStars
Forks
Watchers
Developer links
mcpspan
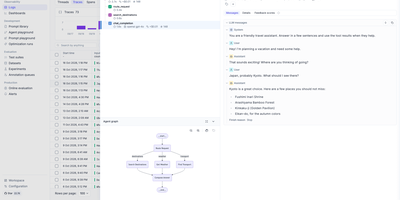
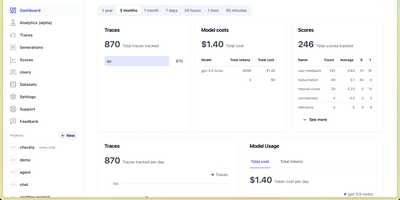
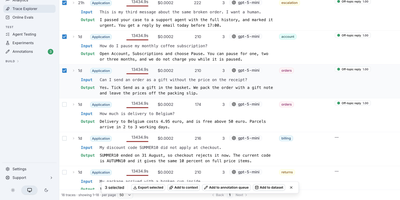
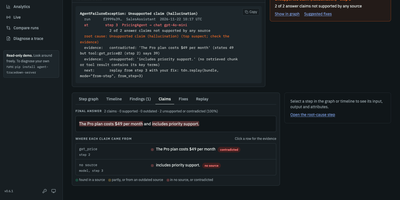
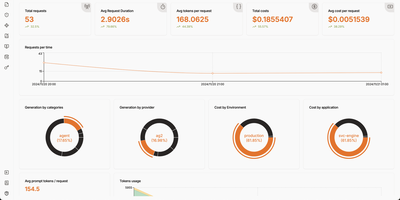
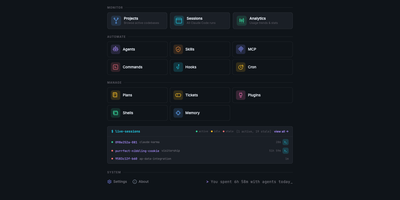
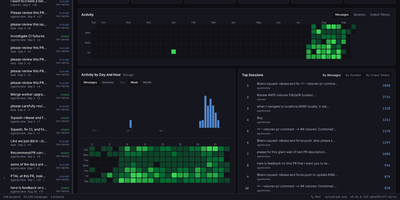
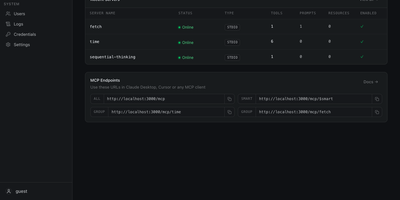
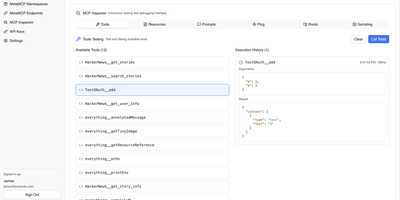
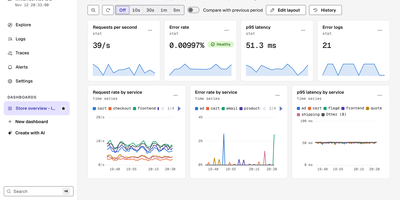
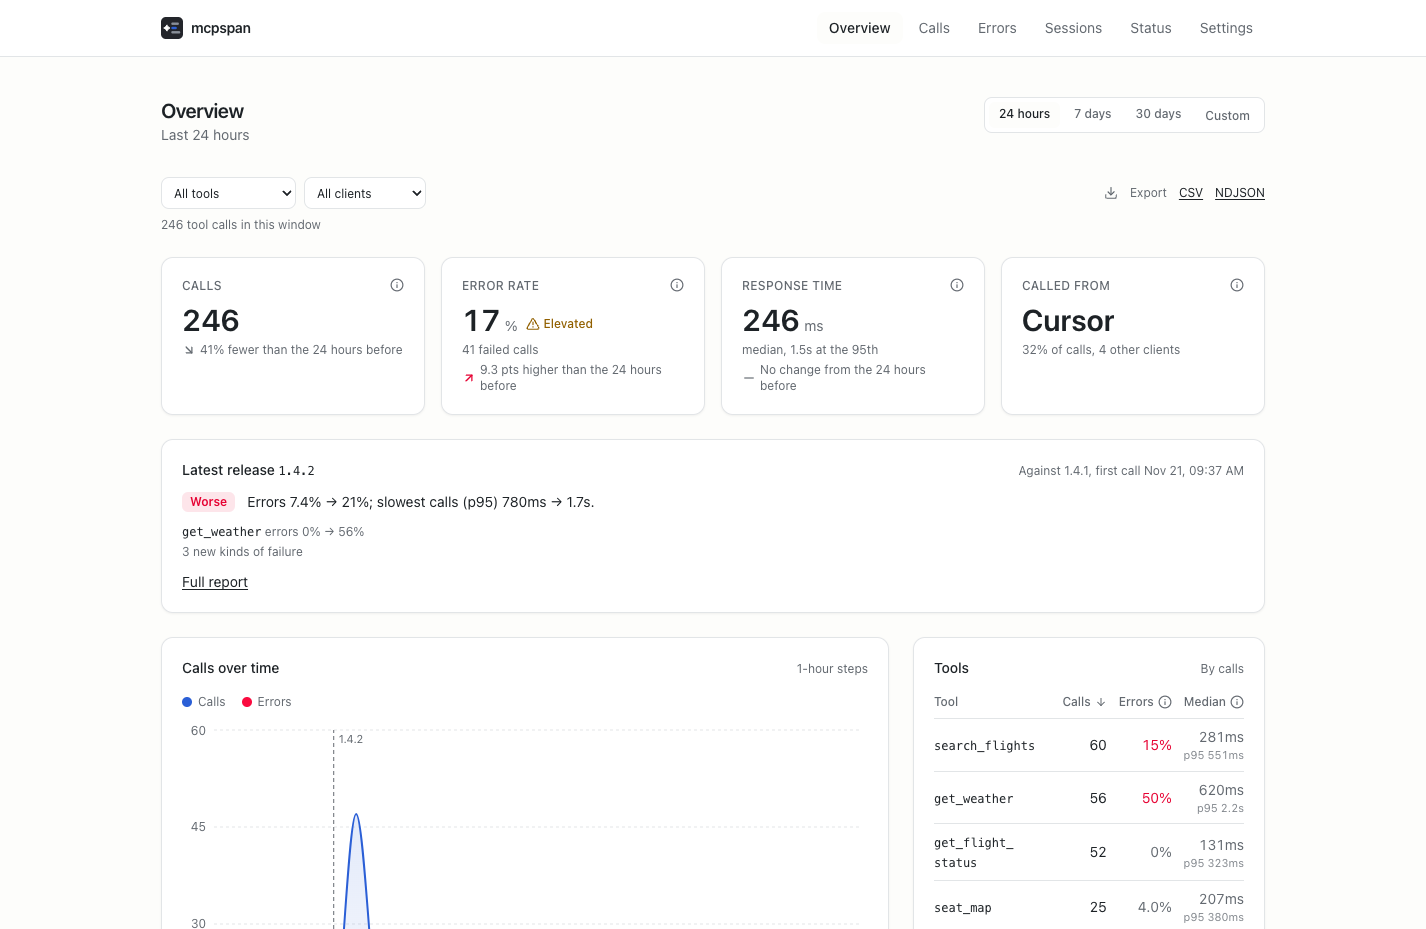
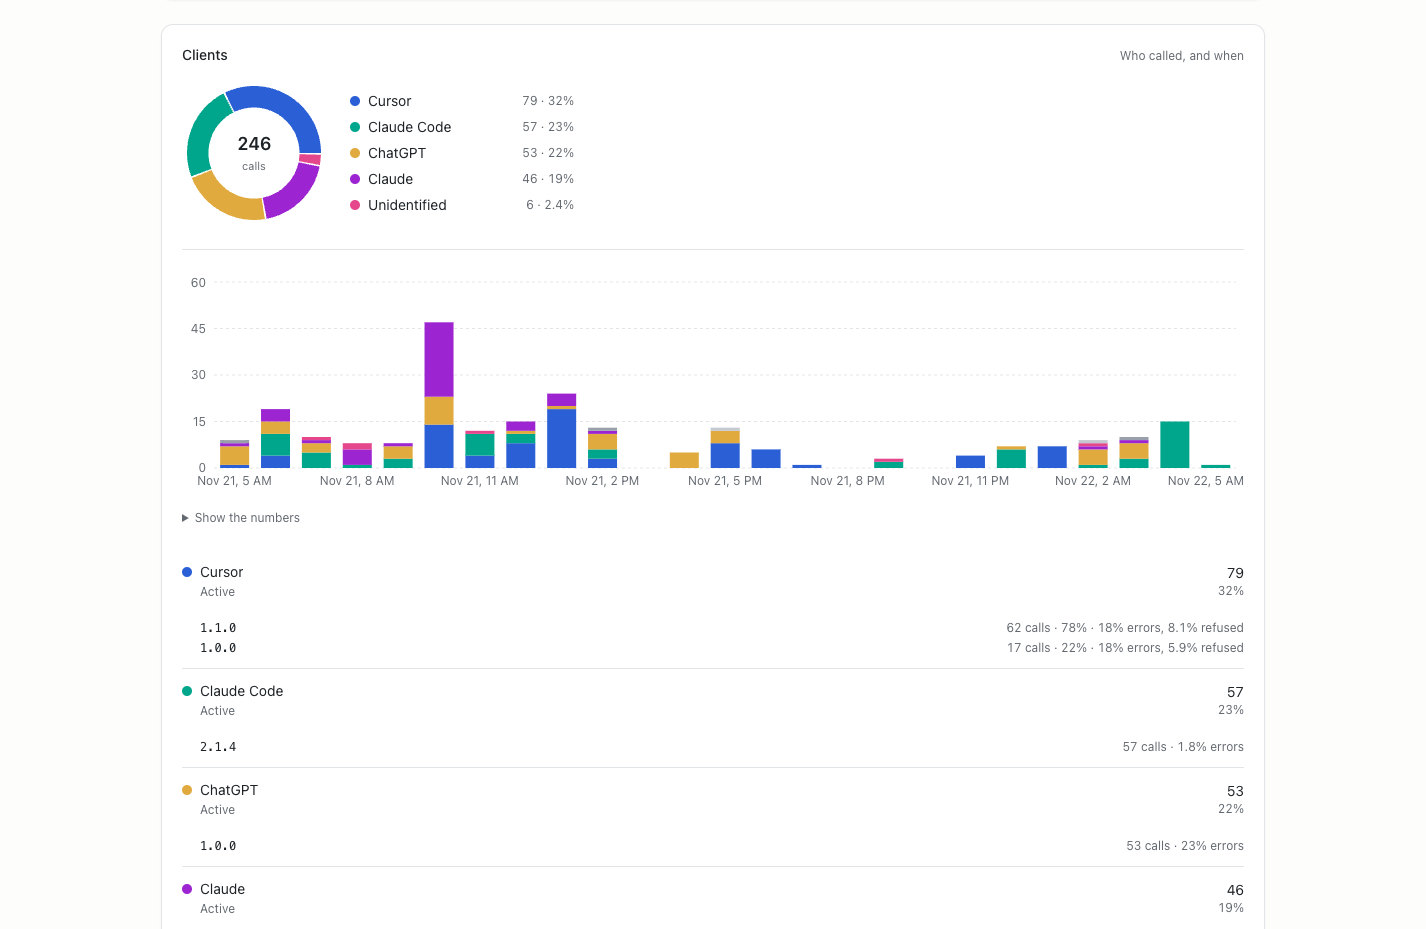
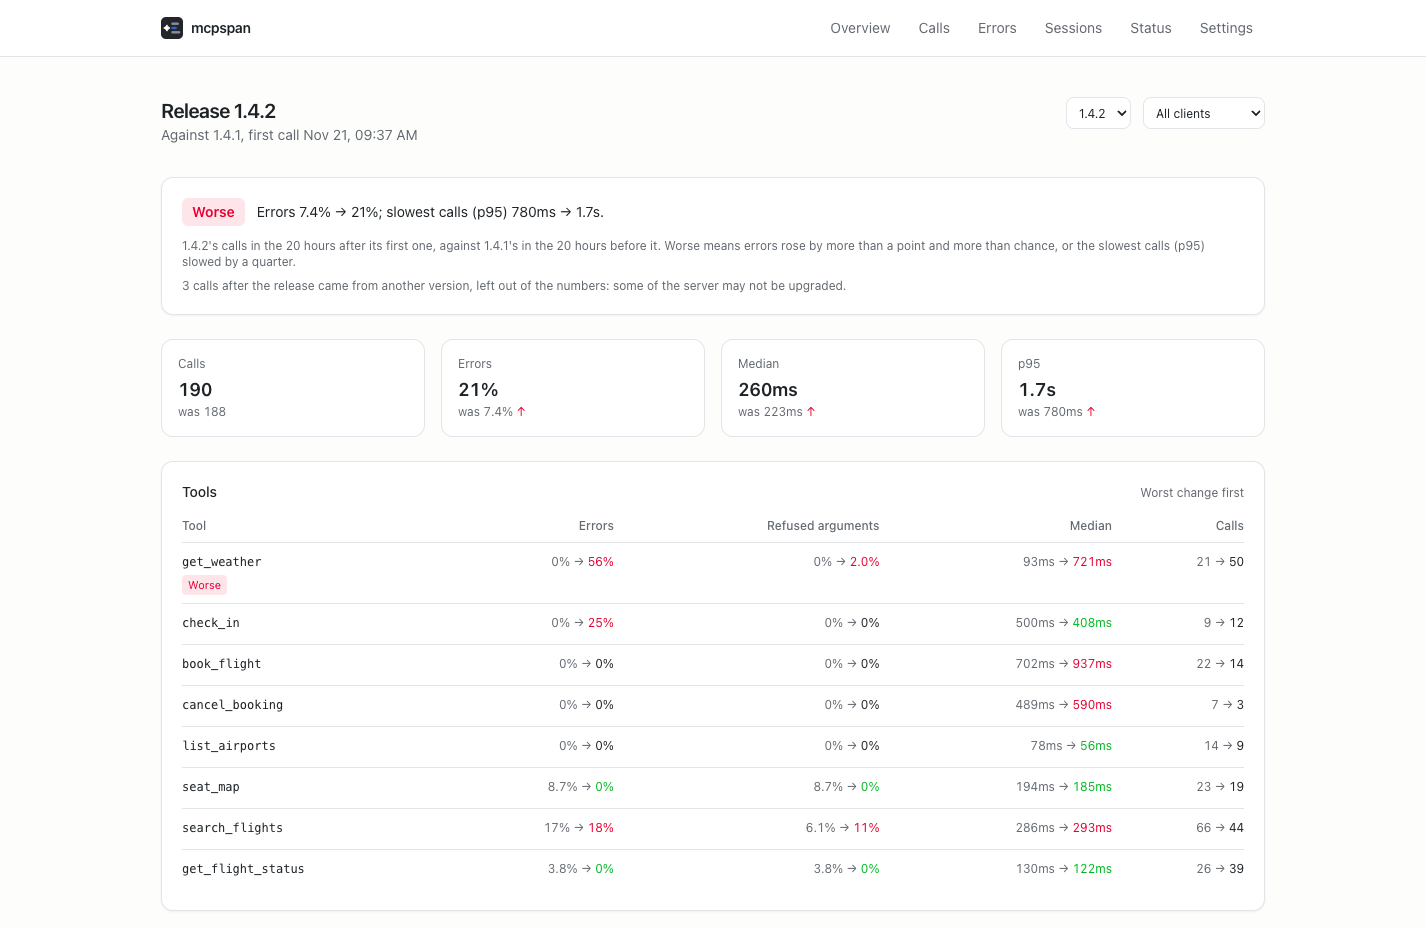
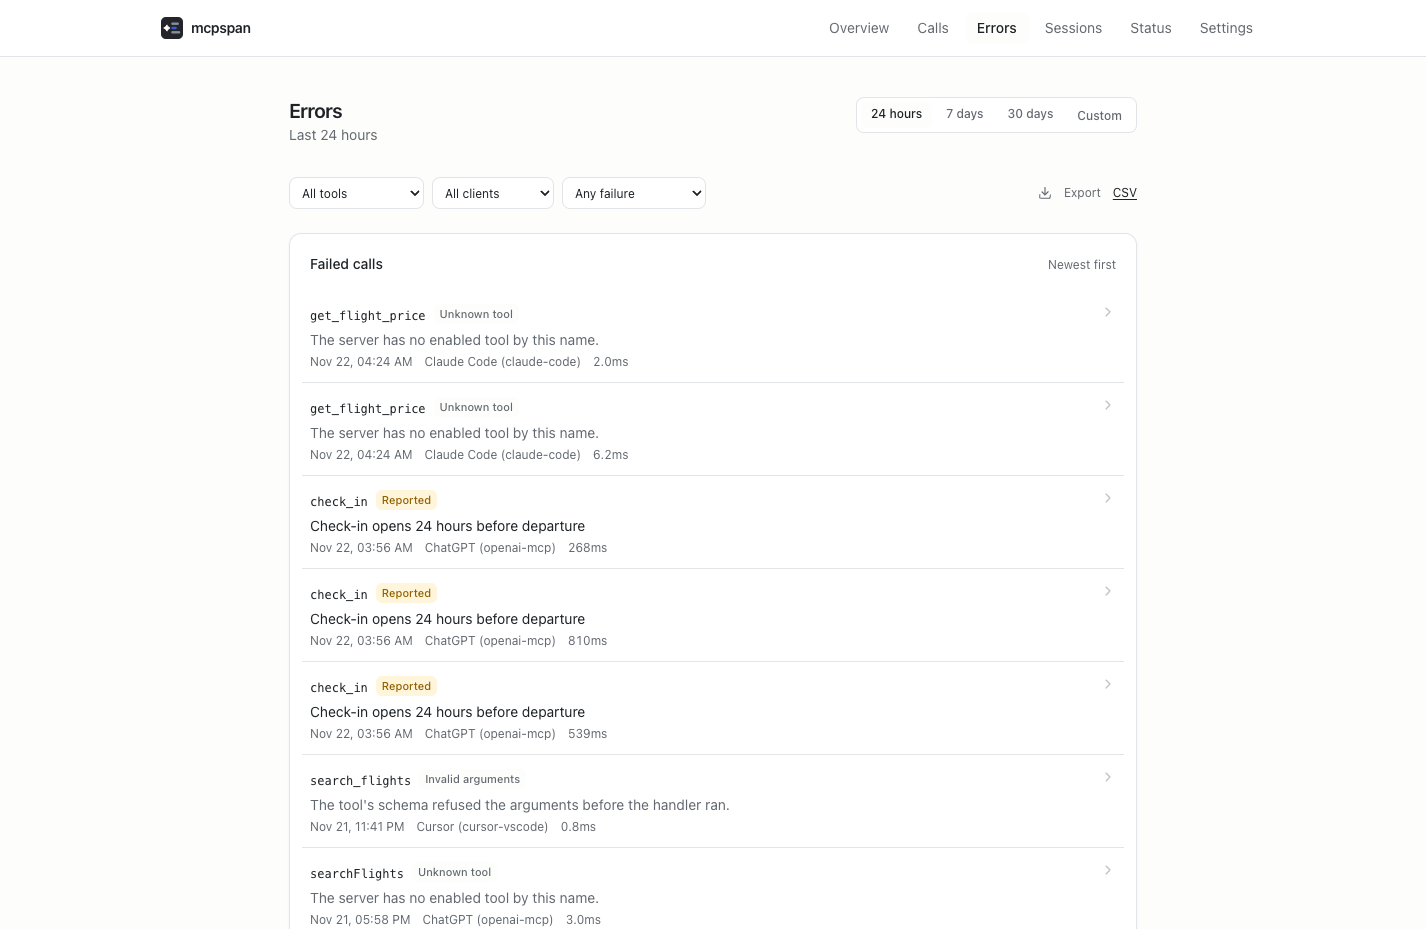
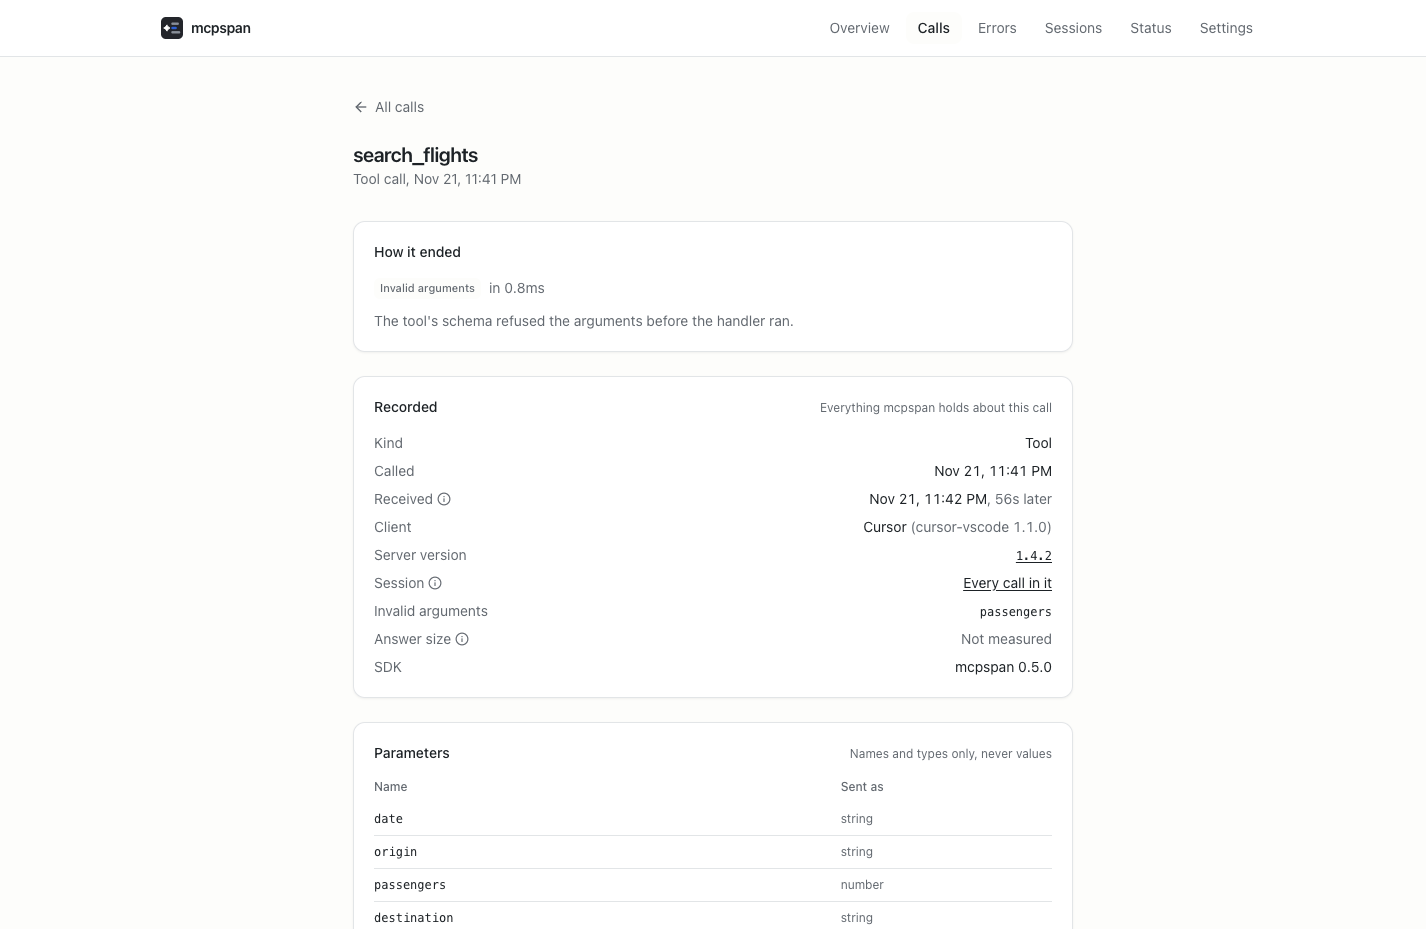
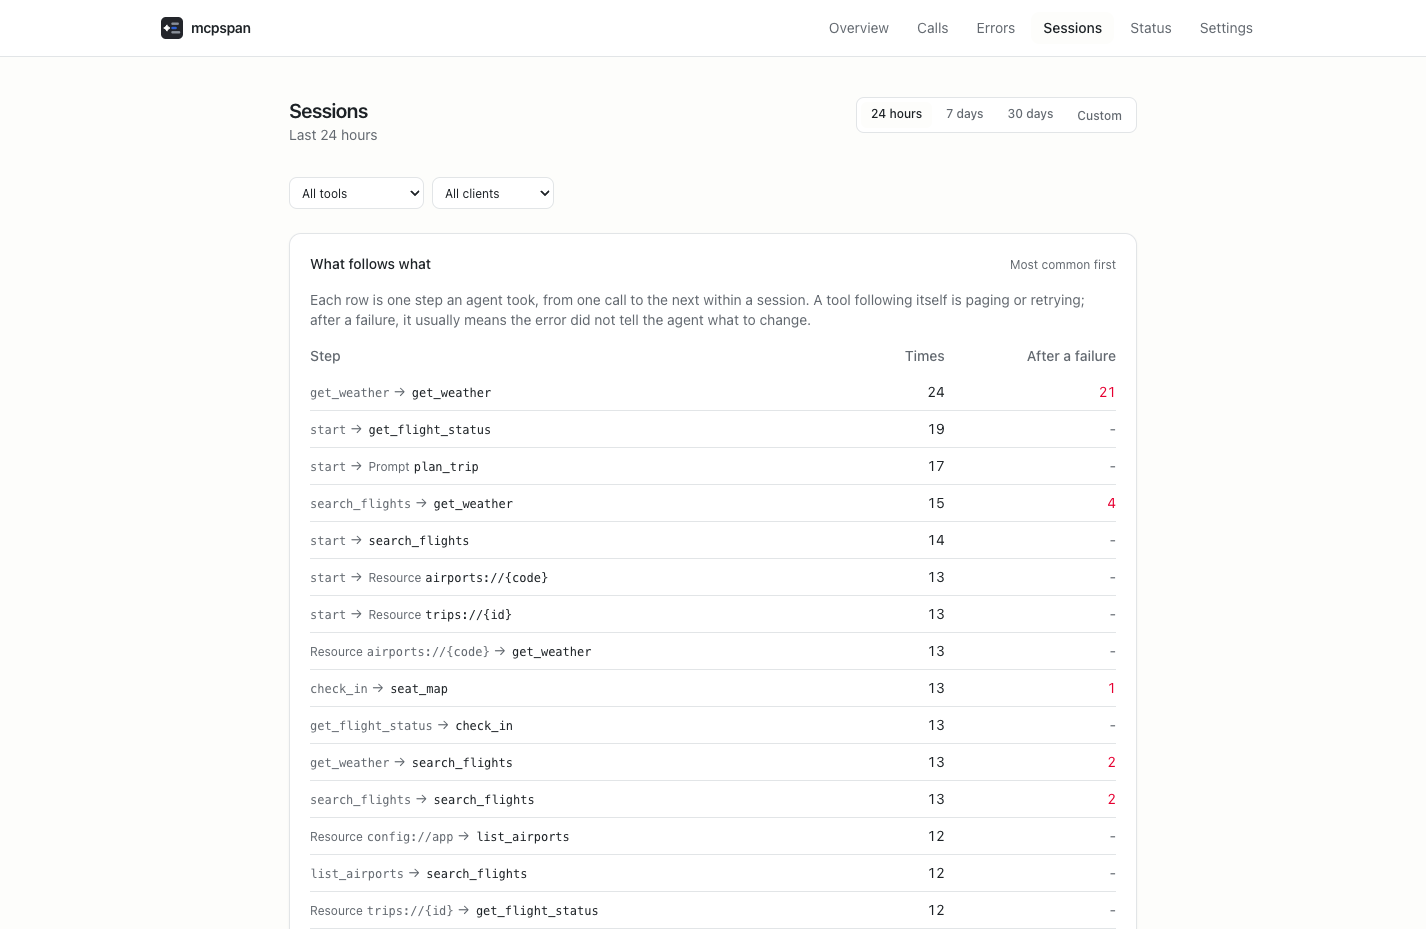
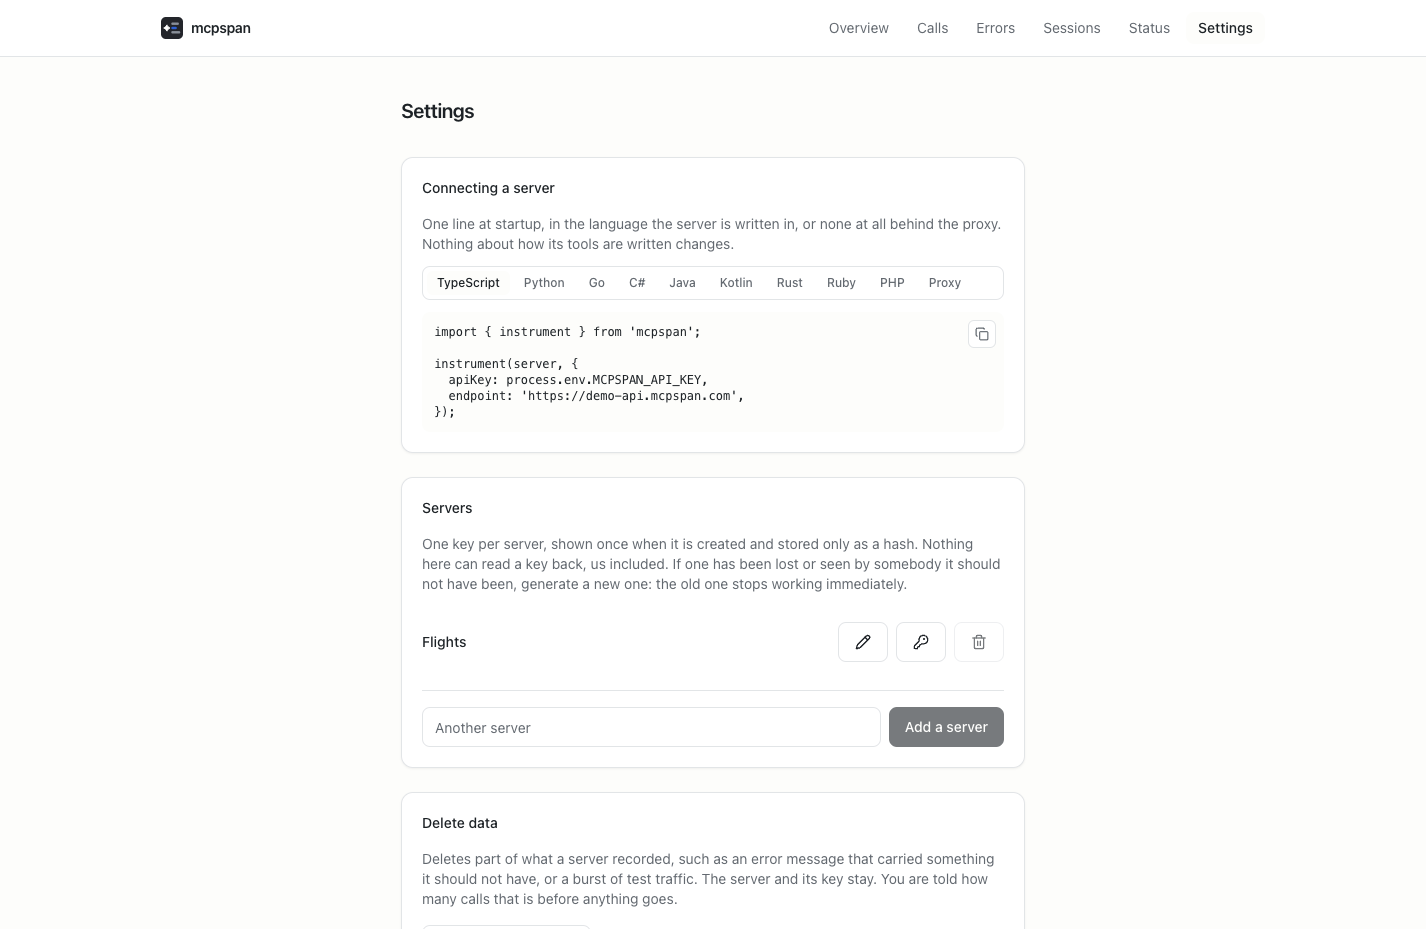
Every tool call, resource read, and prompt get an agent makes on your MCP server lands in mcpspan, with the client that asked, the response time, and the reason for any failure. One line added at startup sends them, with SDKs for eight languages or a proxy that wraps any server without touching its code. The overview charts calls, error rate, and median and 95th-percentile response time per tool, and failures are told apart as crashed handlers, reported errors, refused arguments, and tools an agent asked for that the server does not have. Sessions replay each connection step by step, mark repeated calls, and show what the agent did after every failure: retried, tried something else, or gave up. Release reports set each server version against the one before it, and client versions show whether a client's newest release gets its arguments refused more often. A tool-definition view shows what the tool list costs in tokens each session and which tools agents never call. Alerts go to Slack, Discord, or any webhook, and read tokens let an MCP client such as Claude Code answer questions about the numbers. Anything you can see exports as CSV or NDJSON, calls forward to OpenTelemetry, and README badges show usage. Running on a dedicated VPS on RepoCloud with guaranteed CPU, RAM, and SSD, full root SSH access, and a browser serial console. MIT licensed.
Benefits
- See why agents fail
- Failures are sorted into crashed handlers, reported errors, refused arguments, and unknown tools, with the wrong argument named, the closest real tool name, and what the agent tried next.
- Catch regressions after every release
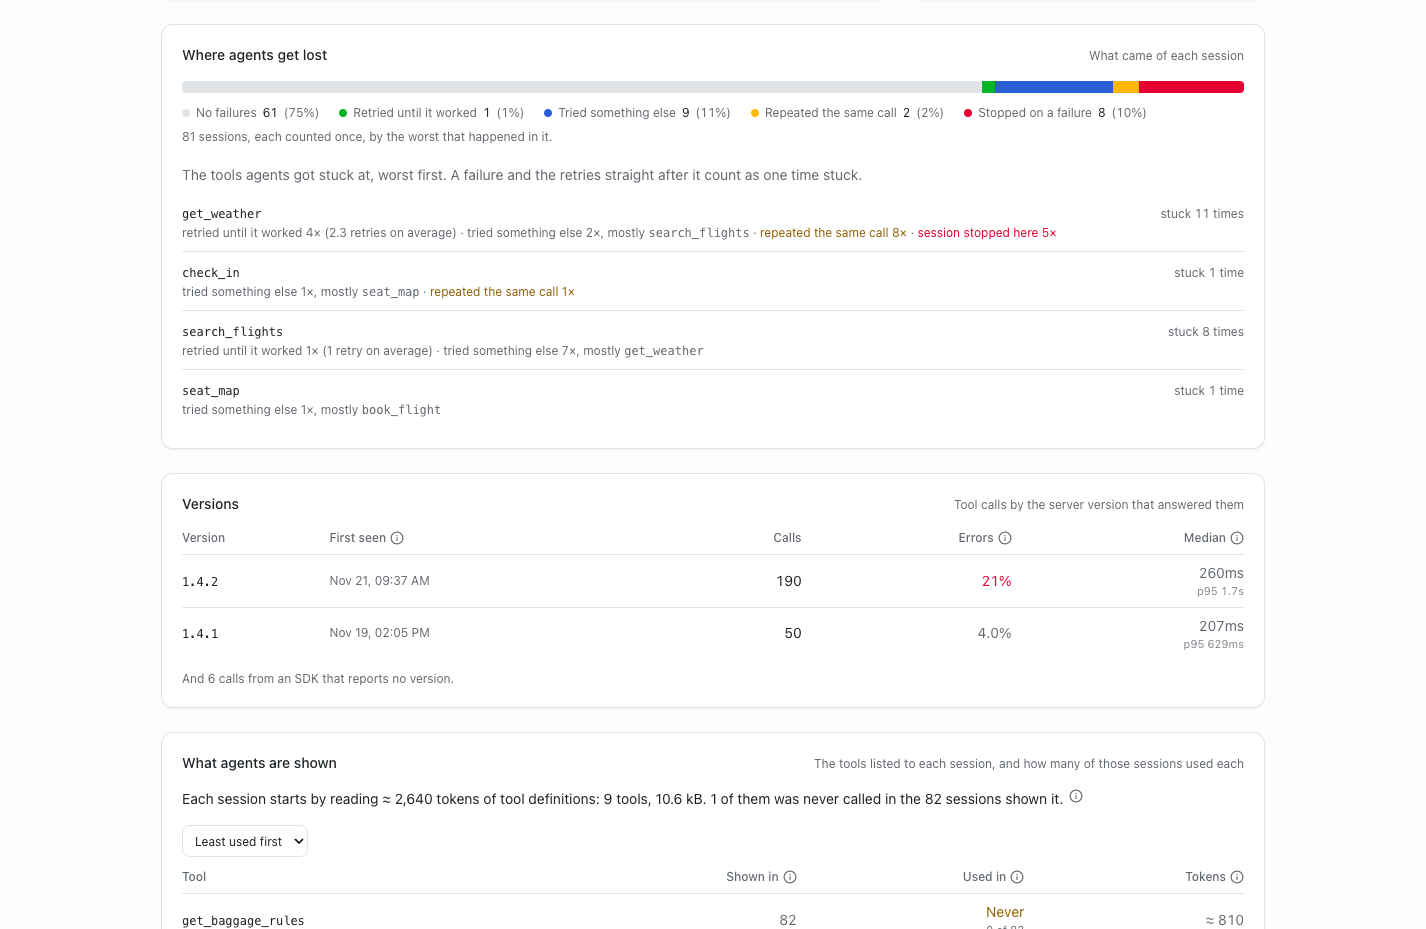
- Each call carries the server version that answered it, so a release report compares errors and response times against the previous version, tool by tool, and flags new kinds of failure.
- Your data stays on your server
- Parameter values never leave the server process, only names and types are recorded, and nothing is sent anywhere you did not set up; raw calls are dropped after 90 days by default.
- Ask your agent about its tools
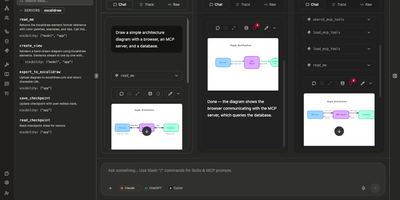
- The API is an MCP server itself, so Claude Code, Cursor, or ChatGPT can answer which tools failed this week, or how a release compares, using read-only access.
Features
- SDKs and no-code proxy
- One-line setup for TypeScript, Python, Go, C#, Java, Kotlin, Rust, Ruby, and PHP servers, plus mcpspan-proxy for stdio or HTTP servers whose code cannot be changed.
- Calls, errors, and latency
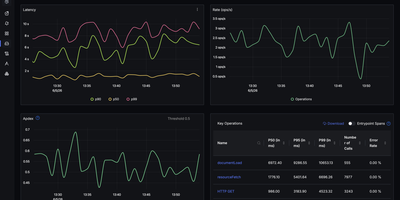
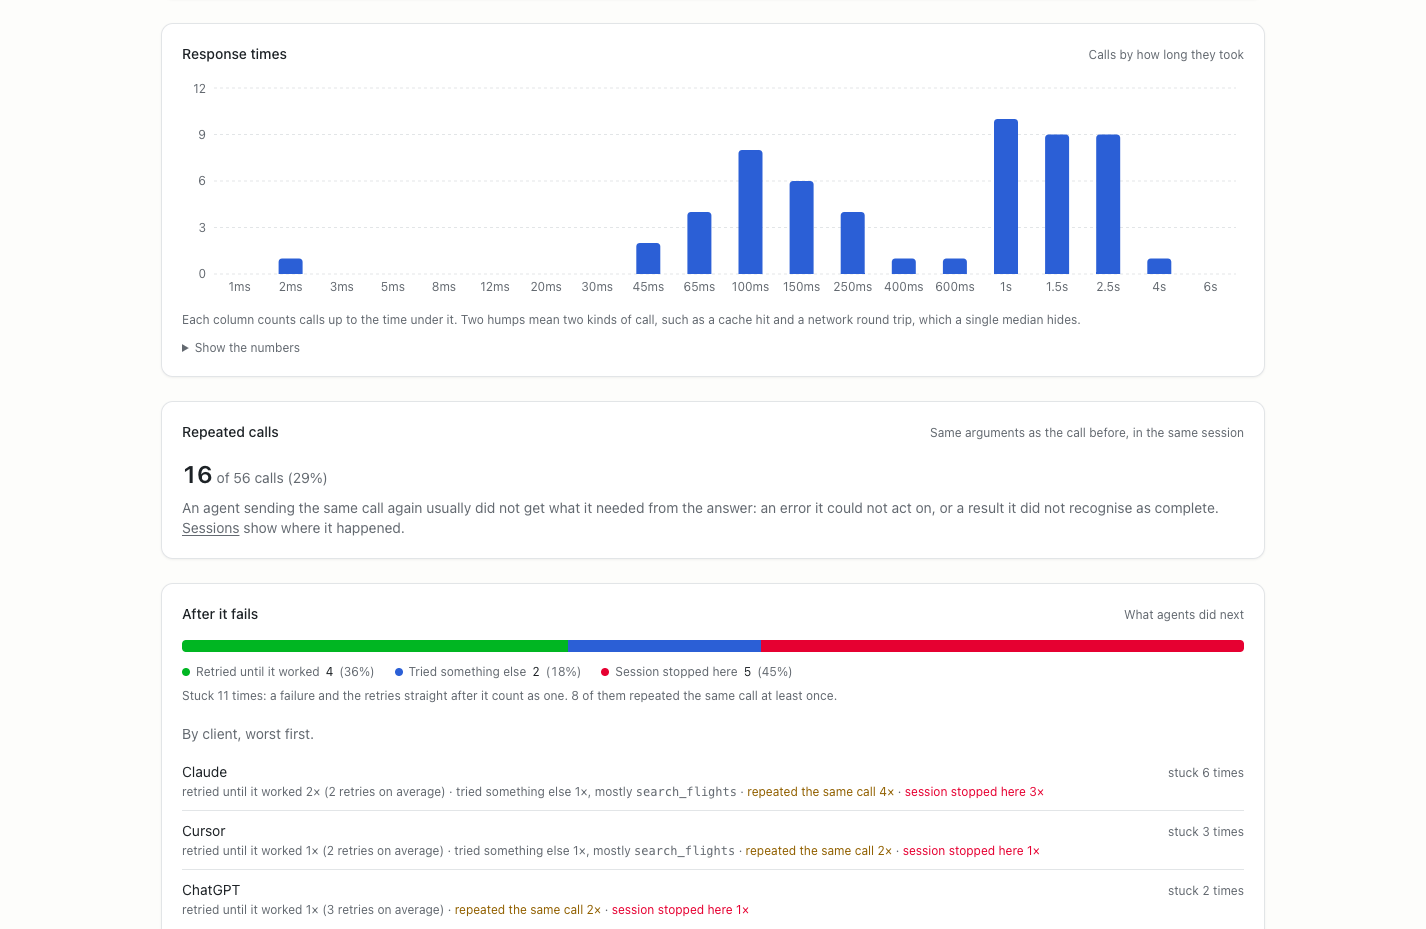
- Overview cards and charts show calls, error rate, median and 95th-percentile response time, response-time histograms, answer sizes, and which clients called, filterable by tool and client.
- Sessions and loop detection
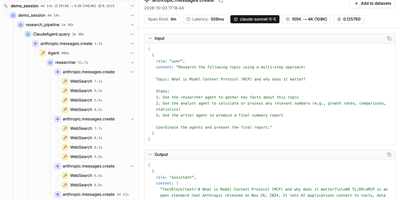
- Sessions list each connection's calls in order, mark repeated calls with the same arguments, and show what agents did after a failure: retried, tried something else, or stopped.
- Client version tracking
- Each client lists its versions, showing which is new and whether the newest build gets its arguments refused more often, compared only on server releases both called.
- What agents are shown
- Shows how many tokens your tool definitions cost at the start of every session and which tools were offered in hundreds of sessions but never called.
- Alerts, exports, and OpenTelemetry
- Alerts post to Slack, Discord, or any webhook when errors climb; calls export as CSV or NDJSON and forward as OpenTelemetry spans to Grafana, Datadog, or Honeycomb.