Categories
Self-Hosted Observability Log Management OpenTelemetry Distributed Tracing Application Monitoring Metrics Monitoring Anomaly DetectionStars
Forks
Watchers
Developer links
Monoscope
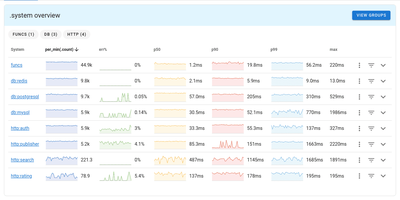
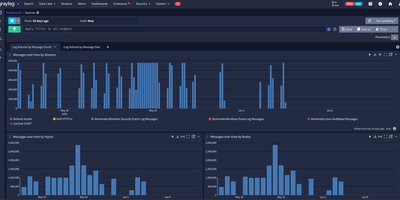
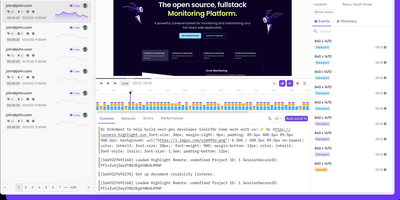
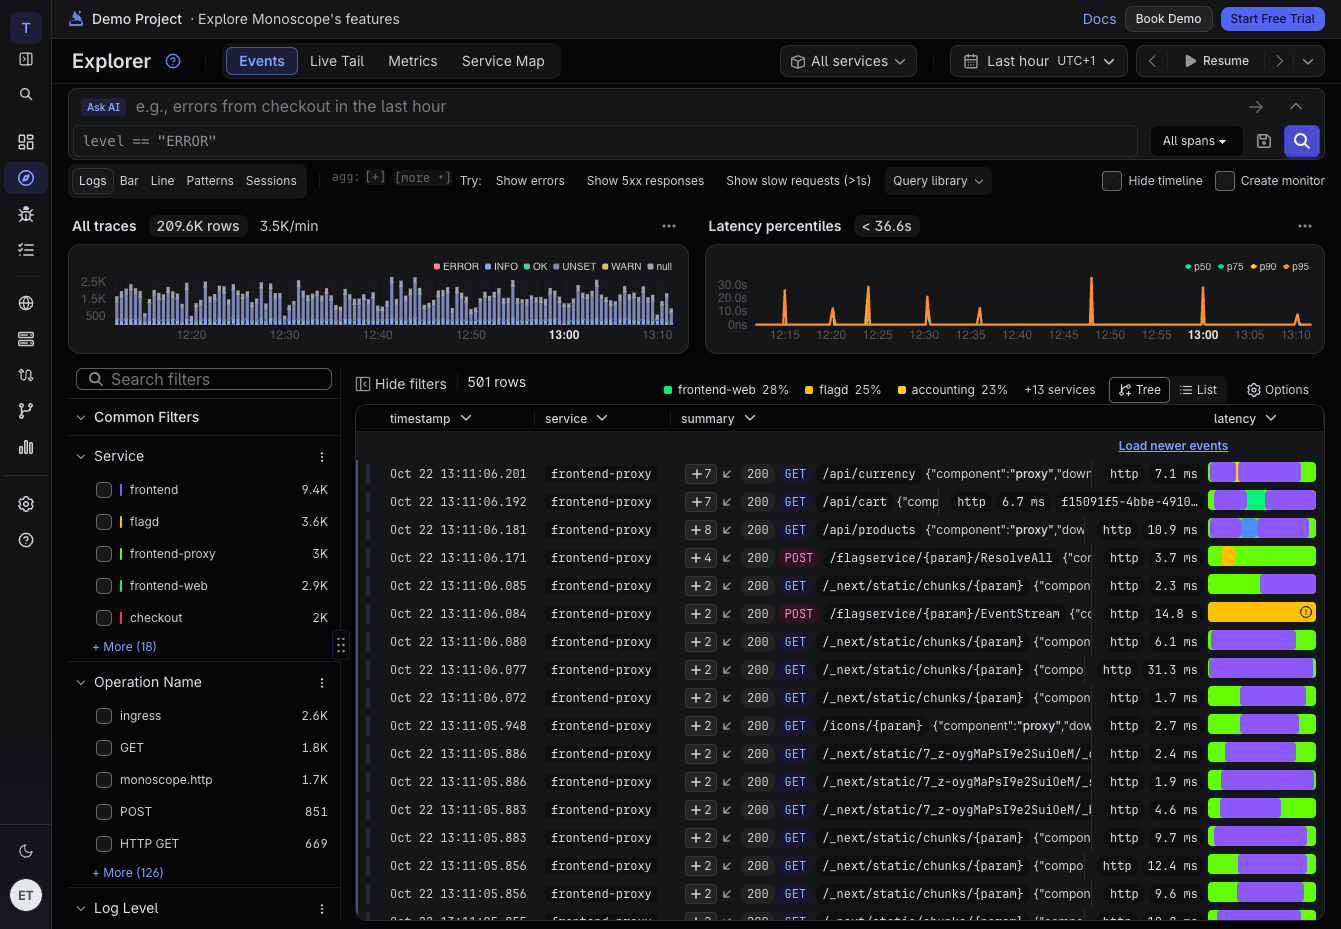
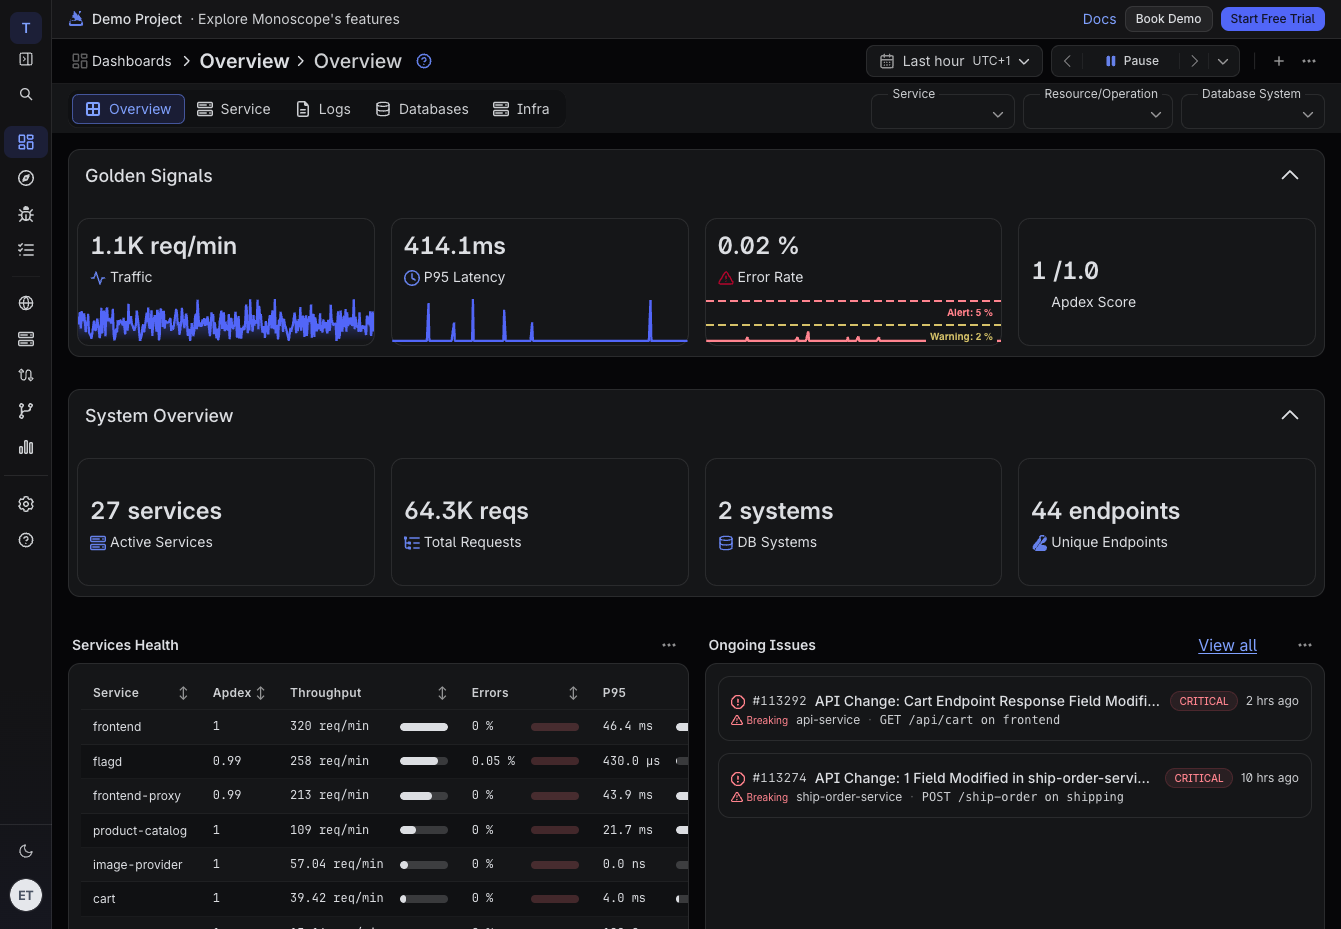
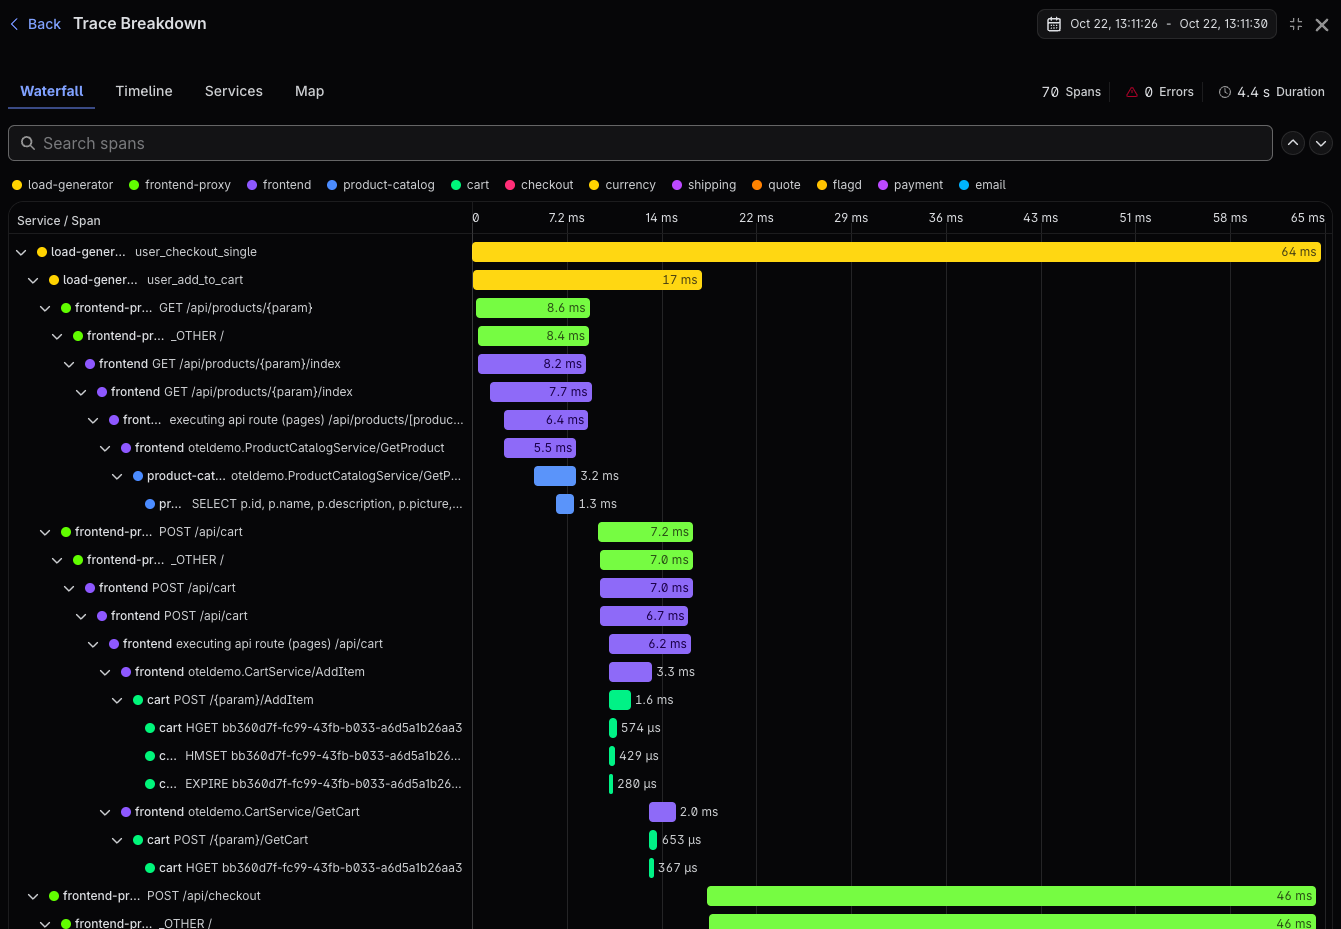
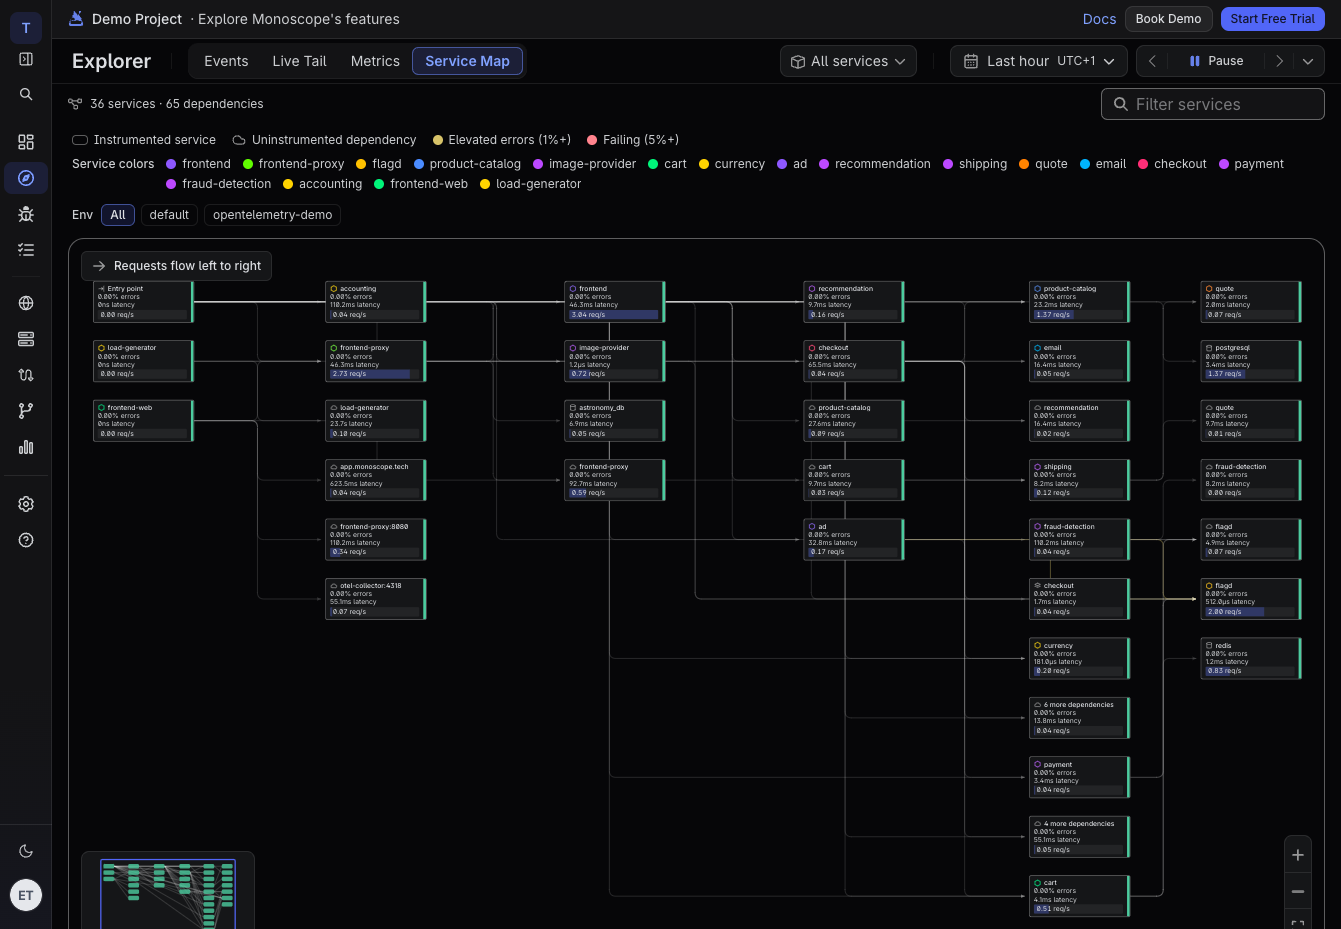
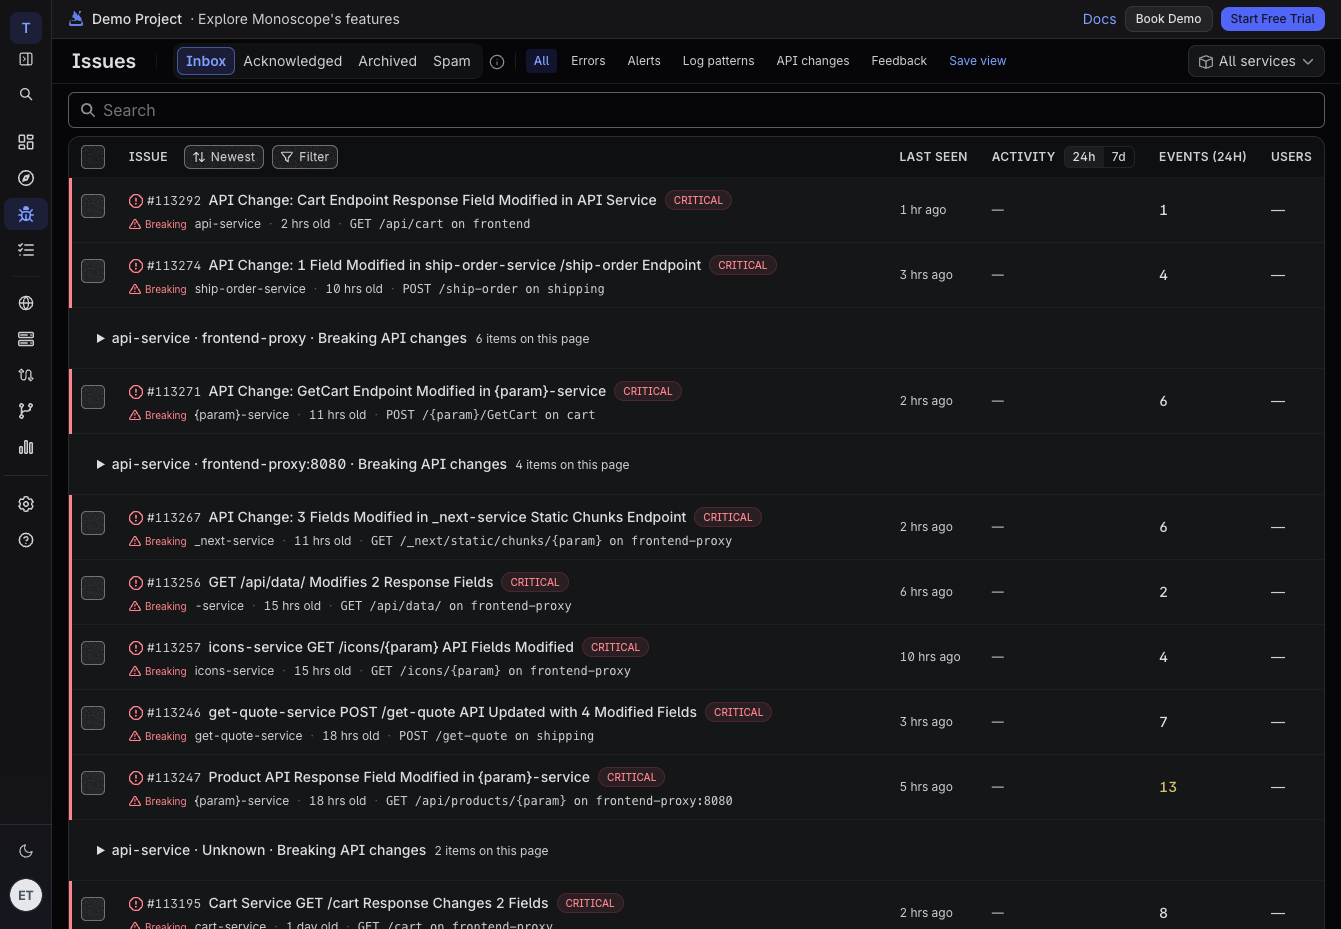
Across logs, traces, and metrics, Monoscope gives engineering teams one self-hosted workspace for finding what broke, asking questions in plain English, and hearing about problems before users do. Start in the Explorer: search events with KQL or an Ask AI prompt, flip between log rows, bar and line charts, log patterns, and sessions, and narrow results with facets for service, level, and HTTP status. Open any span to read its attributes, then follow the full trace across services in a waterfall, timeline, or map view. Live Tail streams new events as they arrive, and the Service Map draws every dependency with its error rate, latency, and requests per second. Build dashboards from widgets with copyable KQL and SQL, then set scheduled monitors with warn and alert thresholds, cron monitors, and uptime checks. An Issues inbox gathers API changes, errors, and log patterns so each one can be acknowledged, archived, or marked as spam, while Reports send scheduled summaries by email. Telemetry arrives over OTLP gRPC on port 4317 from OpenTelemetry SDKs and collectors. The monoscope CLI emits JSON for scripts, and an MCP server at /api/v1/mcp lets Claude, Cursor, and Cline search events and triage issues. Natural-language search uses the OpenAI-compatible model you configure. Running on a dedicated VPS on RepoCloud with guaranteed CPU, RAM, and SSD, full root SSH access, and a browser serial console. AGPL-3.0 licensed.
Benefits
- One workspace for every signal
- Logs, traces, and metrics share one explorer, one KQL query language, and one global service filter, so an investigation can move from a latency spike to the exact span without changing tools.
- Ask questions in plain English
- Type something like errors from checkout in the last hour and Ask AI generates a KQL query you can read, edit, save to the query library, or turn into a monitor.
- Issues triaged in one inbox
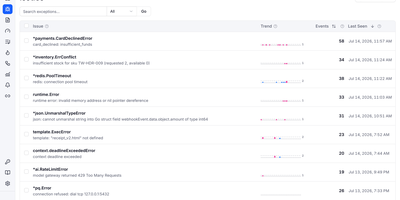
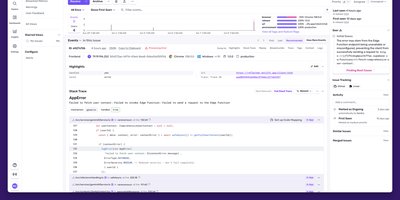
- Breaking API changes, errors, alerts, and log patterns collect in an Issues inbox where each item can be acknowledged, paused for a set time, archived, or marked as spam.
- Built for scripts and AI agents
- The monoscope CLI switches to JSON output in agent mode, an MCP server at /api/v1/mcp exposes searches and issue triage to Claude, Cursor, and Cline, and a Claude Code skills plugin adds on-call workflows.
Features
- Event explorer and Live Tail
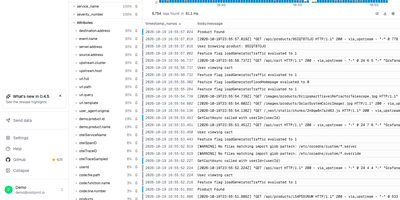
- Search logs and spans with KQL or Ask AI, switch between rows, bar and line charts, patterns, and sessions, filter by facets, and stream new events with Live Tail.
- Trace waterfall
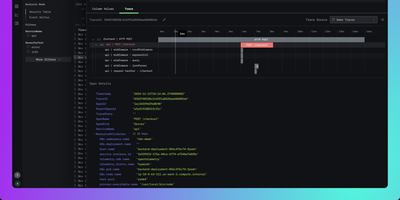
- Open any span for attributes, process, logs, metrics, and raw data, then follow the whole trace across services in waterfall, timeline, services, and map views with span counts and durations.
- Service Map
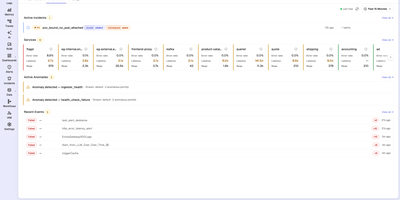
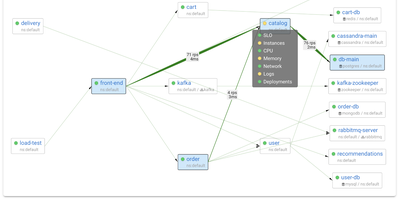
- A left-to-right dependency graph of instrumented services and uninstrumented dependencies, with per-node error rate, latency, and requests per second, an environment filter, and a minimap.
- Dashboards and monitors
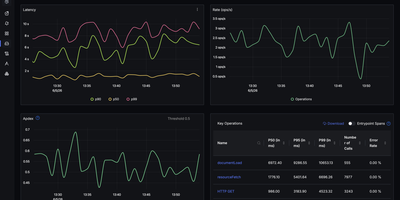
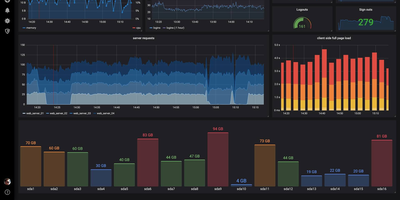
- Widget dashboards with tabs, copyable KQL and SQL, YAML editing, and PNG export, plus scheduled monitors with warn and alert thresholds, cron monitors, and uptime checks.
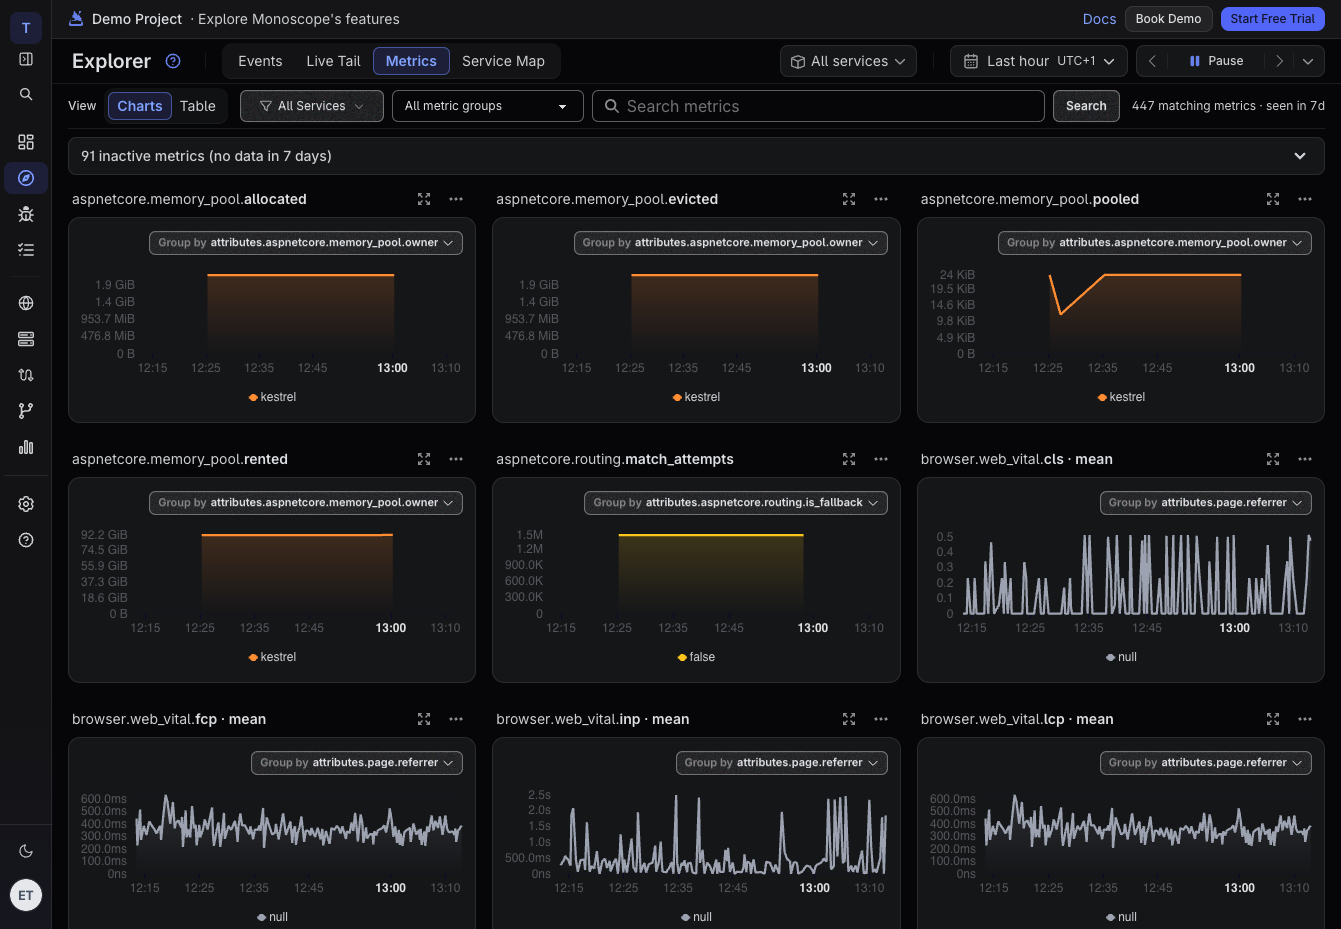
- Metrics and scheduled reports
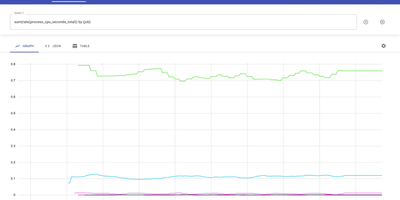
- Browse metrics as a chart grid or table with group-by selectors and search, and receive scheduled analytics reports by email, with daily or weekly summaries of important events.
- OpenTelemetry ingestion
- Receives OTLP over gRPC on port 4317 from OpenTelemetry SDKs and collectors, with a Docker Compose stack that bundles the Monoscope server and a TimescaleDB database.