Categories
Self-Hosted DevOps Observability AI Infrastructure Uptime Monitoring LLM Monitoring API Monitoring Status DashboardStars
Forks
Watchers
Developer links
Relay Pulse
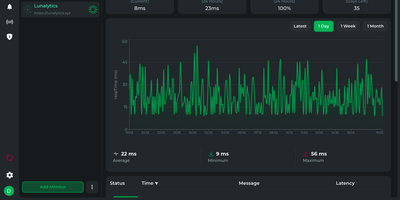
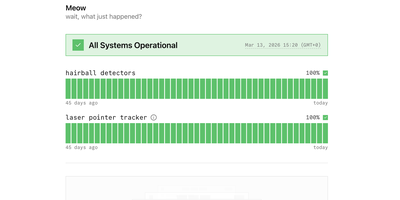
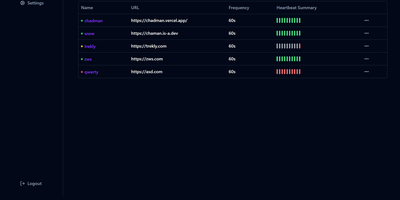
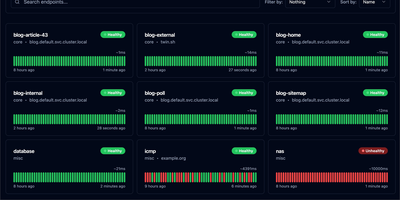
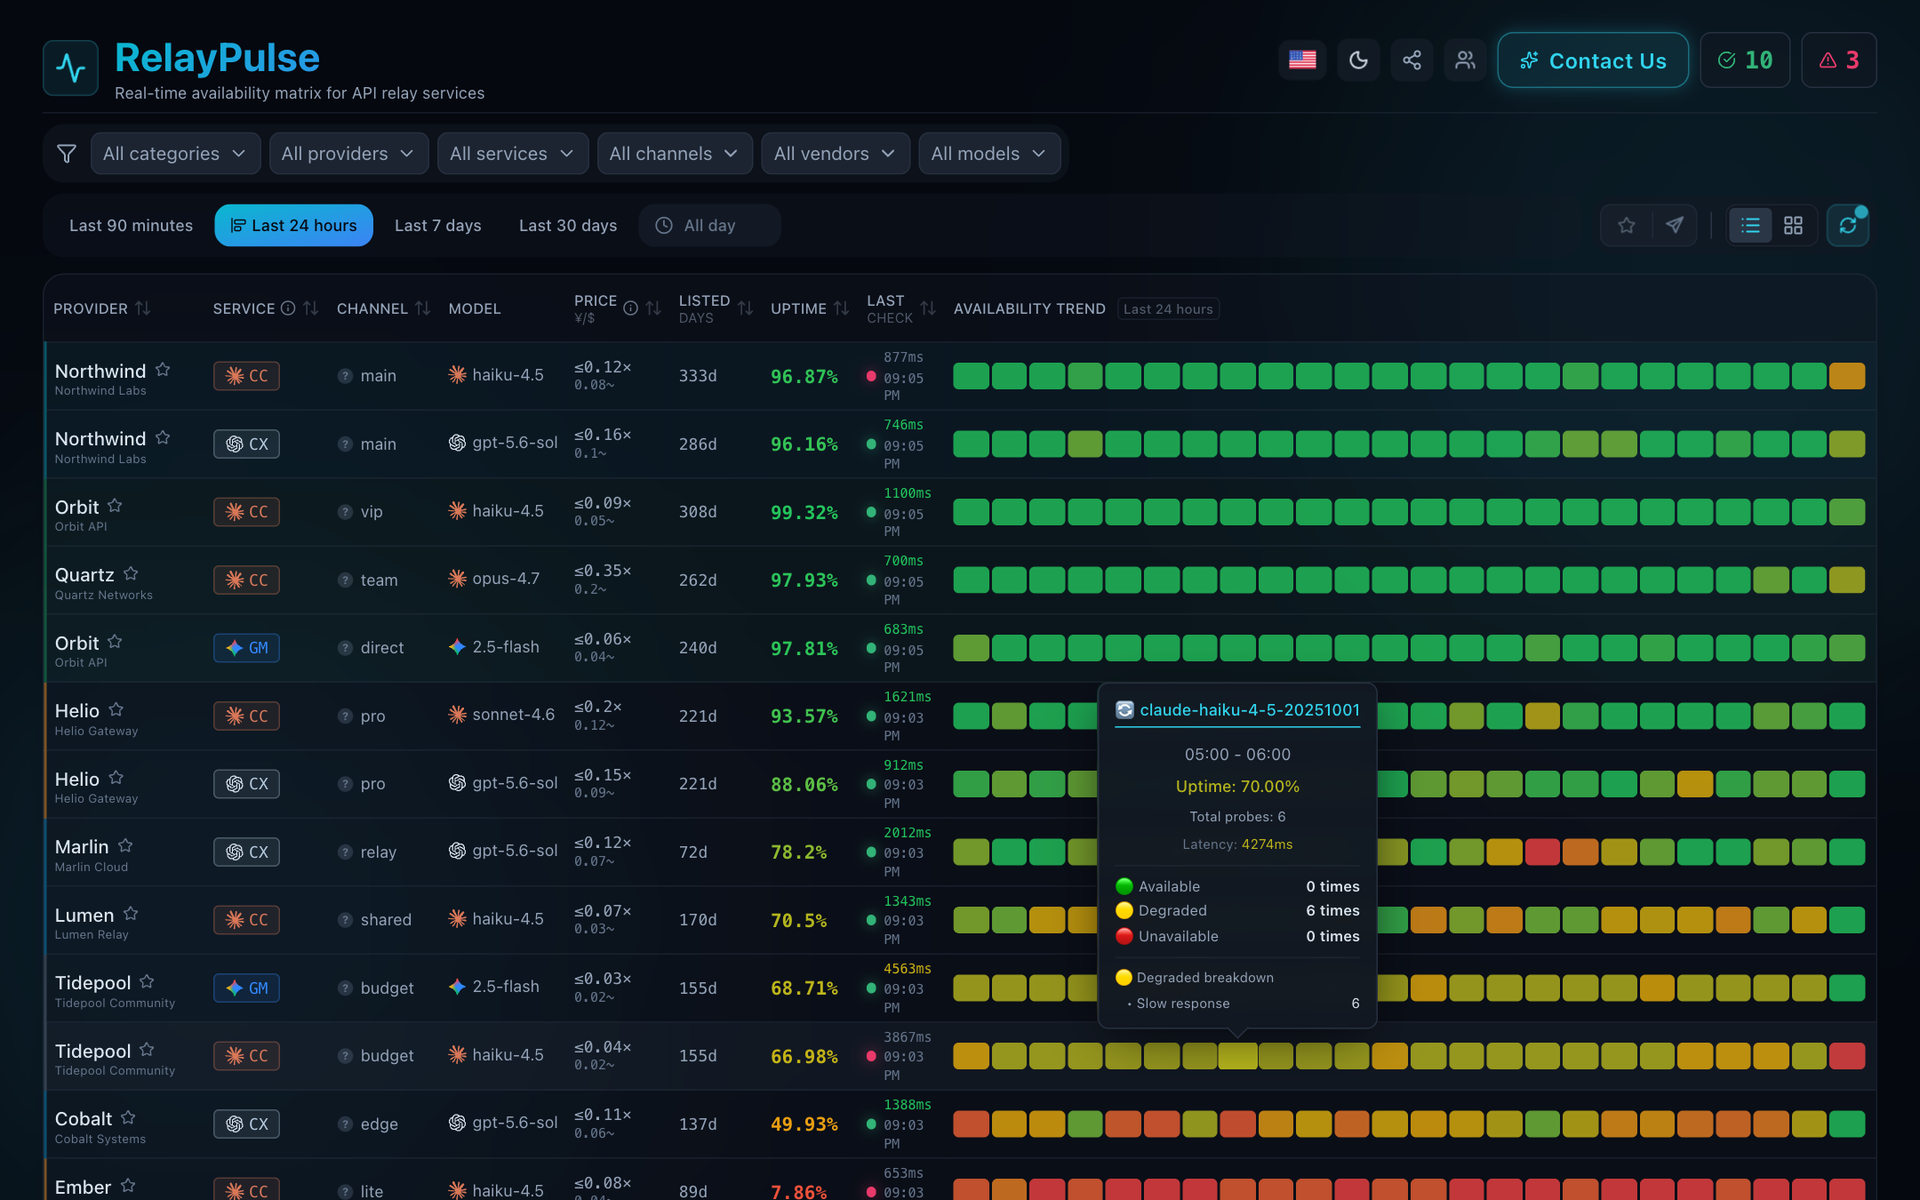
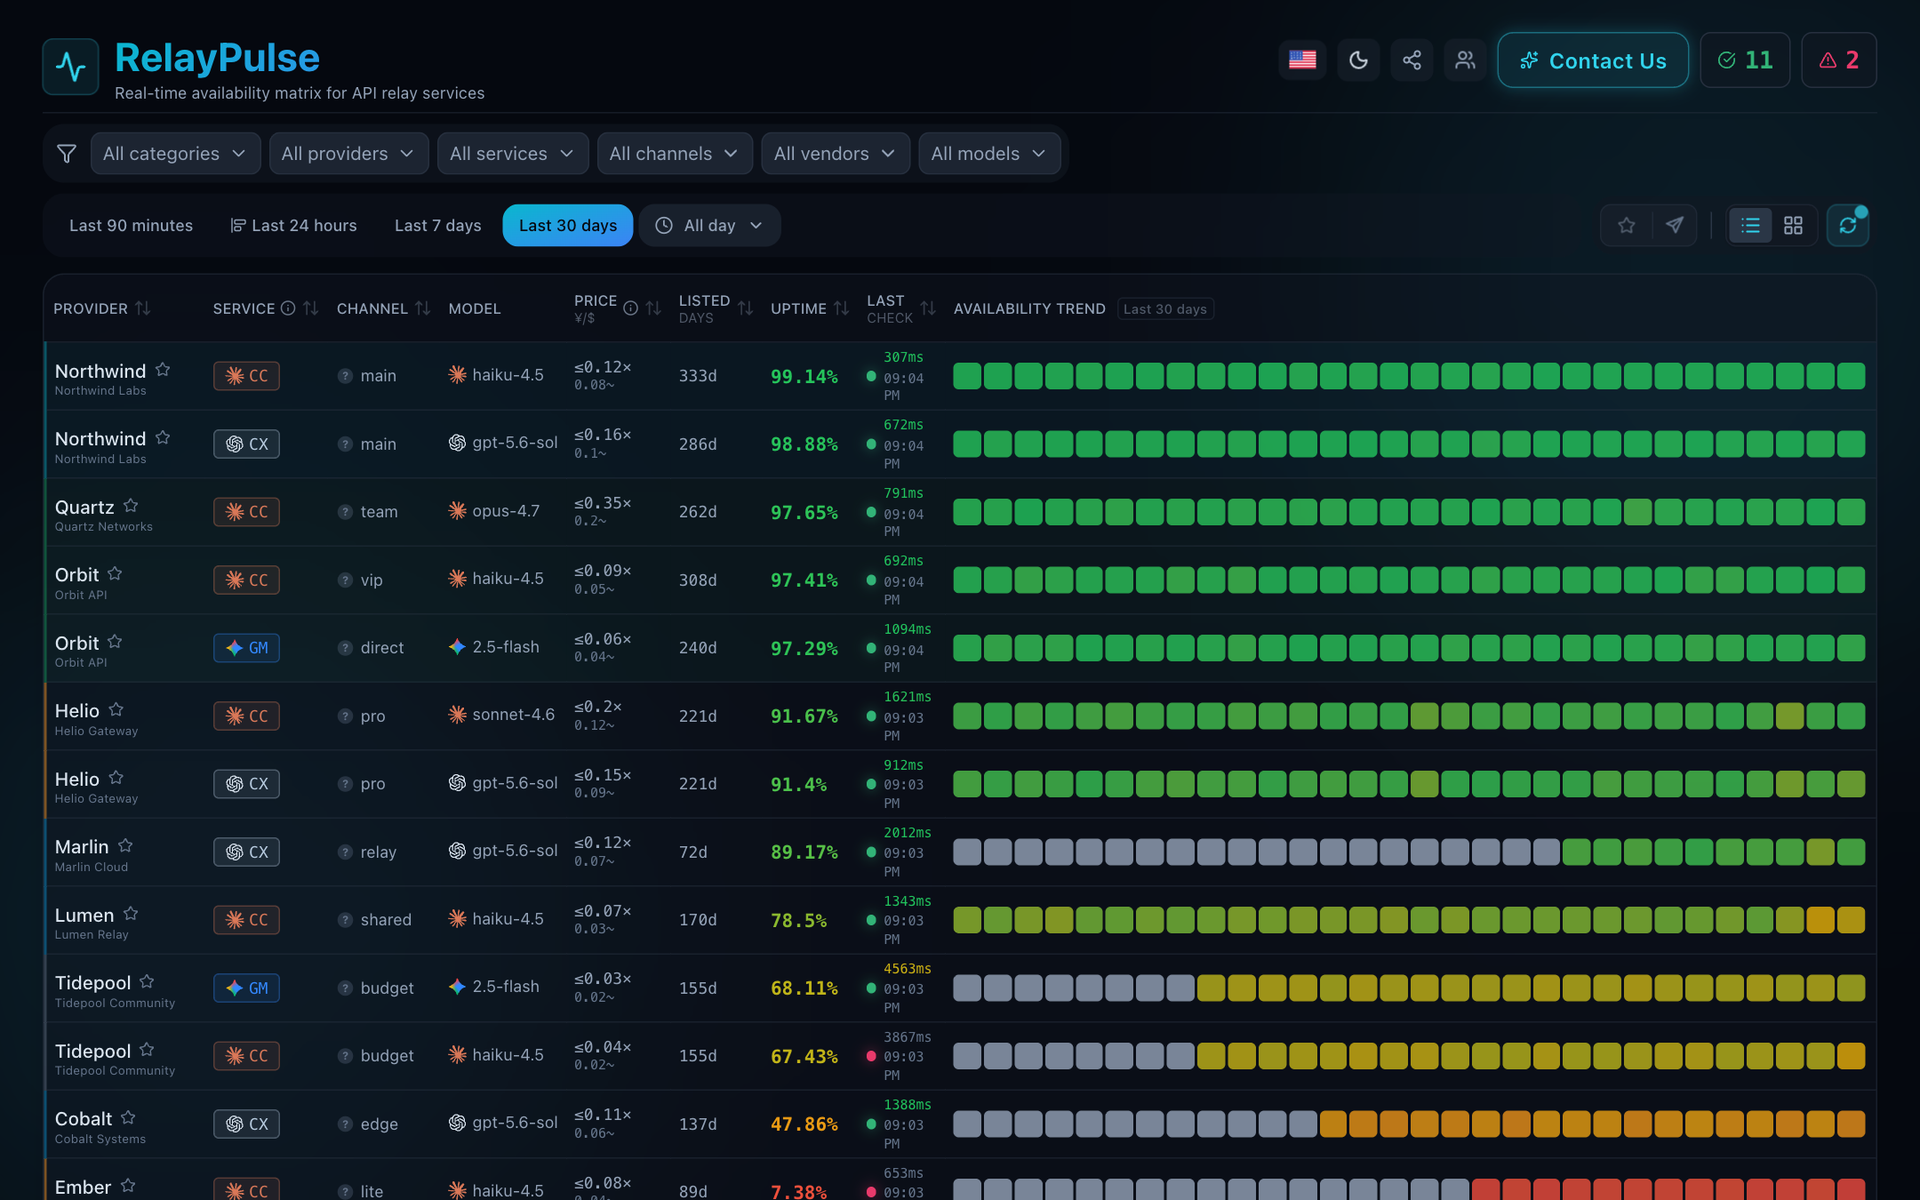
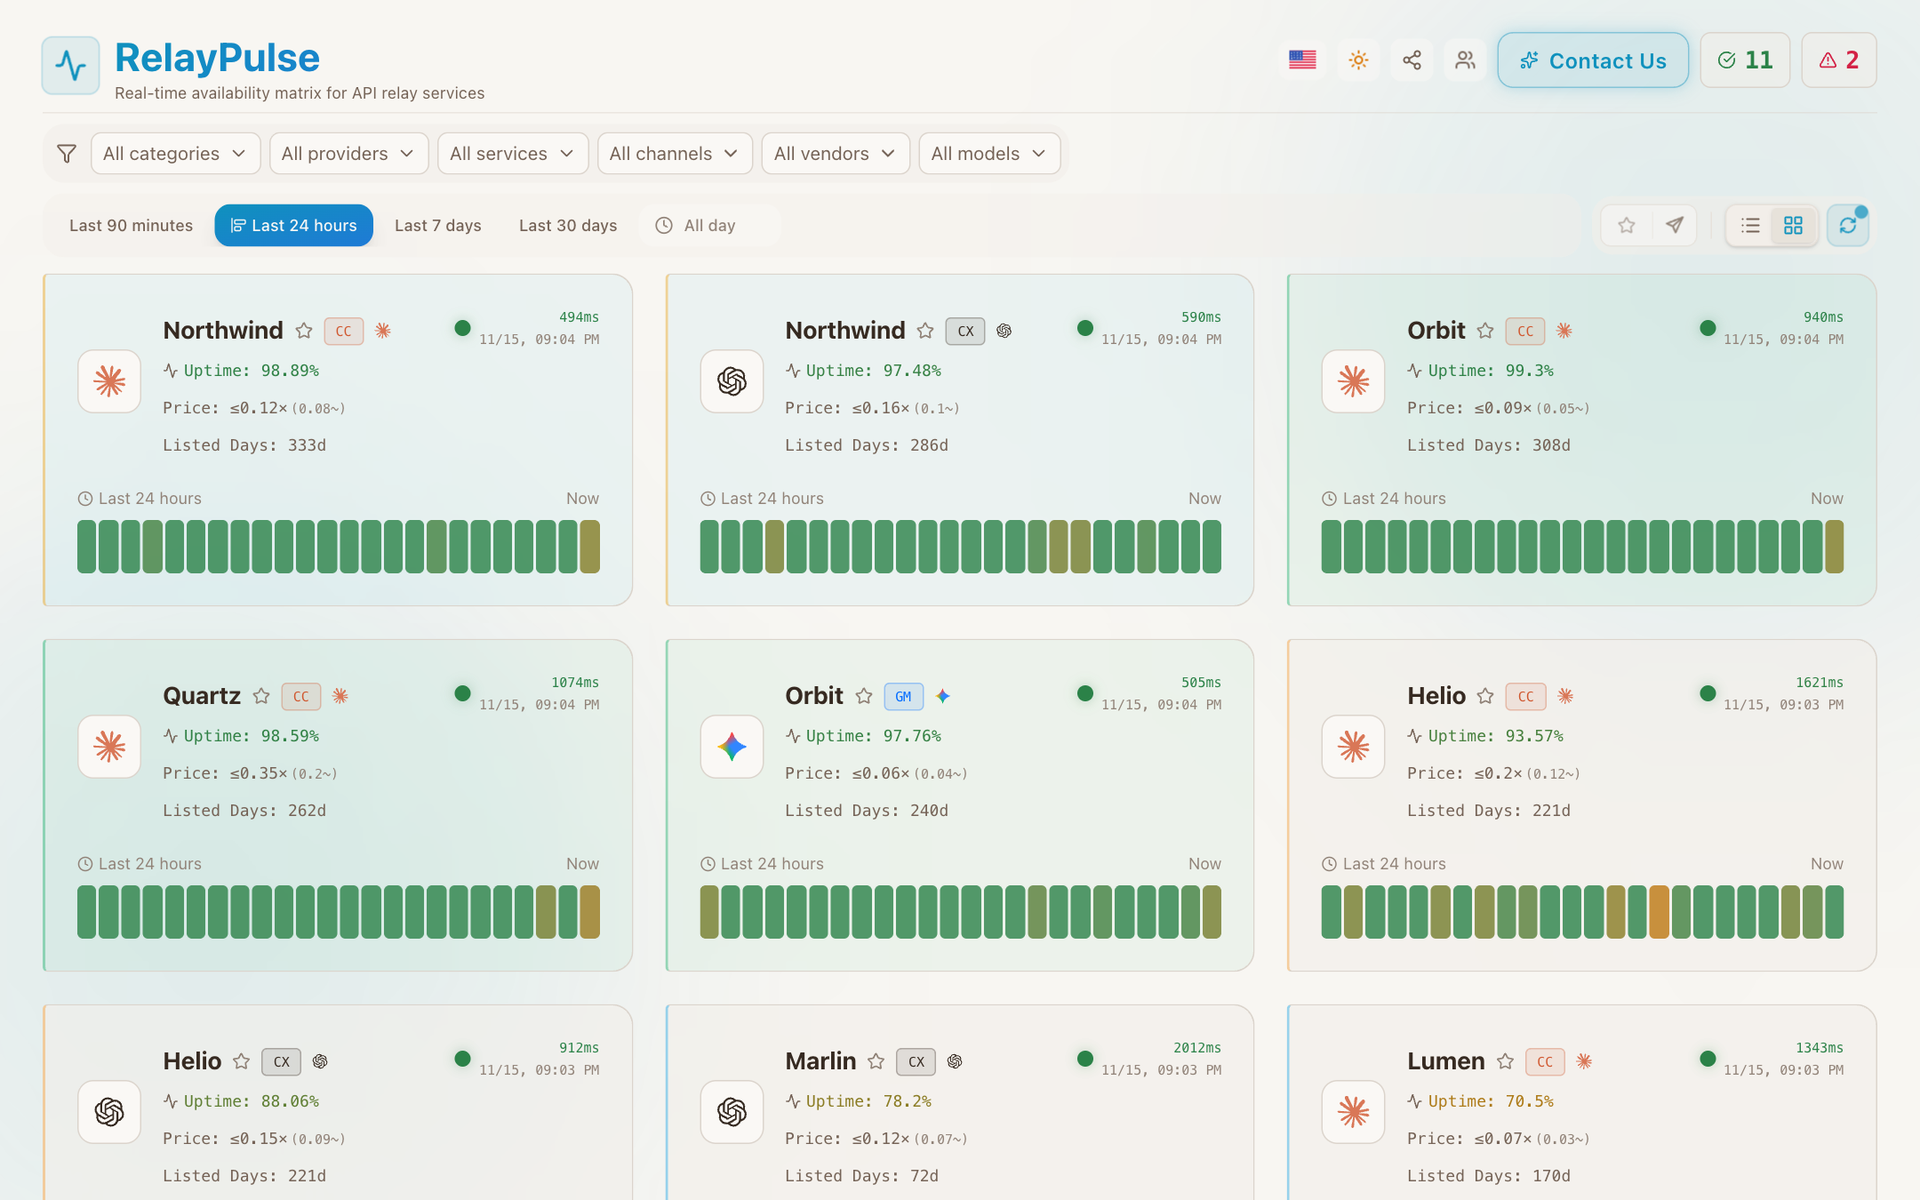
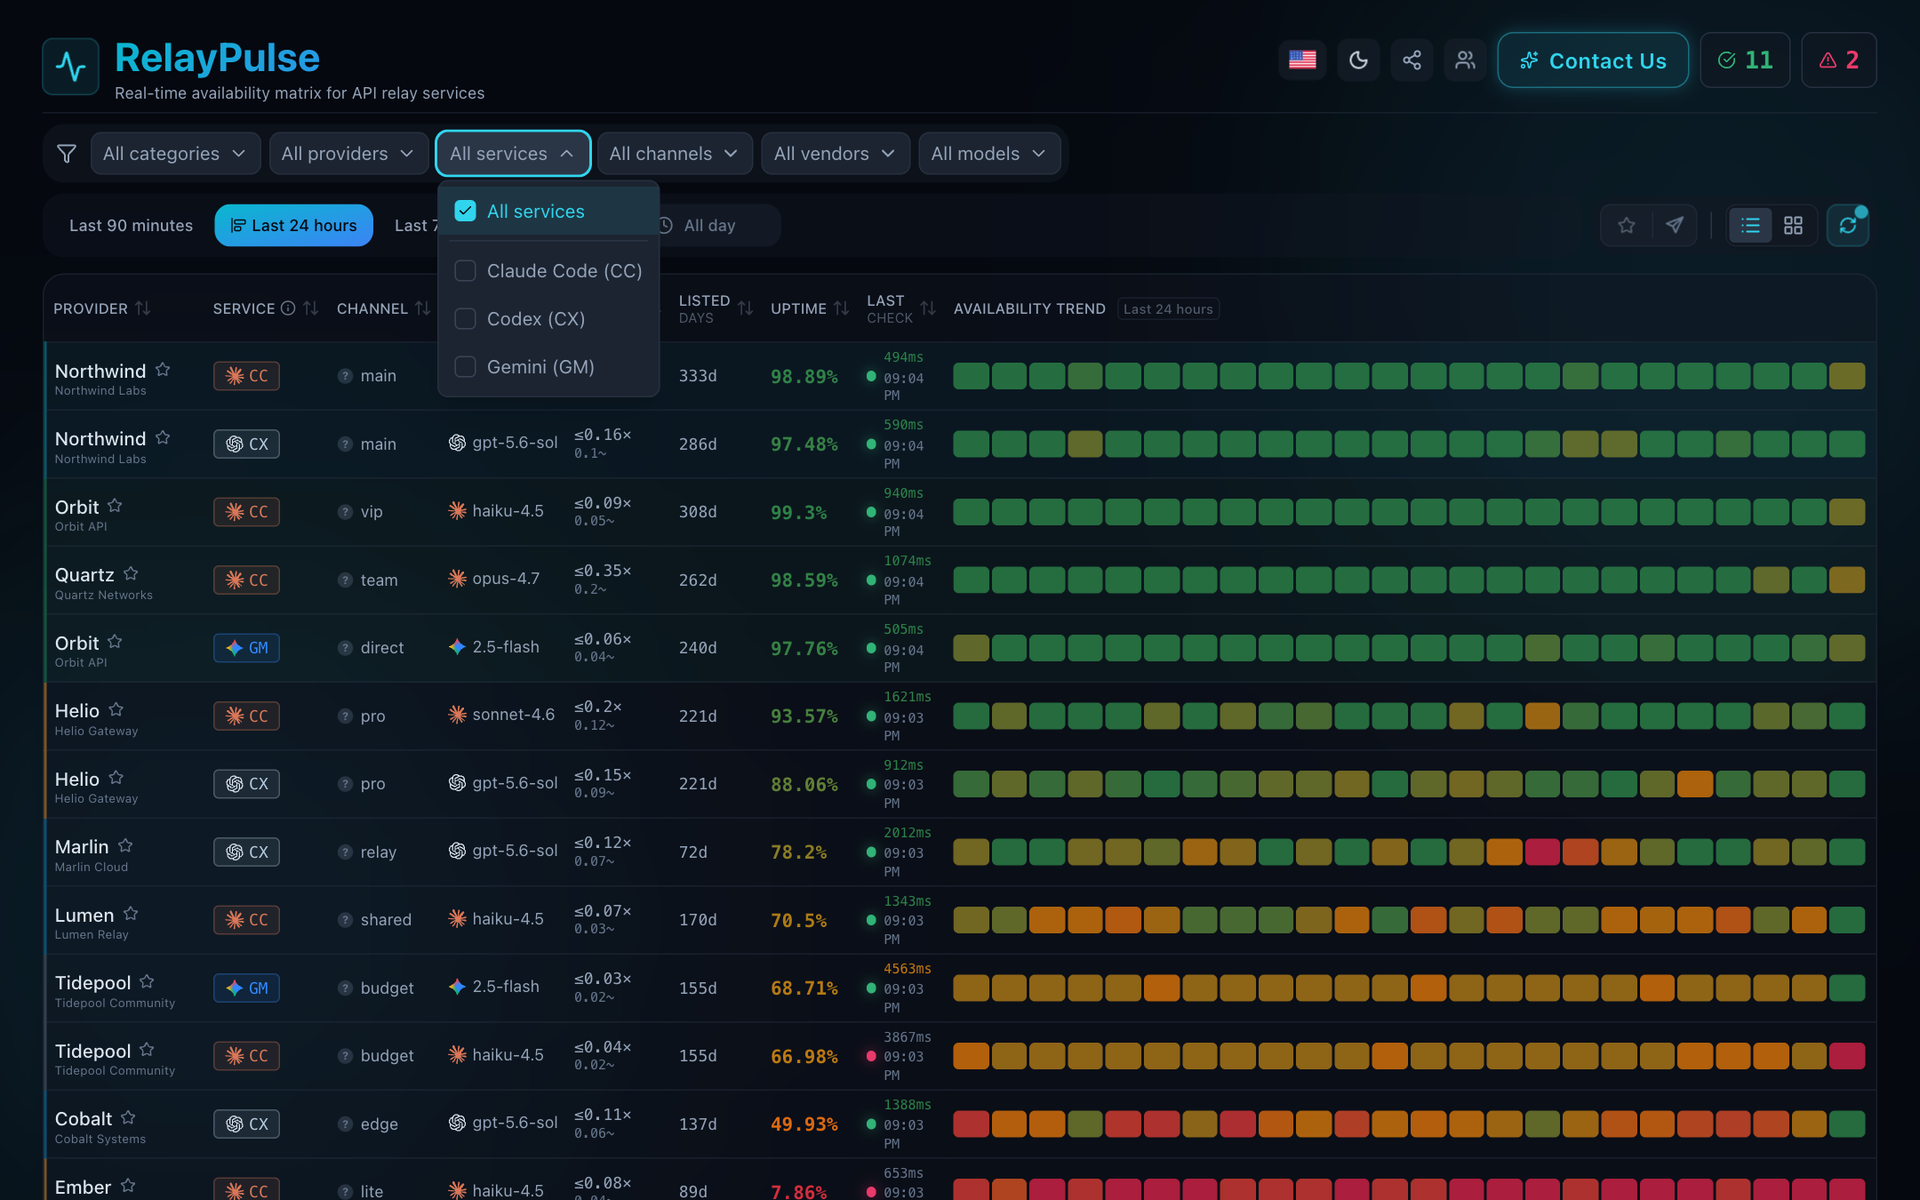
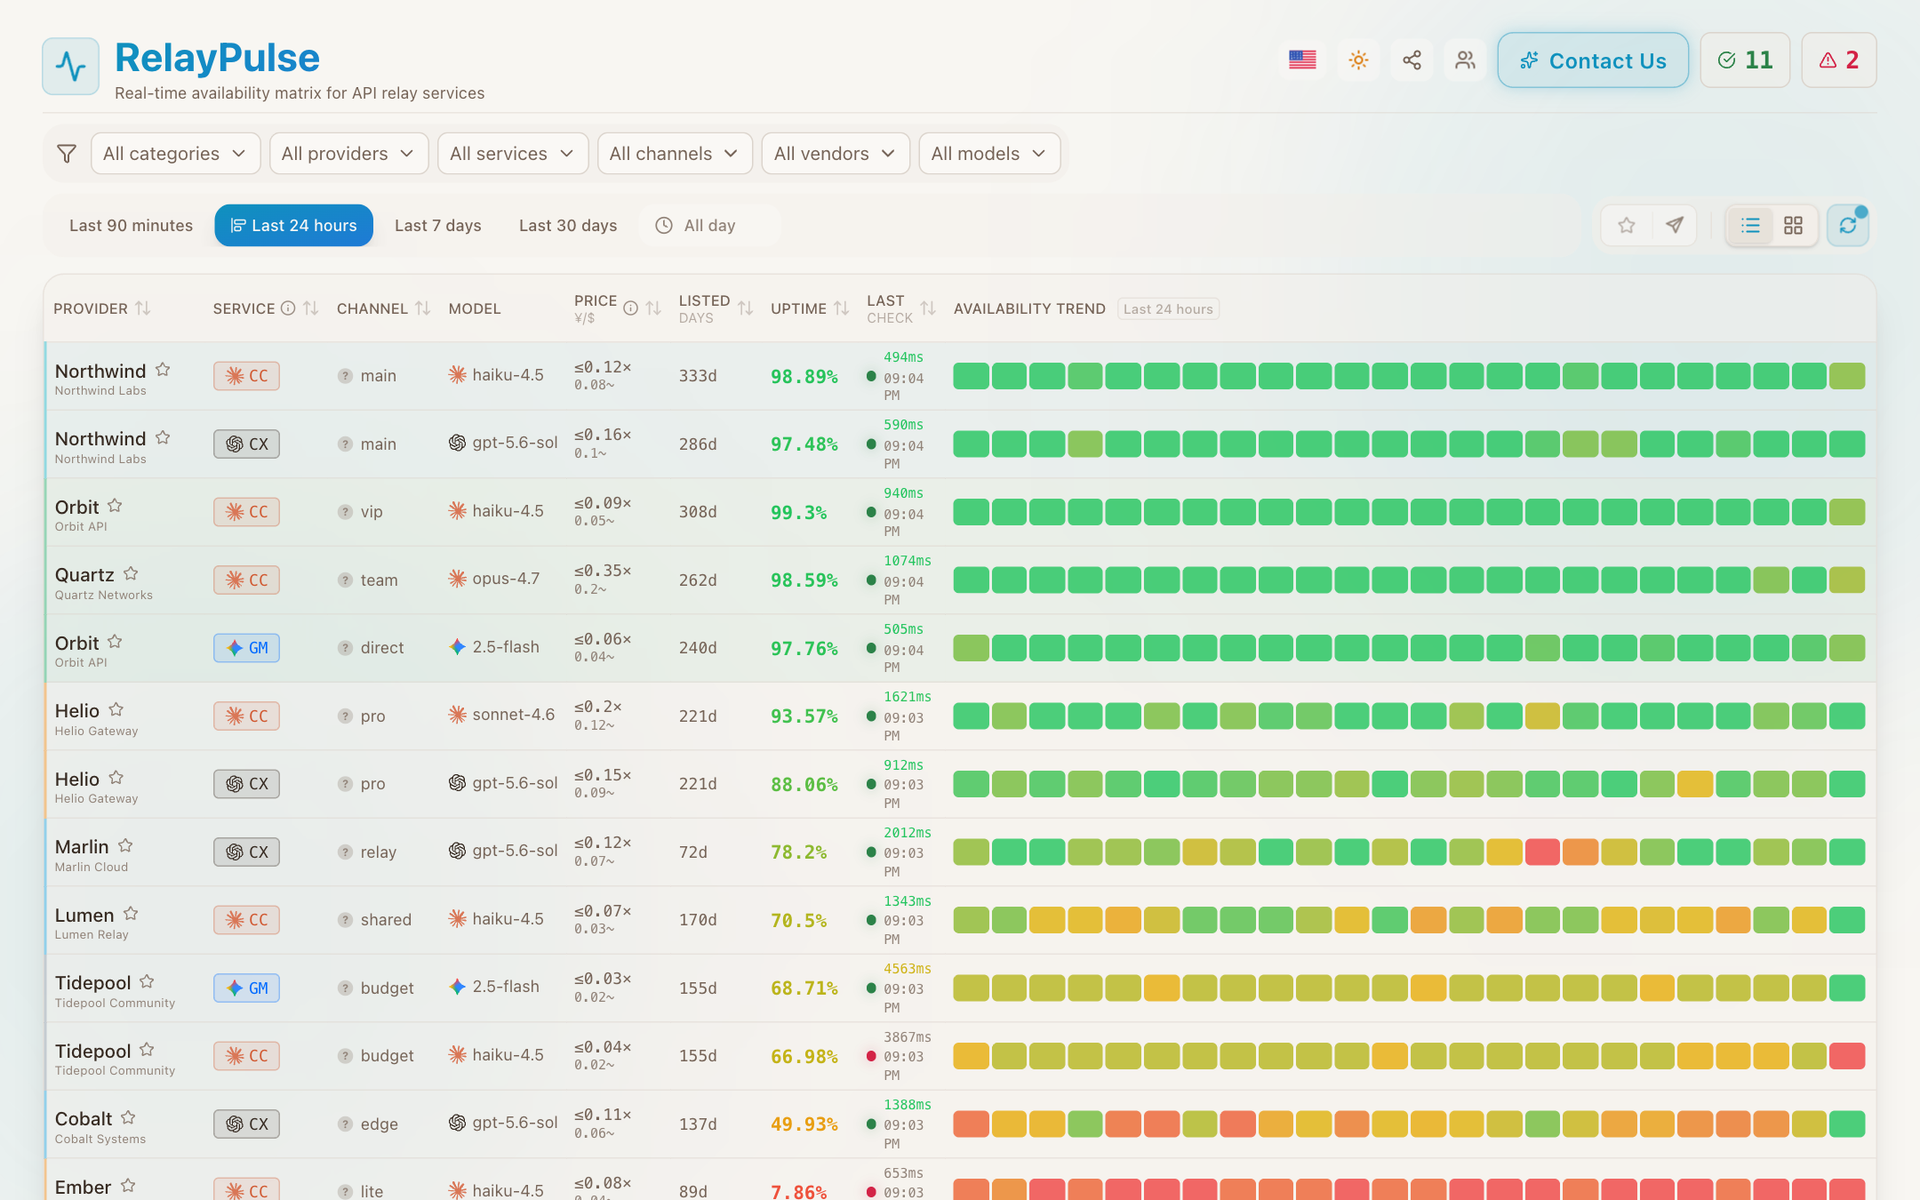
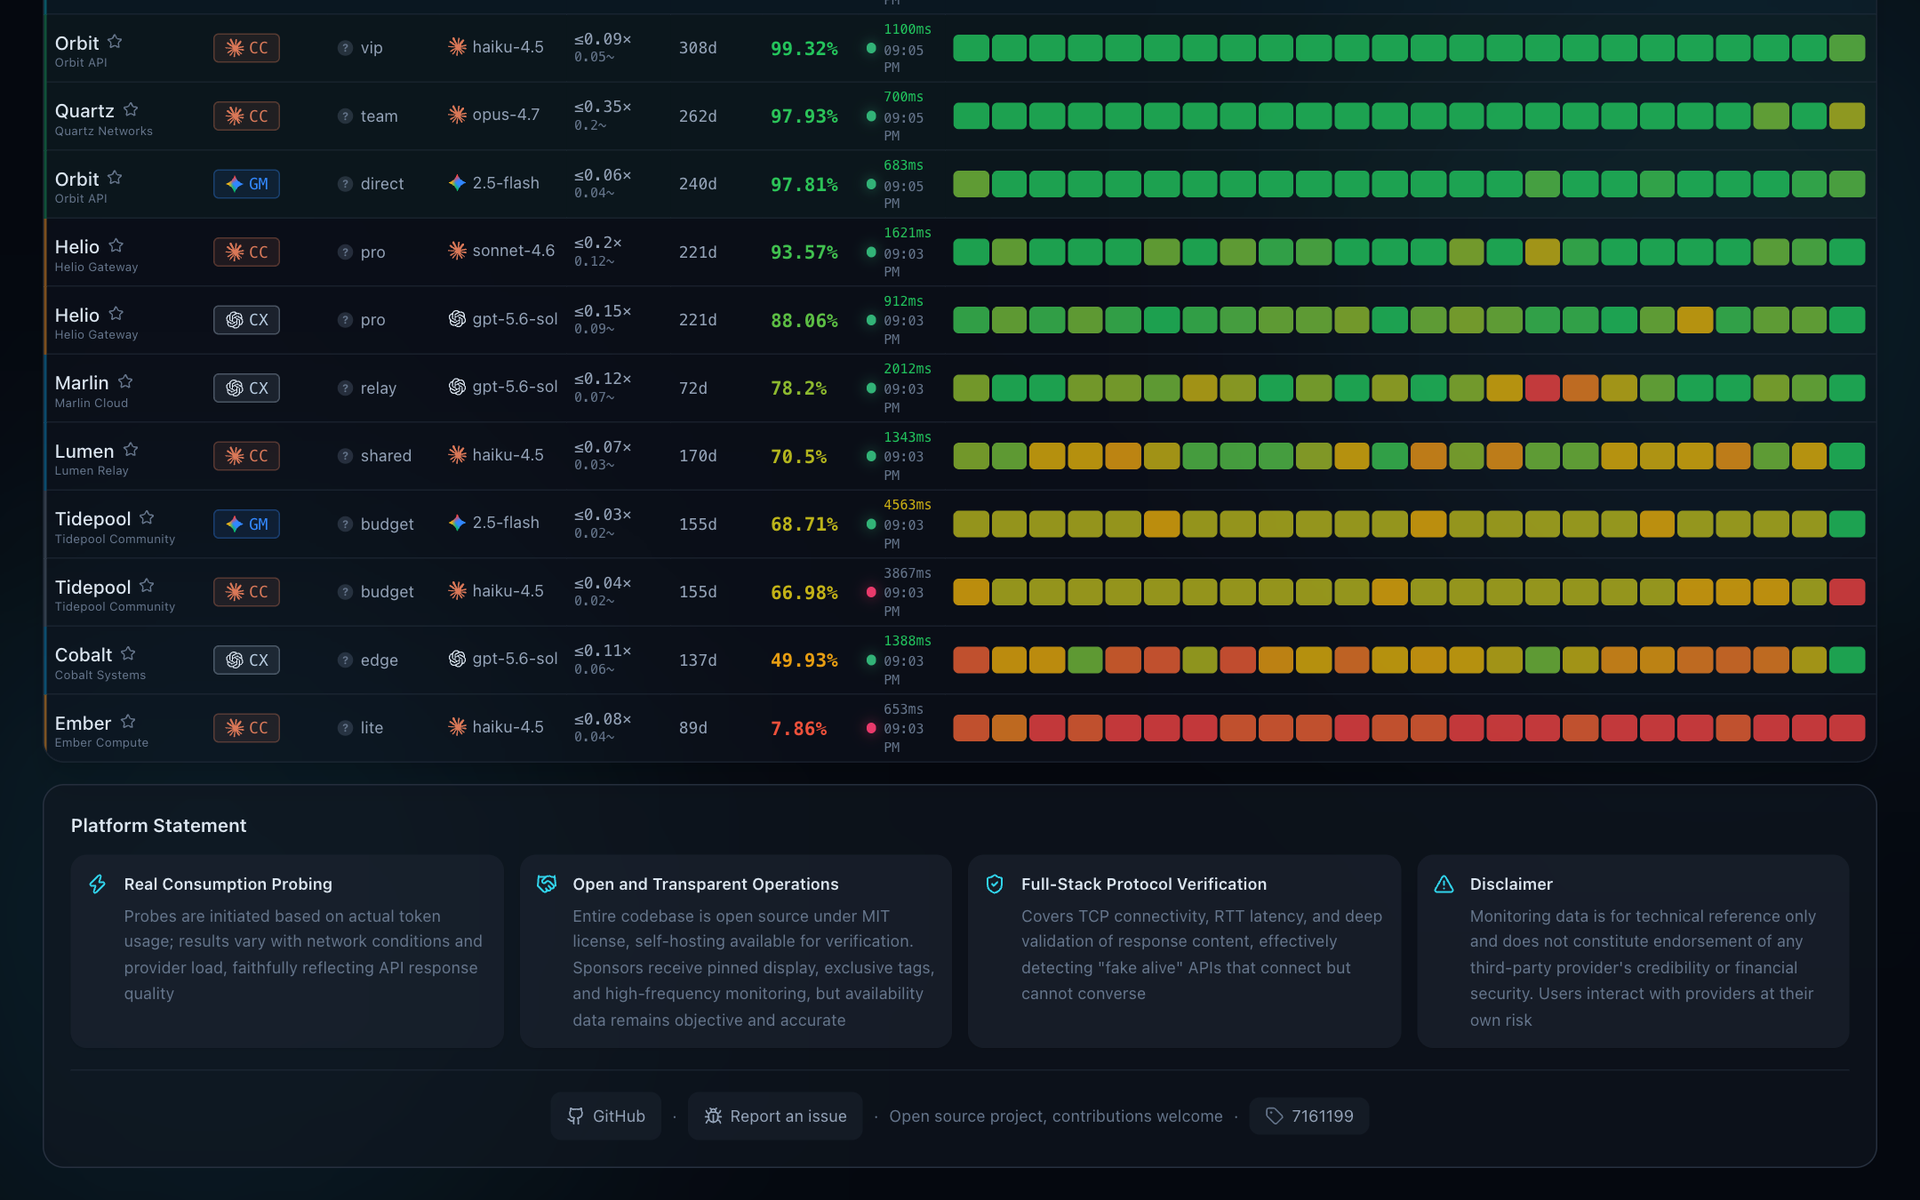
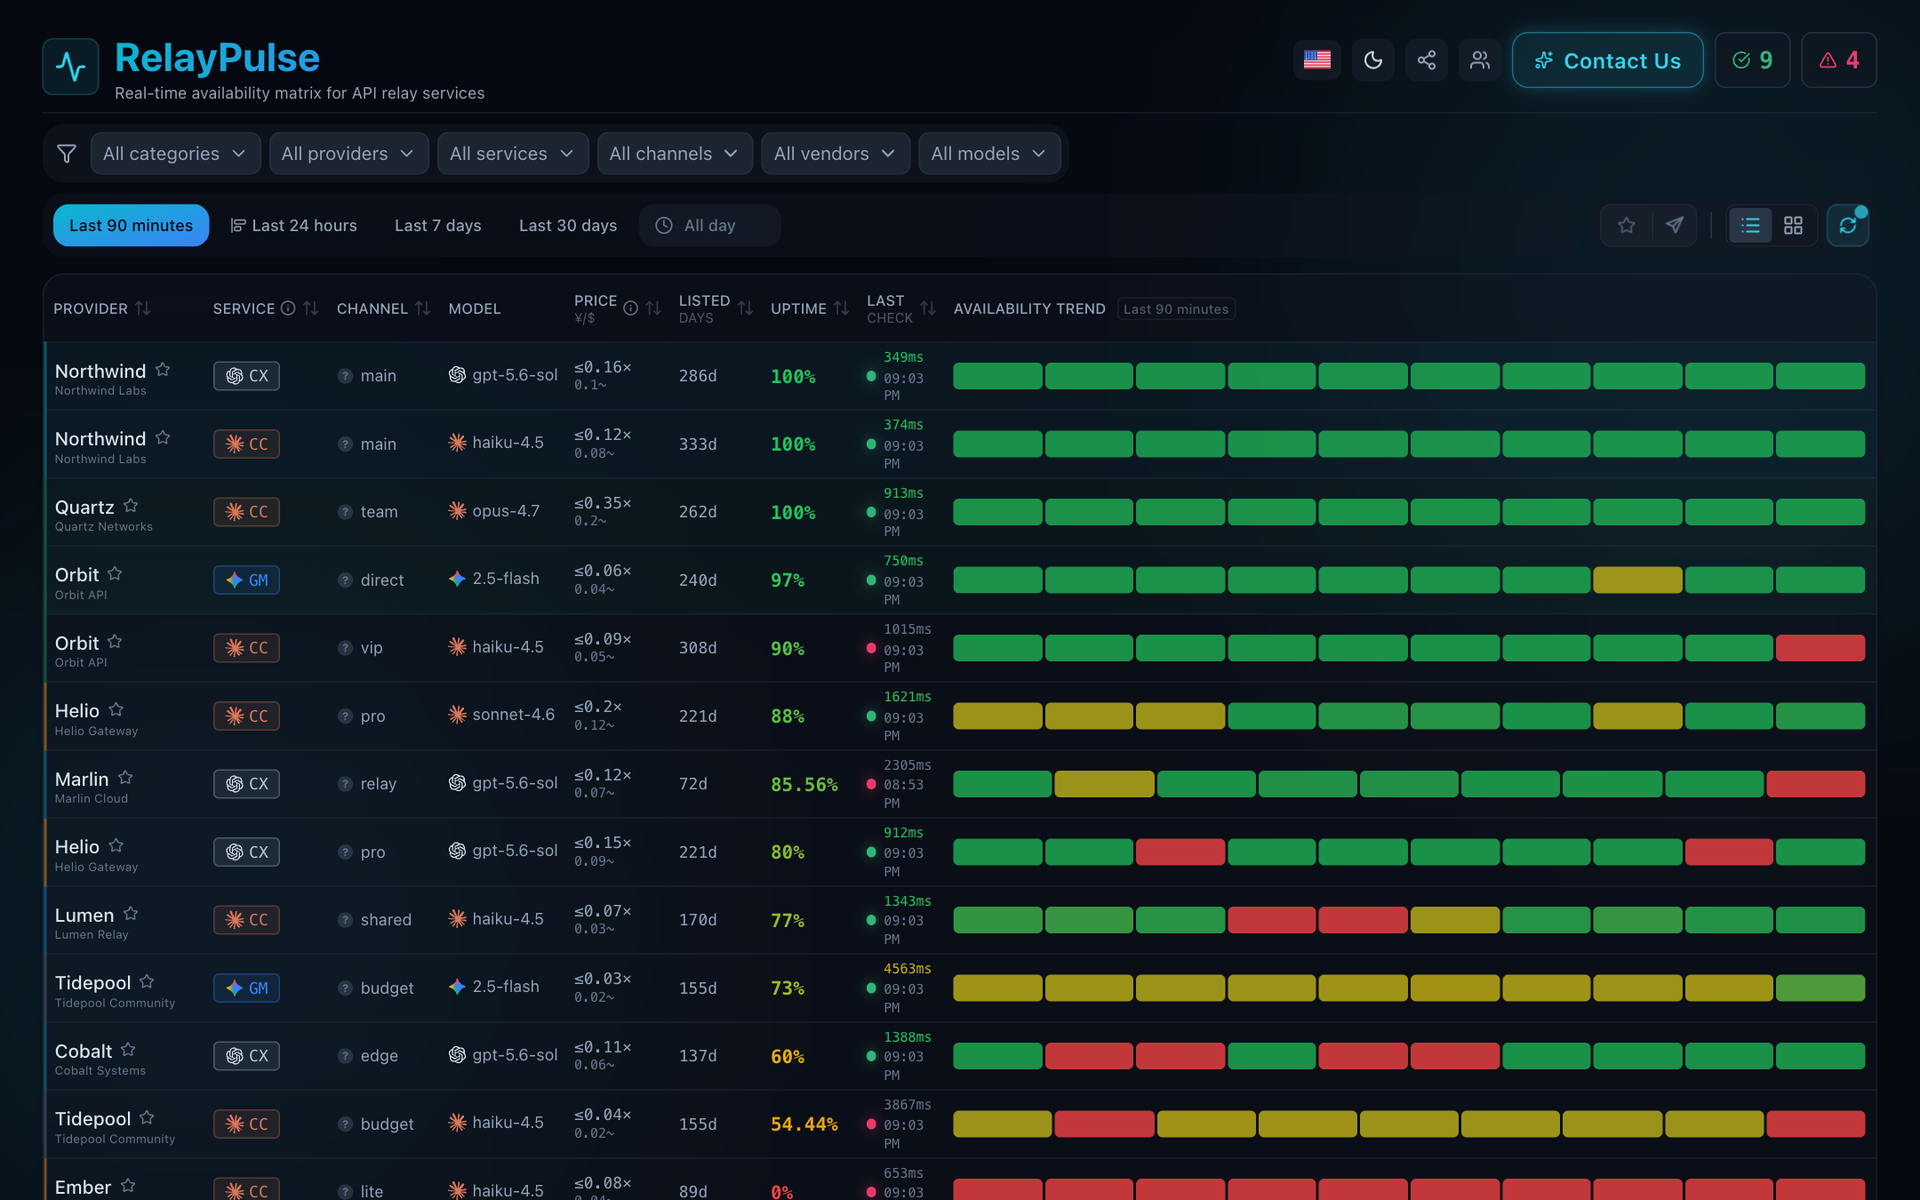
An API relay that answers HTTP 200 with an empty reply is not alive, and Relay Pulse exists to catch exactly that. Every minute, or any interval you set, it sends a tiny real request to each relay, asks a simple arithmetic question, and counts the probe as healthy only when the right answer comes back. Results land in a color-coded availability matrix where green, yellow, and red blocks show good, slow, and failed checks across the last 90 minutes, 24 hours, 7 days, or 30 days. Each row lists provider, service type, channel, model, price multiplier, days listed, uptime percentage, and the latest latency, and hovering a block reveals its probe counts and a breakdown of why it degraded. Filters narrow the table by category, provider, service, channel, vendor, or model, and the page switches between table and card views, four themes, and English or Chinese. Sponsor levels can pin trusted channels to the top, hot and cold boards separate active relays from dormant ones, and Telegram or QQ bots push status changes. Configuration reloads without a restart, templates cover Claude, Codex, and Gemini style endpoints, and a JSON API exposes current status. Running on a dedicated VPS on RepoCloud with guaranteed CPU, RAM, and SSD, full root SSH access, and a browser serial console. MIT licensed.
Benefits
- Catch Relays That Fake Alive
- Each probe checks the reply content, so a relay that returns HTTP 200 with an empty or wrong answer is marked as failed instead of passing a plain ping.
- See Trends At A Glance
- Heatmap blocks for 90 minutes, 24 hours, 7 days, and 30 days turn thousands of checks into a quick picture of uptime, slow periods, and outages.
- Compare Providers Side By Side
- Uptime, latency, price multiplier, and days listed sit in one sortable table, so choosing between several relays for the same model takes seconds.
- Cheap To Run Continuously
- Probes use a one-token response limit, which keeps token spend tiny, and all configuration and keys stay on your own server instead of a third-party service.
Features
- Real Content Validation
- Probes ask for a computed answer and mark the check failed when the returned text does not match, even if the HTTP status looks healthy.
- Filterable Availability Matrix
- Sort and filter by category, provider, service, channel, vendor, and model, with hover details showing probe counts and degradation reasons.
- Table And Card Views
- Switch between a dense table and responsive cards, choose from four dark and light themes, and read the interface in English or Chinese.
- Hot Reload Configuration
- Edit the YAML file or per-channel files and the monitor applies changes without a restart, with ready templates for common model endpoints.
- Telegram And QQ Alerts
- A notification service delivers status change events through Telegram or QQ bots, using the events API with token authentication.
- SQLite Or PostgreSQL Storage
- Start with zero configuration on SQLite for a single server, or point the monitor at PostgreSQL for larger multi-instance setups.