Stars
Forks
Watchers
Developer links
Monitor
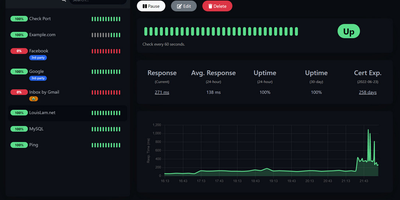
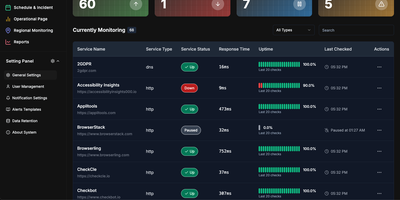
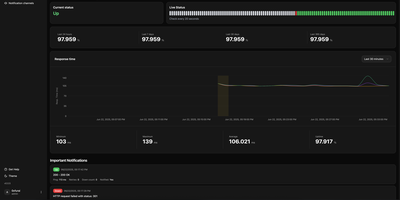
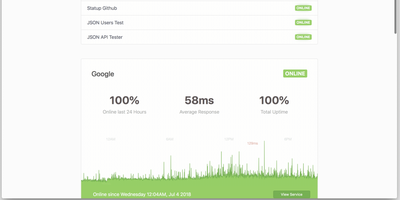
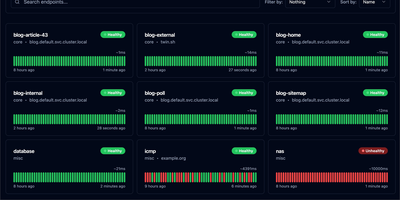
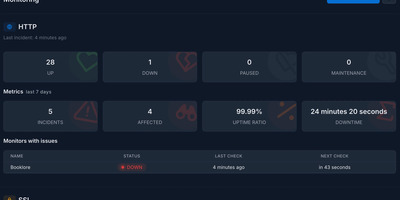
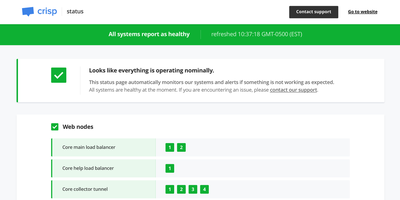
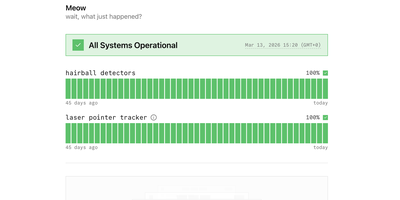
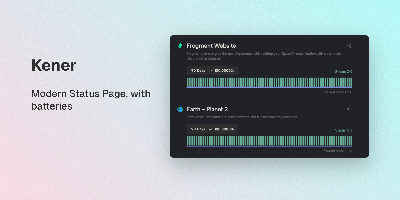
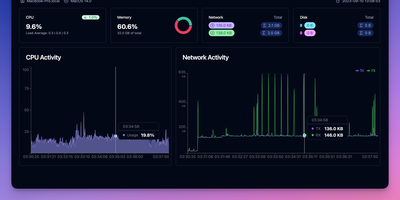
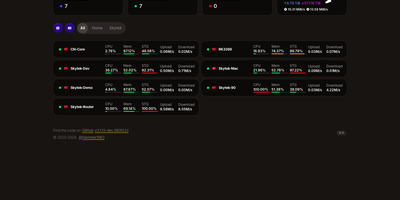
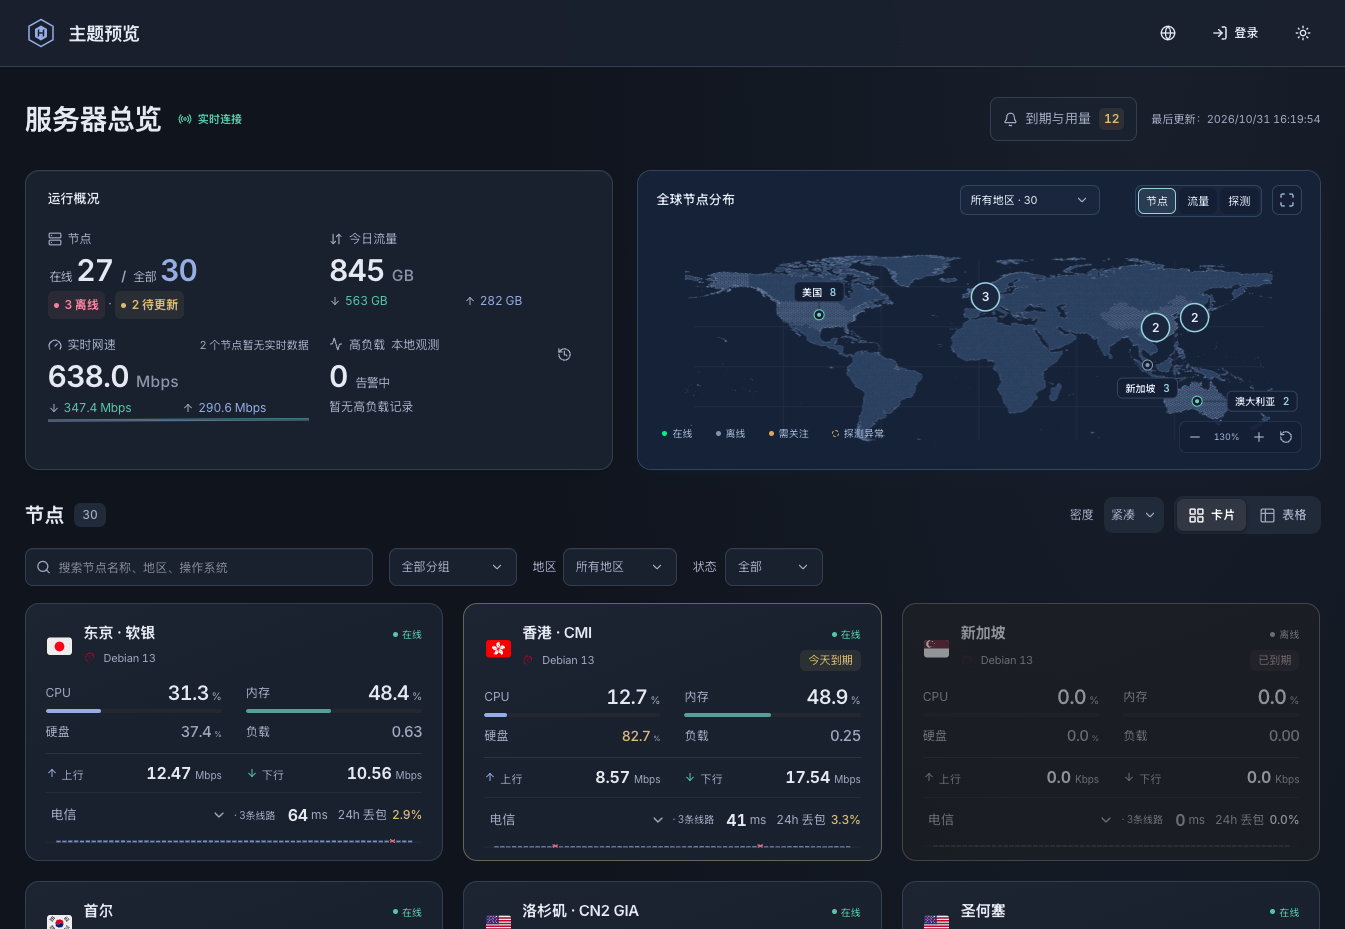
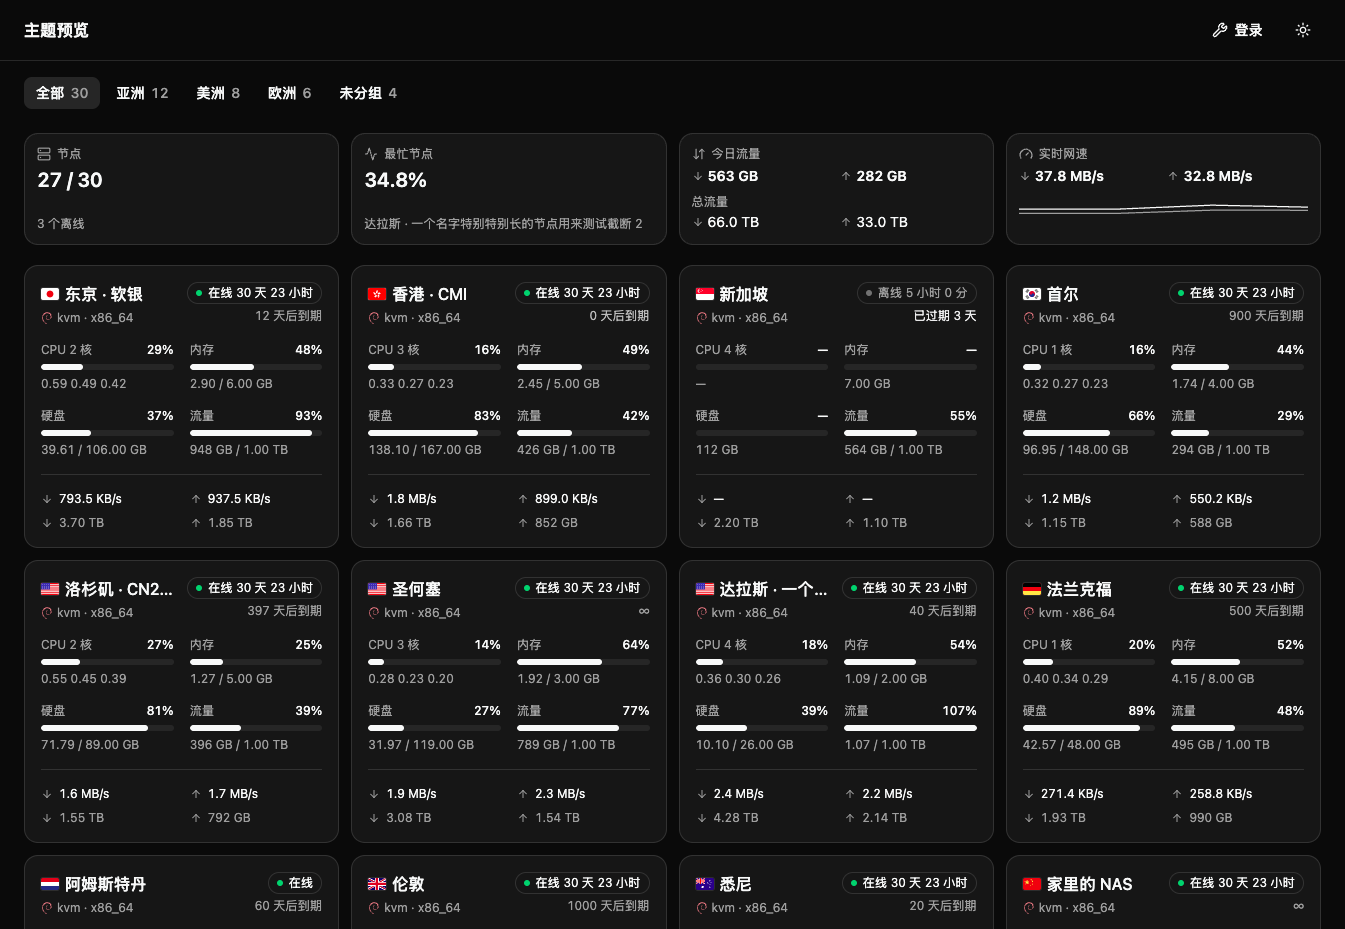
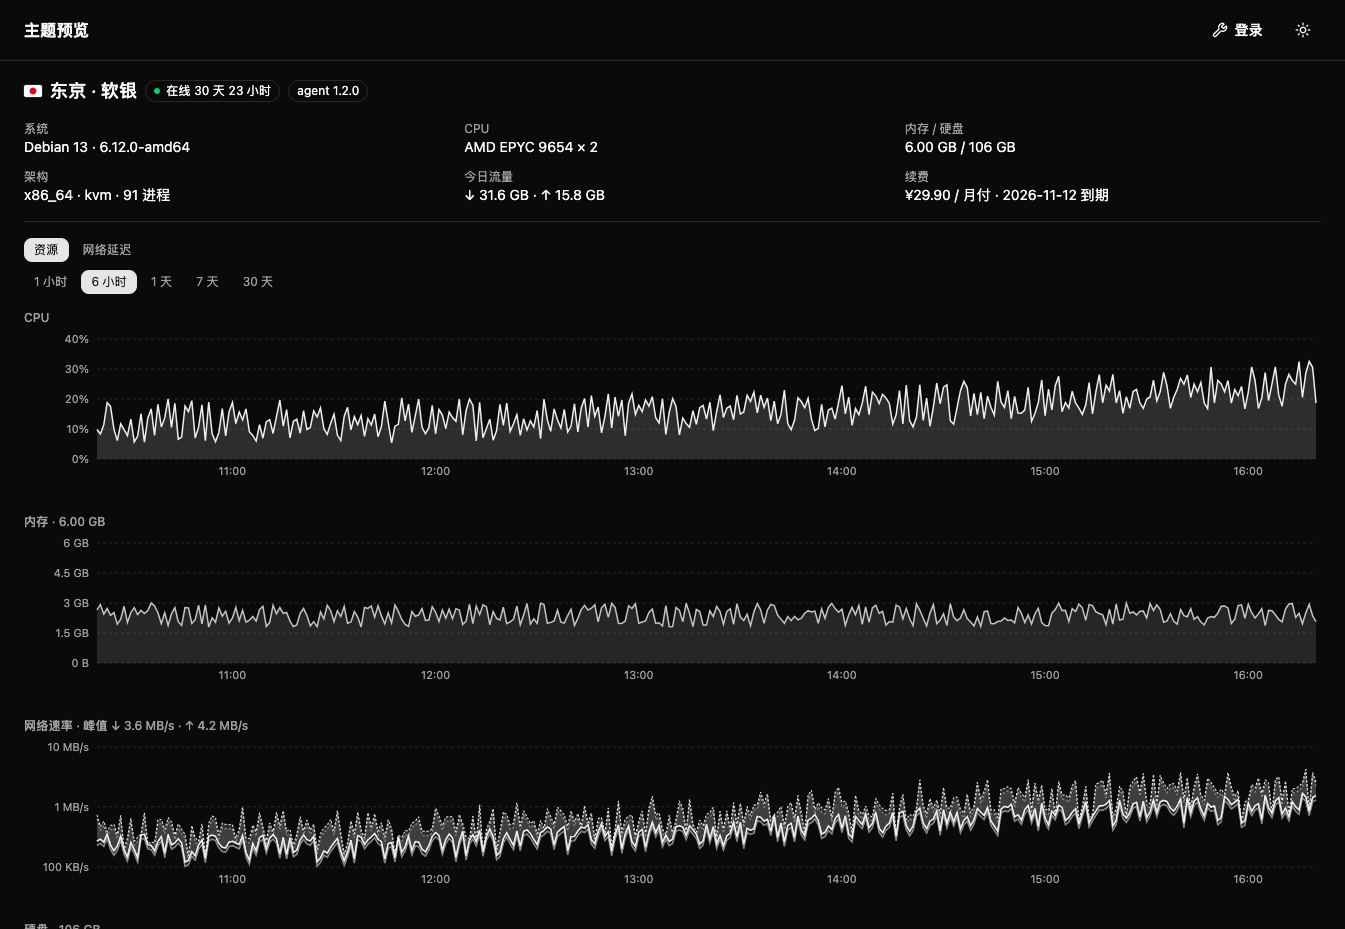
Monitor watches your servers the way a status page should: second by second, from one small binary you run yourself. A lightweight Linux agent on each machine reports CPU, memory, disks, network throughput, connections, and processes to your hub over a persistent connection, and the hub pushes a fresh snapshot to your browser every two seconds. History is kept for charting, so node pages show how load, traffic, and latency behaved over days. Ping tasks run from the hub's side too: define targets once and every agent measures latency to them on its own interval, drawing the curves next to the machine metrics. The public face is a status page you can reskin without touching the server: themes install from the panel, run as static pages against a small public API, and anonymous visitors see only the nodes you marked public, with addresses and hostnames stripped out. Node management stays practical: registration windows hand out tokens safely, installing an agent is one command, and replacing a token disconnects the old connection immediately. When a node goes offline, crosses its traffic allowance, approaches expiry, or someone signs in, alerts go out through Telegram or any webhook. The hub listens only on localhost behind your HTTPS proxy, signs in by password or GitHub OAuth allowlist, and lists revocable sessions. Running on a dedicated VPS on RepoCloud with guaranteed CPU, RAM, and SSD, full root SSH access, and a browser serial console. MIT licensed.
Benefits
- Second-Level Truth About Every Server
- Agents stream CPU, memory, disk, network, connection, and process metrics every second while the hub pushes fresh snapshots to the panel every two seconds, so incidents are seen as they happen.
- A Status Page You Can Reskin
- Public themes install from the admin panel and render from a small read-only API, while anonymous visitors only ever see nodes marked public, with IP addresses, hostnames, and remarks removed.
- Latency Measured From Every Node
- Ping tasks are pushed to agents automatically and each machine reports latency on its own schedule, placing network curves beside system metrics for every node without extra tooling or agents.
- Deliberately Hard To Expose
- The hub binds localhost only and expects an HTTPS reverse proxy, offers GitHub OAuth with an allowlist, revocable sessions, bearer-token agents, and immediate disconnection when a token is replaced.
Features
- Streaming Agent Metrics
- Linux agents send facts and metrics over one WebSocket JSON-RPC connection, covering CPU, load, memory, swap, disks, lifetime and instant network counters, TCP and UDP connections, and processes.
- History With Smart Retention
- Minute-level detail for recent days and hourly rollups beyond, queried by hours and point count so charts stay fast, with traffic totals correctly rebased across reboots and interface changes.
- Distributed Ping Tasks
- Up to sixty-four latency tasks per node are defined centrally, pushed to agents instantly when changed, and charted alongside metrics, with unreachable targets reported distinctly from slow ones.
- Installable Public Themes
- Themes are static packages installed from GitHub or upload in the panel, previewed before activation, and configured through forms the hub generates from each theme's declared settings.
- Offline And Traffic Alerts
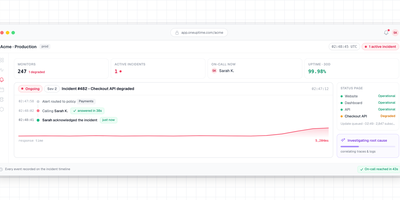
- Notifications for node offline events, traffic thresholds, expiry reminders, and sign-ins are delivered through Telegram or custom webhooks, with a test action in the panel before you rely on them.
- One-Command Agent Enrollment
- Time-boxed registration windows exchange a key for a node token, the hub relays signed agent binaries even to IPv6-only machines, and rerun installers reuse an existing token without reopening registration.