InfluxDB
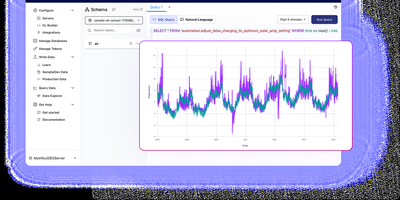
With over 31,600 GitHub stars and thousands of production deployments, InfluxDB 3 Core is the open-source time series database rebuilt in Rust on the FDAP stack — Apache Flight for high-throughput data transfer, DataFusion for vectorized SQL query execution, Arrow for columnar in-memory representation, and Parquet for compressed columnar storage. The engine delivers sub-10ms query response times on recent data and handles millions of writes per second through line protocol ingestion over HTTP, with unlimited tag cardinality eliminating the high-cardinality limitations that plagued earlier InfluxDB versions. The diskless architecture persists data as compressed Parquet files to S3-compatible object storage, Azure Blob, Google Cloud Storage, or local disk with configurable partitioning strategies, while the write-ahead log and in-memory buffer serve real-time queries against recent data before compaction. Native SQL support through DataFusion includes window functions, CTEs, subqueries, and joins, while InfluxQL maintains backward compatibility with existing InfluxDB 1.x and 2.x applications through the same query API. The embedded Python VM enables processing engine plugins and triggers that execute custom logic on write events, perform cross-database queries, and transform data in real time without external tooling. Flight SQL clients provide high-performance query access from Python, Go, Java, and Rust, and the HTTP API supports writes in line protocol format compatible with Telegraf's 300+ input plugins. Running on a dedicated VPS on RepoCloud with guaranteed CPU, RAM, and SSD, full root SSH access, and a browser serial console. MIT/Apache 2.0 dual-licensed.

Grafana
The de facto dashboard of observability: Grafana is the open-source frontend that turns the data stores you already run into interactive graphs. It does not store metrics itself; it connects to the data stores you already run and turns their contents into interactive dashboards. Supported sources number over 150 via plugins: Prometheus, Loki, Tempo, InfluxDB, Elasticsearch, MySQL, PostgreSQL, Microsoft SQL Server, AWS CloudWatch, Azure Monitor, Google Cloud Monitoring, and many more. Dashboards are built from a large library of panel types (time series, heatmaps, tables, gauges, logs) with template variables for reusable, parameterized views. Unified alerting evaluates rules against any connected data source, not just Prometheus, and routes notifications to Slack, PagerDuty, email, and other channels with grouping and silencing - unlike Prometheus Alertmanager, a single rule can combine a Loki log pattern, a PostgreSQL query result, and a CloudWatch metric. Dashboards serialize to JSON and data sources configure via provisioning files, so the entire observability setup can live in Git and deploy repeatably across environments. Explore mode adds ad-hoc querying outside dashboards, with split view for correlating a metric spike against the matching log lines, and access control spans organizations, teams, folder permissions, and OAuth, LDAP, and SAML integration. Written in Go and TypeScript, AGPL-licensed. Self-hosting gives you unlimited users, dashboards, and queries at flat hosting cost, without Grafana Cloud's usage-based pricing.
VictoriaMetrics
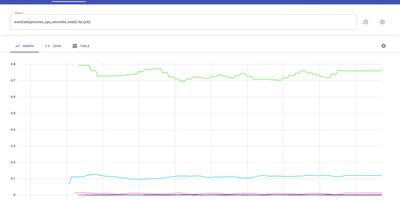
Trusted by thousands of organizations processing billions of time series data points and backed by 17,000+ GitHub stars, VictoriaMetrics delivers a monitoring and time series database that outperforms Prometheus by 16x on query speed while consuming 2.5x less disk space through its optimized compression and storage engine. The architecture supports both single-node deployments handling 10M+ active time series and a horizontally scalable cluster version with vminsert, vmstorage, and vmselect components providing multi-tenancy, replication, and independent namespace isolation. Data ingestion accepts both push protocols including InfluxDB line protocol, Graphite plaintext, OpenTSDB HTTP, CSV, and OpenTelemetry OTLP alongside pull-based Prometheus scraping and remote write, enabling drop-in replacement of existing monitoring stacks without reconfiguring exporters. MetricsQL extends standard PromQL with additional functions, subqueries, and implicit time range alignment while maintaining full backward compatibility with existing Prometheus alerts and Grafana dashboards. The vmalert component processes recording and alerting rules with Alertmanager integration, while vmbackup and vmrestore enable point-in-time snapshots to S3, GCS, and Azure Blob Storage. Stream aggregation operates as a StatsD alternative for pre-aggregating high-cardinality metrics before storage. NFS-compatible storage backends including Amazon EFS and Google Filestore allow shared persistent volumes across cluster nodes. Running on a dedicated VPS on RepoCloud with guaranteed CPU, RAM, and SSD, full root SSH access, and a browser serial console. Apache-2.0 licensed.
OpenObserve
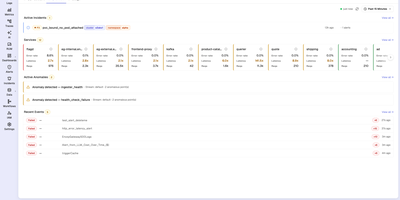
With 20,500+ GitHub stars and over 6,000 organizations running it in production — including a Fortune 100 company ingesting more than 4 PB per day — OpenObserve is the open-source observability platform that replaces your entire Datadog, Splunk, or ELK stack with a single Rust binary deploying in under two minutes. Apache Parquet columnar storage with zstd compression on S3-compatible object storage delivers 140x lower storage costs than Elasticsearch while providing better query performance on a quarter of the hardware. Ingest logs, metrics, and distributed traces via native OpenTelemetry OTLP endpoints with no vendor lock-in. Query logs and traces with standard SQL, metrics with SQL or PromQL — no proprietary query language to learn. The built-in dashboard builder offers 19 chart types including time-series graphs, heatmaps, gauges, tables, and top-K lists with drag-and-drop layout combining data from all signal types. Data pipelines process, enrich, redact, or normalize ingestion streams using Vector Remap Language for real-time transformations including PII redaction and logs-to-metrics conversion. Real User Monitoring captures frontend performance with session replay. The Service Catalog provides topology-based trace analysis with side-panel drill-downs into database queries and error details. Alerting supports real-time and scheduled rules with SQL and PromQL conditions. Native multi-tenancy isolates organizations and streams with complete data separation. Running on a dedicated VPS on RepoCloud with guaranteed CPU, RAM, and SSD, full root SSH access, and a browser serial console. AGPLv3 licensed.
Statainer
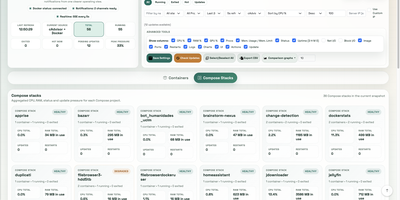
Monitoring and safeguarding Docker infrastructure without heavy enterprise software overhead is the primary mission of Statainer, an open-source management control center for container hosts. System operators inspect live CPU loads, memory consumption, network throughput, and disk I/O metrics across individual containers or comparative top-ranking charts. The interface groups containers by Compose projects, enabling administrators to start, stop, or restart entire application stacks and inspect real-time log streams without opening SSH sessions. The built-in Update Manager detects available image tags, executes single-click container updates, and maintains persistent deployment history with automated rollback capabilities for failed recreations. Custom alert configurations trigger instant notifications to Telegram, Discord, Slack, Pushover, or generic webhook endpoints whenever resource thresholds are breached or container health states change. Developers can provision scoped API keys with token authentication to automate container state transitions and export performance telemetry into custom monitoring workflows. Running on a dedicated VPS on RepoCloud with guaranteed CPU, RAM, and SSD, full root SSH access, and a browser serial console. MIT licensed.