Categories
Self-Hosted DevOps GitHub Analytics Developer Productivity DORA Metrics Team Metrics Engineering AnalyticsStars
Forks
Watchers
Developer links
Middleware
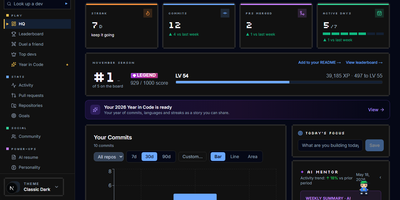
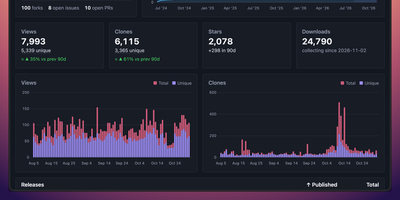
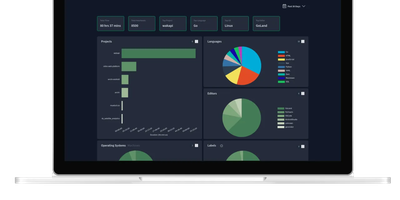
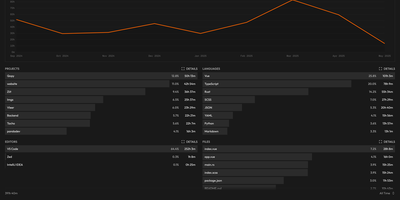
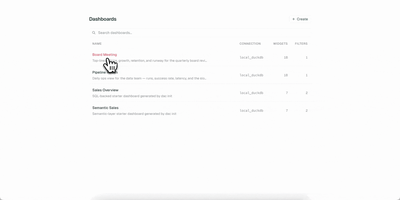
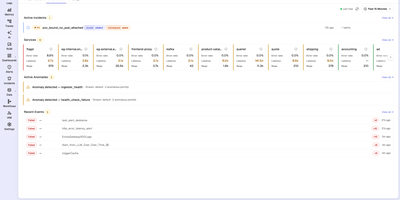
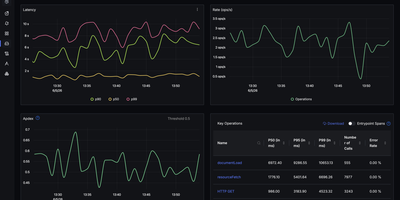
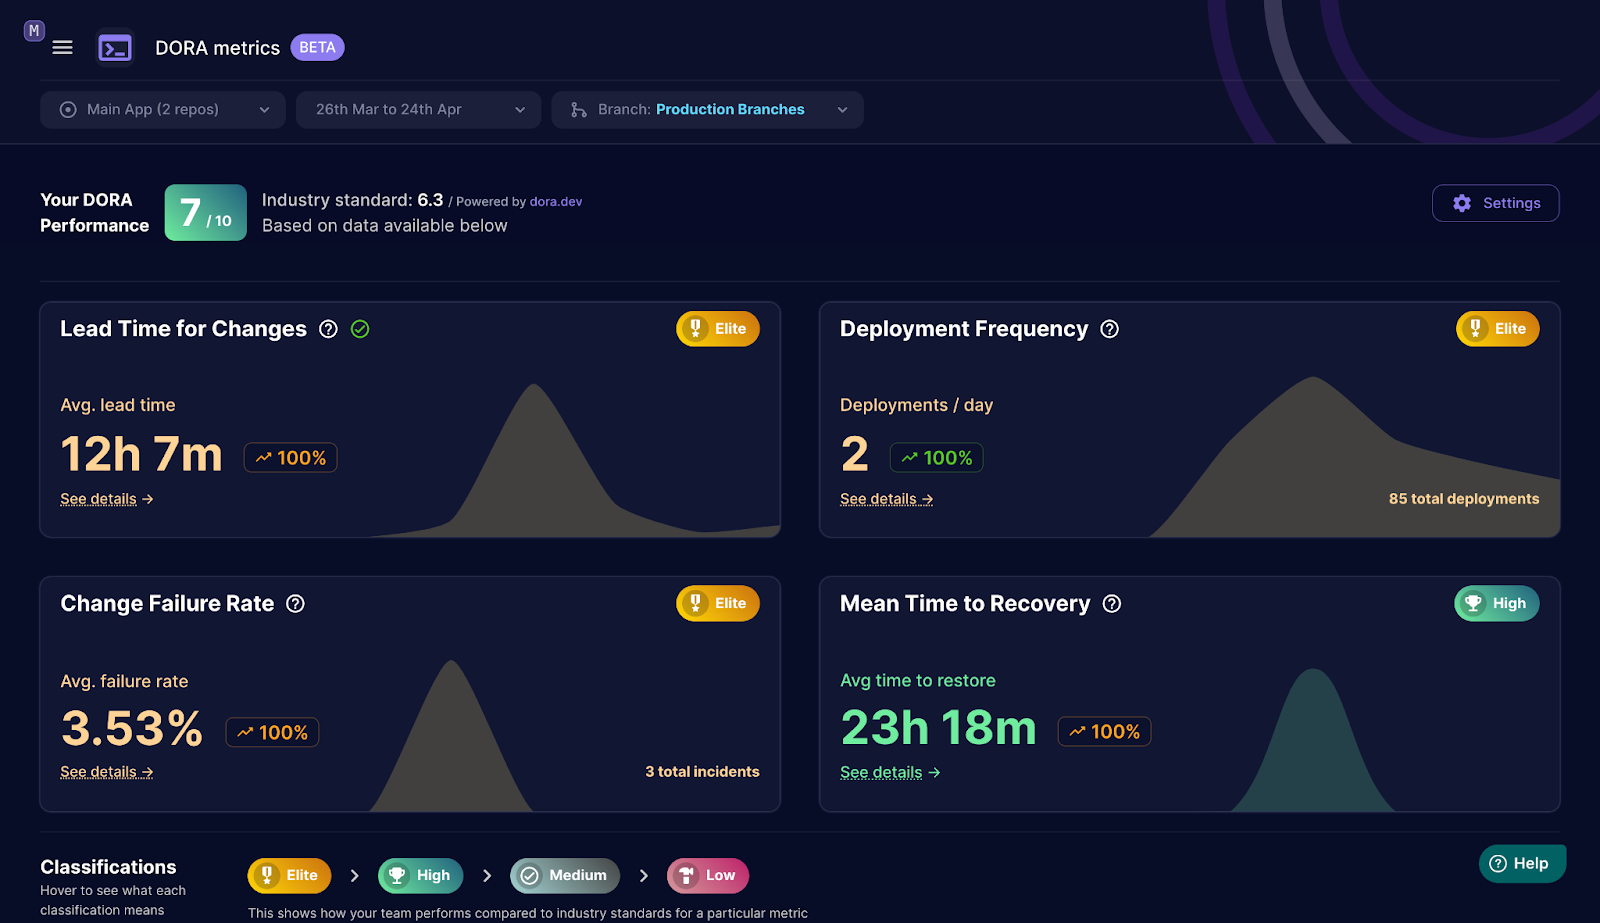
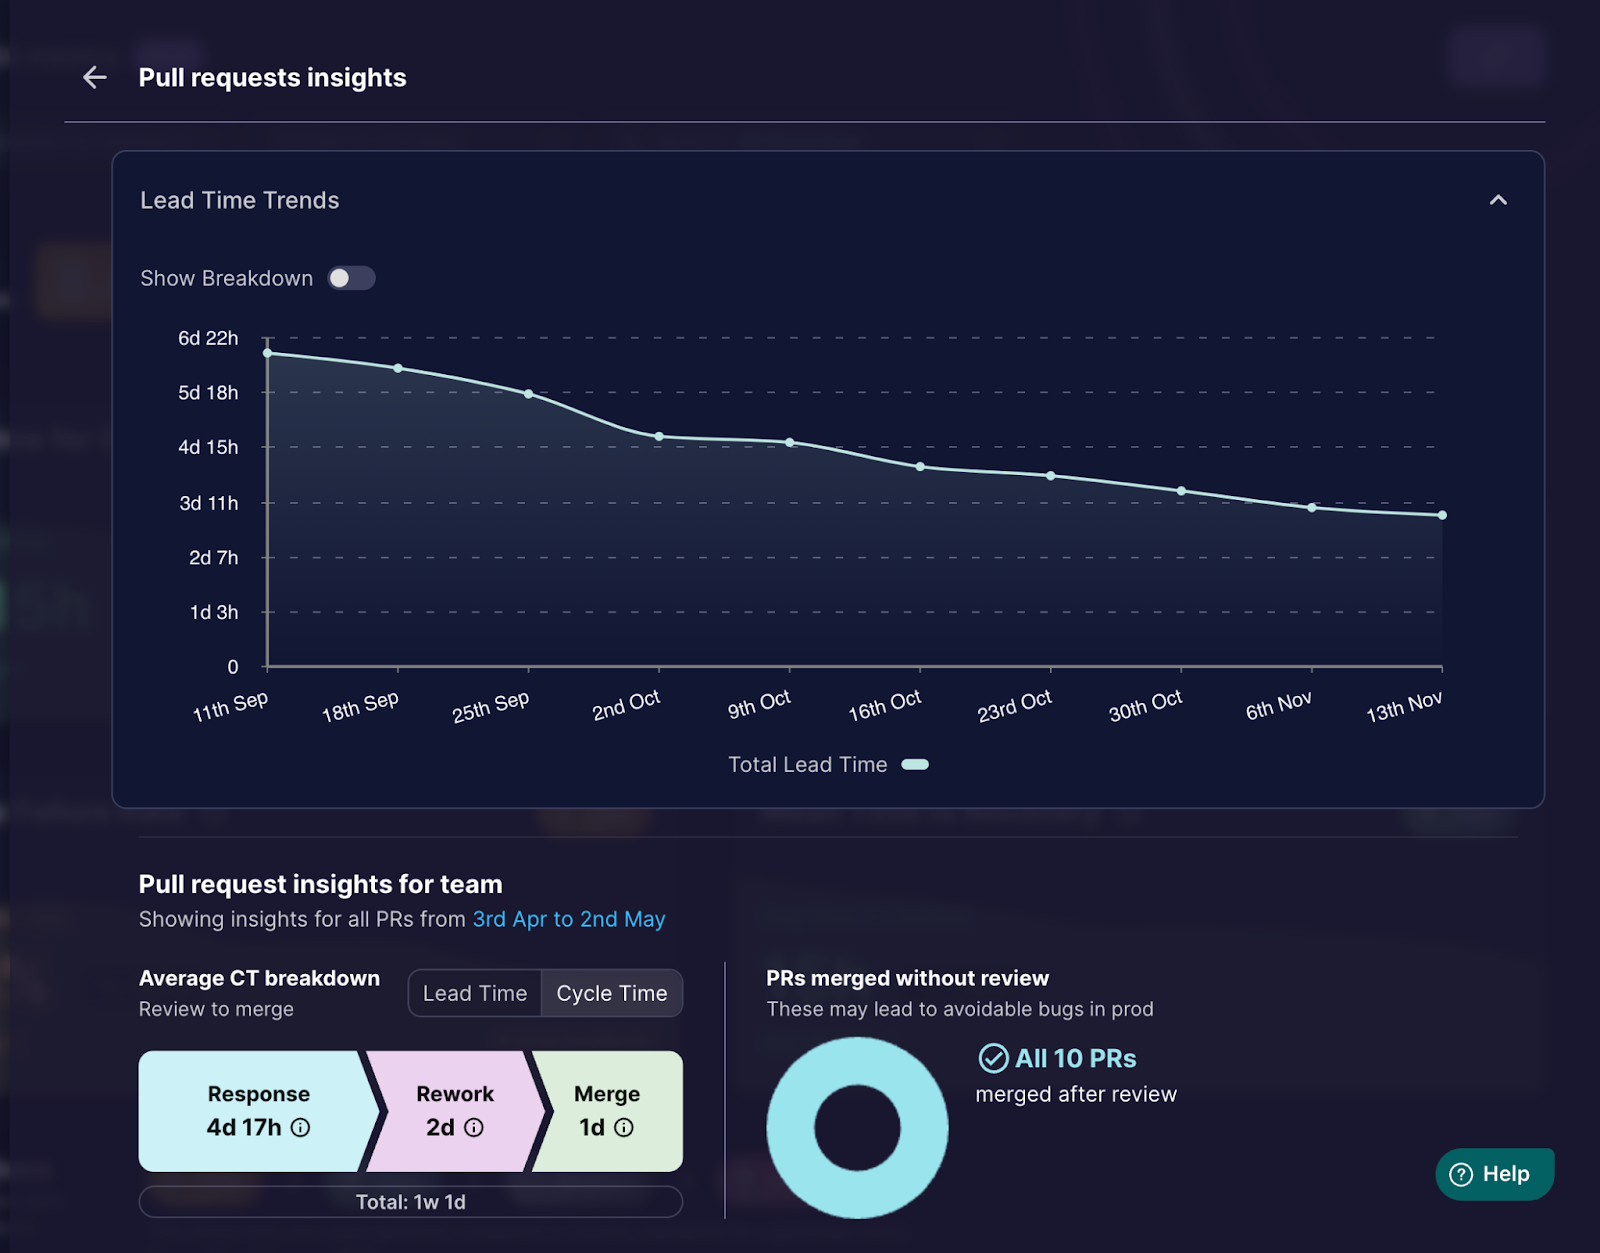
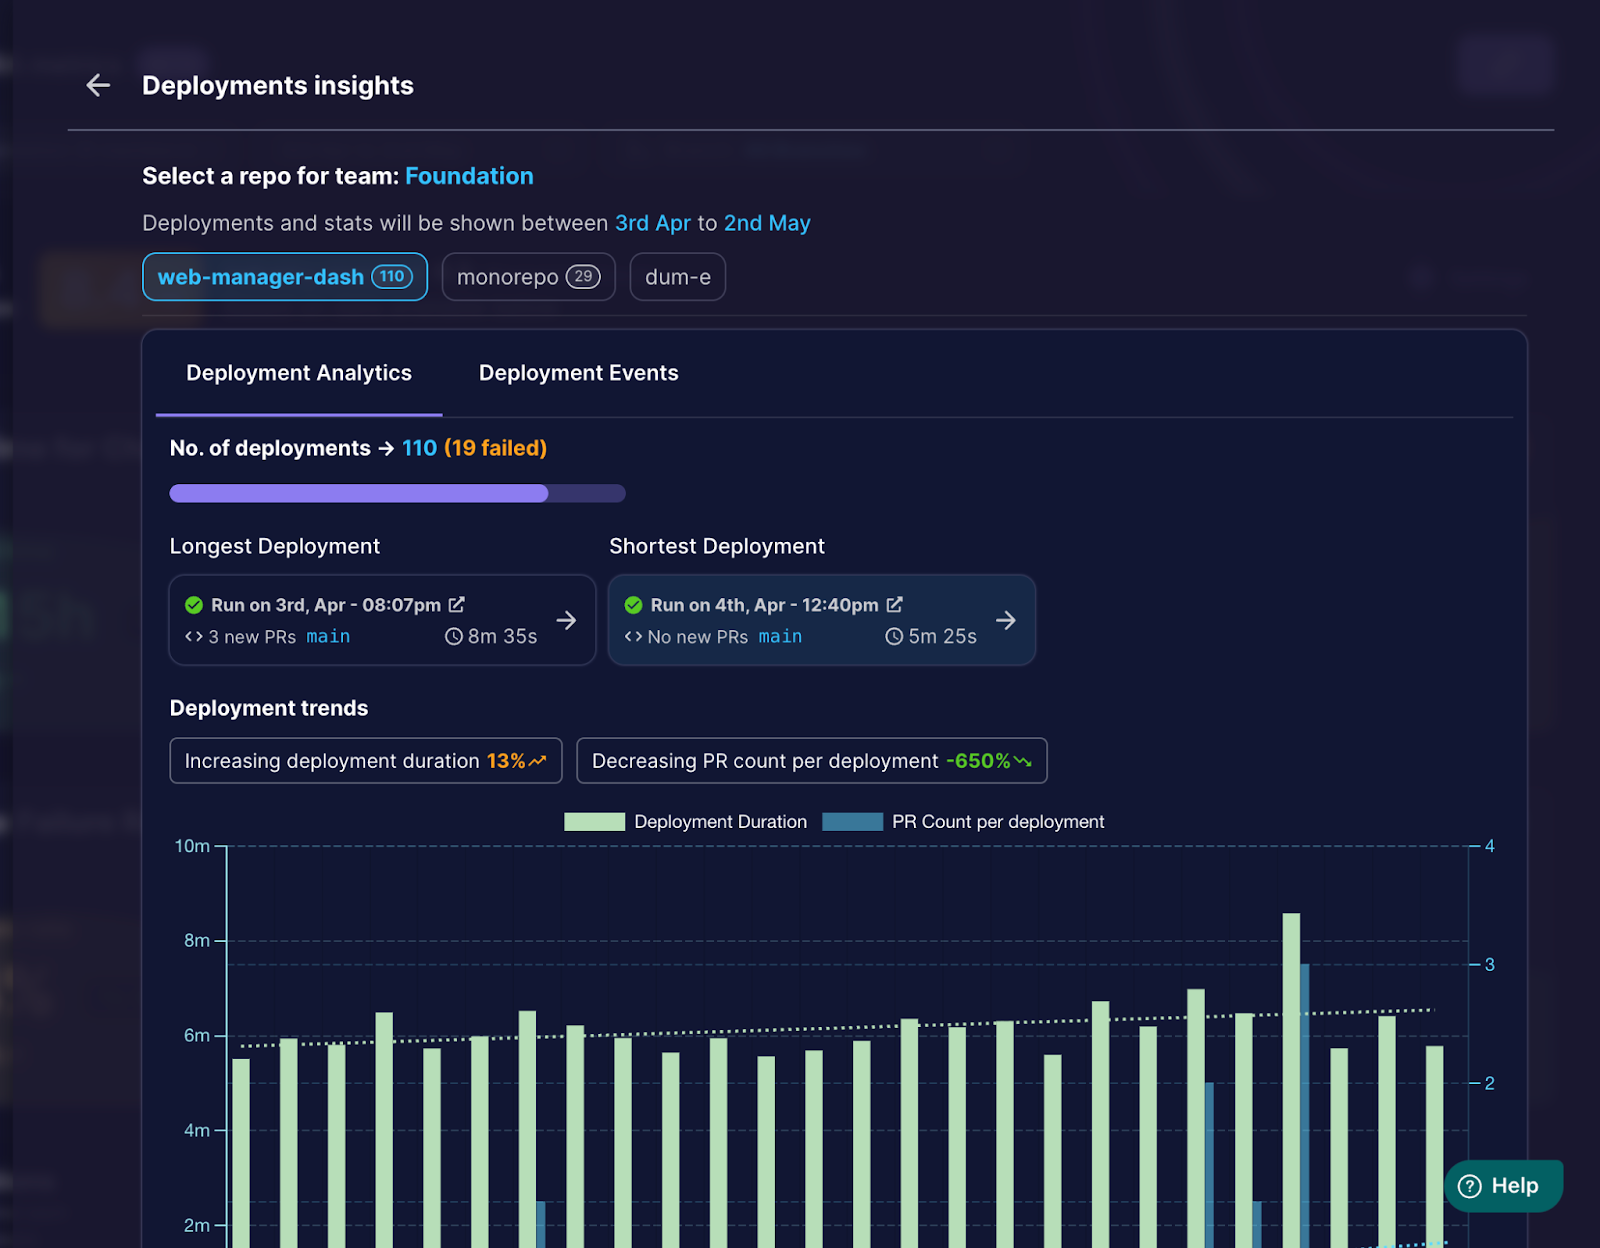
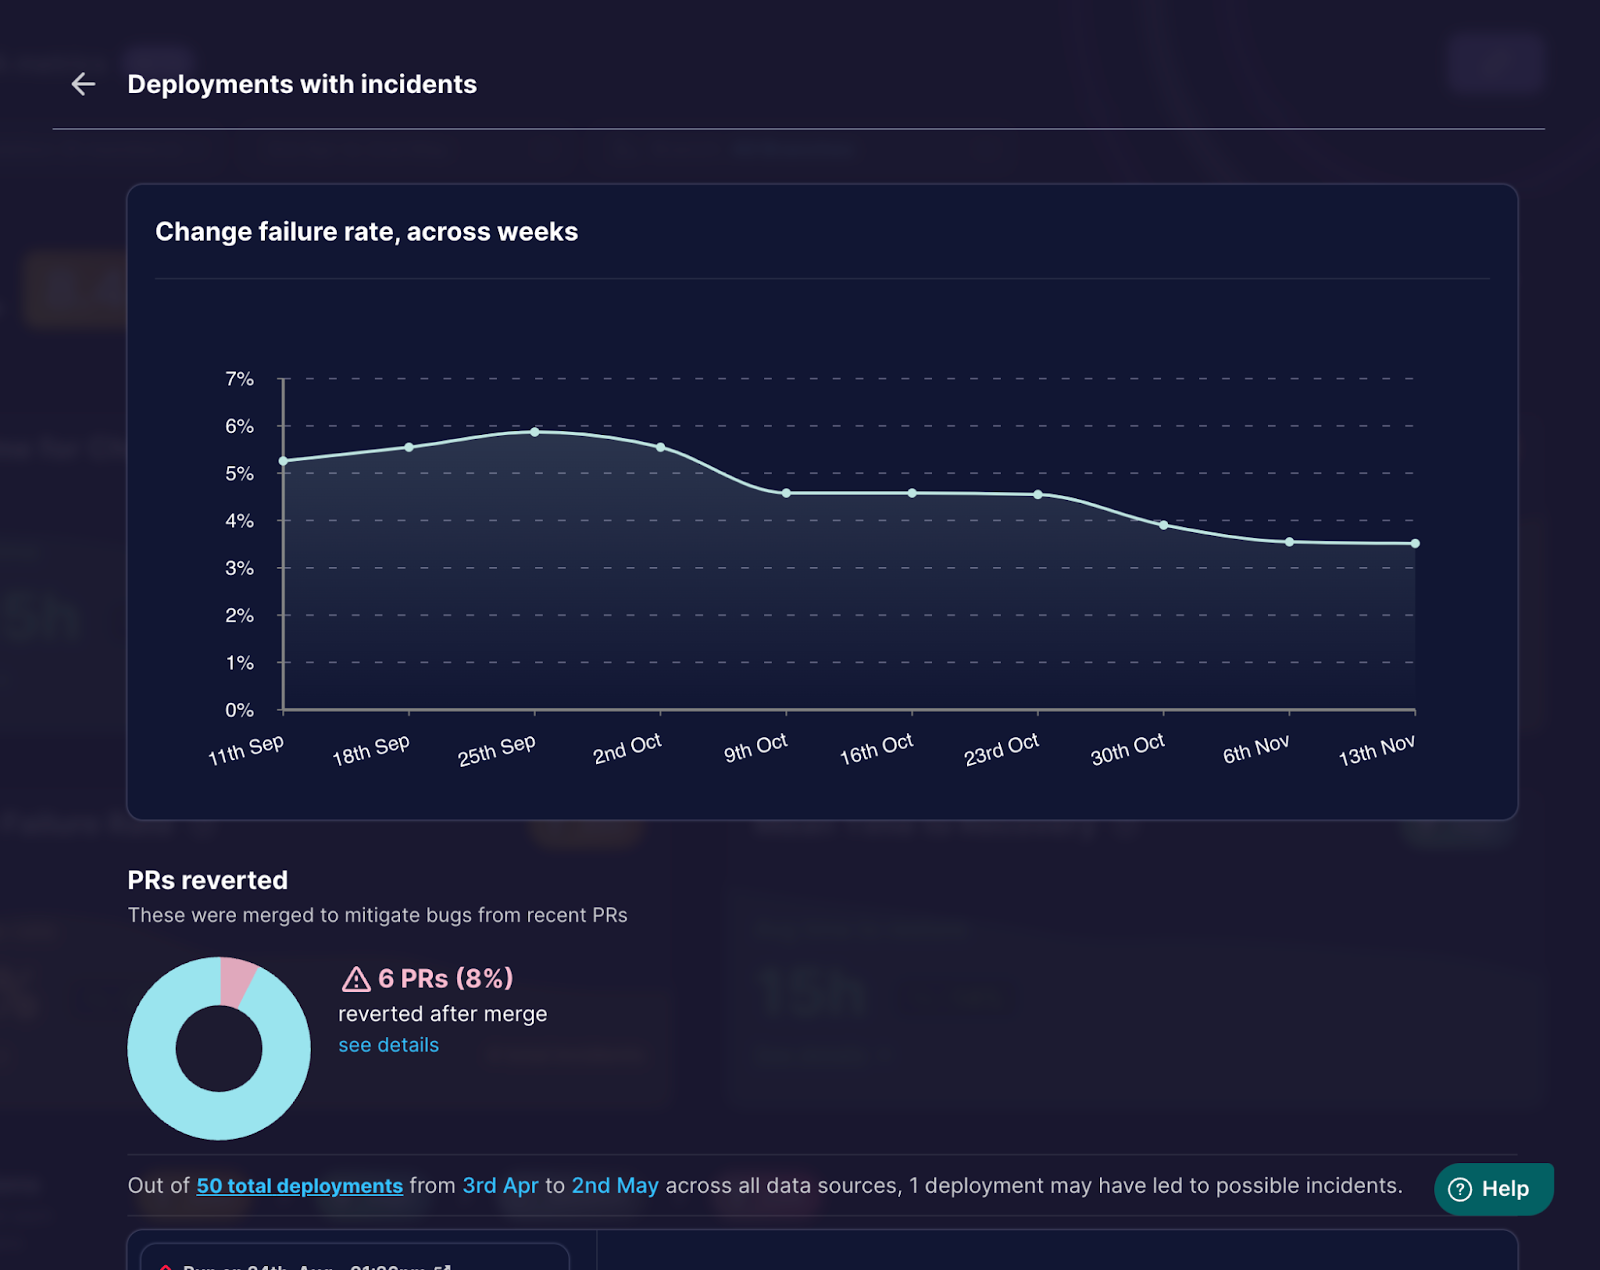
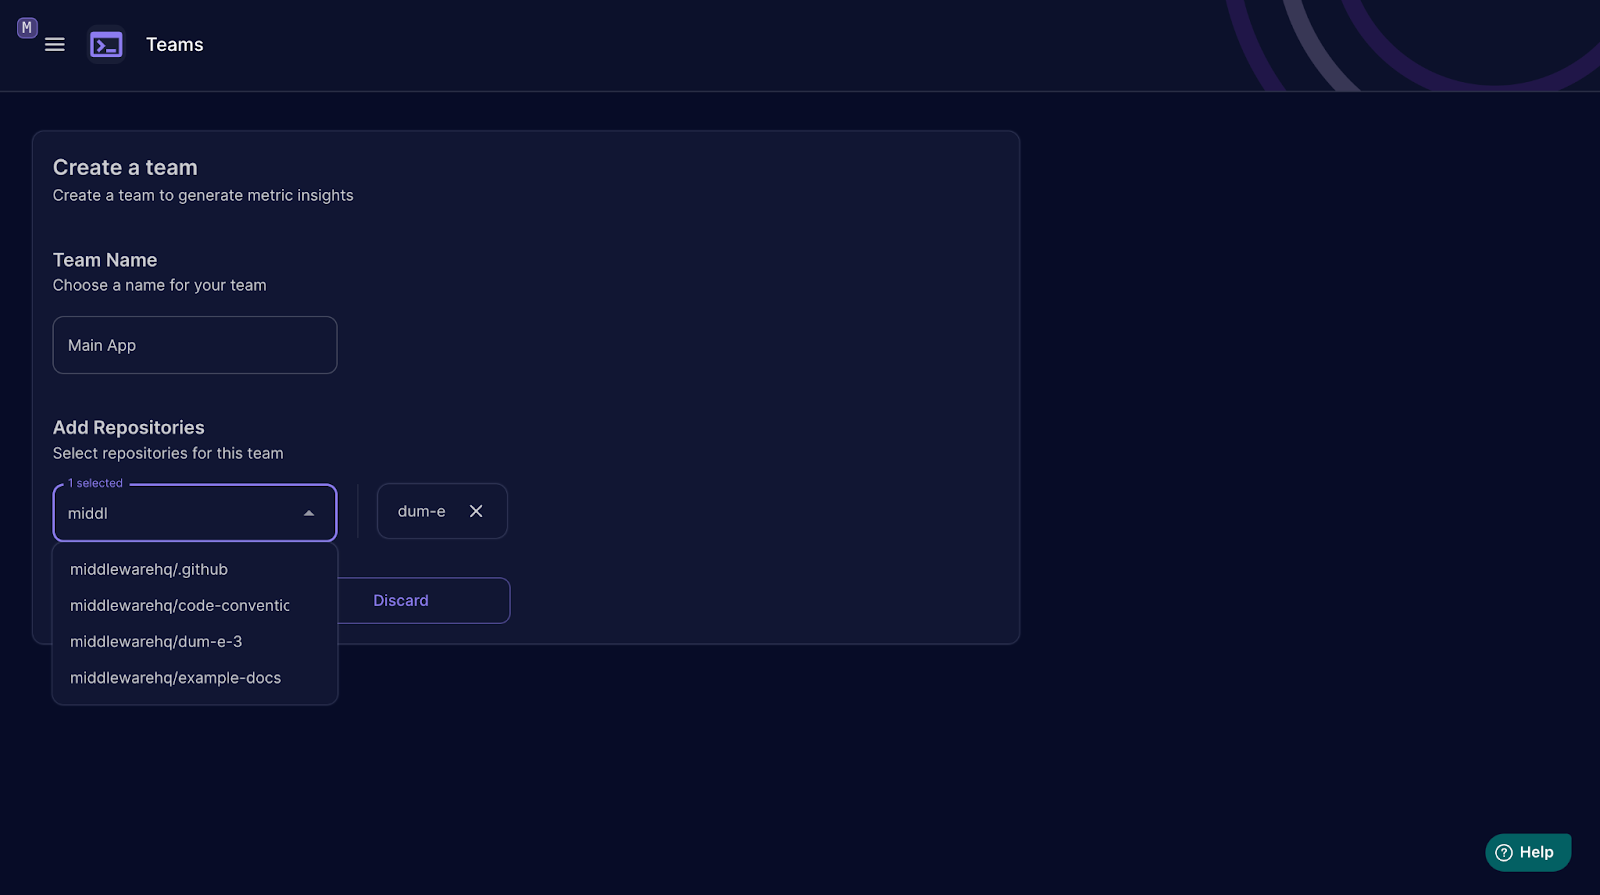
Middleware turns the pull request history your team already has into live DORA metrics, so engineering leads can see deployment frequency, lead time, recovery time, and change failure rate without building a reporting pipeline. Connect GitHub with a personal access token, group repositories into teams, and the dashboard starts charting how often you ship and how long changes take to reach production. Lead time is not one opaque number; it breaks into first commit to pull request, first response time, rework time, merge time, and merge to deploy, so the actual bottleneck is visible instead of guessed at. Merged pull requests count as deployments and revert pull requests count as incidents, which means recovery time and change failure rate appear even if your team has no separate incident tool wired up. You can exclude bot and dependency pull requests, define which branches count as production, and filter incidents in settings, so the metrics match how your team actually ships rather than how a generic template assumes. Bring it to a weekly engineering review to catch a review queue quietly doubling merge times, or open it after an incident to see if failure rate is trending the wrong way across a team. Running on a dedicated VPS on RepoCloud with guaranteed CPU, RAM, and SSD, full root SSH access, and a browser serial console. Apache-2.0 licensed.
Benefits
- DORA Metrics From Git Alone
- Connect GitHub with a personal access token and Middleware treats merged pull requests as deployments and reverts as incidents, producing all four DORA metrics without any CI or incident tooling.
- Lead Time, Broken Down
- Instead of one opaque number, lead time splits into first commit to pull request, first response, rework, merge, and deploy stages, showing exactly where changes stall inside your process.
- Teams Tuned To Reality
- Group repositories into teams, exclude bot and dependency pull requests, and mark the branches that count as production, so every chart reflects how your team ships, not a default template.
- One Container On Your Server
- A single Docker image bundles the web dashboard, analytics and sync servers, PostgreSQL, and Redis, so your pull request data and metrics stay on infrastructure your team controls.
Features
- Four DORA Metrics
- Deployment frequency, lead time for changes, mean time to recovery, and change failure rate are computed continuously from pull request, deployment, and incident data and charted over time.
- Lead Time Breakdown
- Every change is decomposed into commit to pull request, first response, rework, merge, and merge to deploy stages, exposing the stage where reviews, fixes, or queues consume the calendar.
- GitHub Token Integration
- A personal access token is the only credential required; Middleware syncs pull requests from the repositories you select and keeps them updated through its background sync server.
- Team Dashboards
- Repositories group into teams with their own metric views, so a platform group and a product group each see their delivery numbers side by side without mixing.
- Filters That Fit Reality
- Incident filters, excluded pull requests, and production branch settings decide what counts as a deployment or a failure, keeping automated and non-production activity out of the metrics.
- Single-Container Docker Deploy
- One Docker run command starts the web app on port 3333 with analytics and sync services, PostgreSQL, and Redis bundled, with volumes for data and encryption keys.