Parca
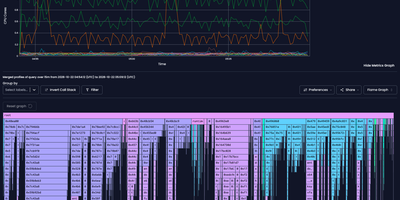
A flight recorder for production code, Parca profiles CPU and memory continuously and keeps the history to query after something breaks. A slow memory leak or a momentary CPU spike is already on record by the time anyone looks. Point it at any service that exposes pprof endpoints, or deploy the eBPF-based Parca Agent to profile every process on a Linux host or Kubernetes node without touching application code. The agent covers C, C++, Rust, Go, and more. In the web UI, pick a profile type such as on-CPU, narrow it with Prometheus-style label selectors, sum or group by any label, and click a point on the time series to open its flame graph. Switch the same query to a table, add extra panels, or try the alpha Flame Chart and Sandwich views. After a deploy, open the Compare page, set two queries side by side by label or time range, and the functions that gained or lost CPU time stand out as a diff. Native binaries are symbolized from uploaded debuginfo or upstream debuginfod servers. Recent releases add support for OpenTelemetry eBPF profiler profiles and GPU profile types. Optional persistence keeps history across restarts, and a Prometheus-style scrape configuration with service discovery decides what gets profiled. Running on a dedicated VPS on RepoCloud with guaranteed CPU, RAM, and SSD, full root SSH access, and a browser serial console. Apache-2.0 licensed.
PatchMon
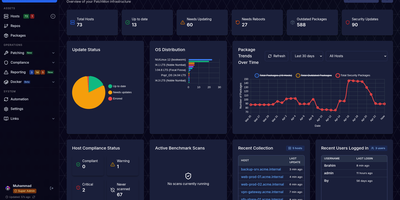
Unpatched Linux servers expose production environments to critical vulnerabilities, and PatchMon eliminates that blind spot by centralizing package telemetry, security advisory tracking, and automated update orchestration across your entire fleet. Administrators can inspect pending updates across APT, DNF, YUM, APK, Pacman, Zypper, FreeBSD pkg, Windows Update, and winget from one unified queue without opening inbound firewall ports on monitored hosts. Before touching production workloads, operators run dry-run validations to preview exact package transactions, enforce multi-user approval workflows, and schedule rollouts during fixed maintenance windows. During execution, live agent output streams directly to the browser over WebSocket so engineers can watch progress in real time or halt a problematic upgrade mid-flight. Beyond package updates, the platform runs OpenSCAP CIS benchmark and Docker Bench security assessments, inventories running containers and outdated base images, and routes host-down or threshold alerts to Slack, Discord, Microsoft Teams, ntfy, or email. Built-in browser SSH and Apache Guacamole RDP terminals let teams troubleshoot machines directly through the outbound agent tunnel with role-based access control and OIDC single sign-on. Running on a dedicated VPS on RepoCloud with guaranteed CPU, RAM, and SSD, full root SSH access, and a browser serial console. AGPL-3.0 licensed.
PG Back Web
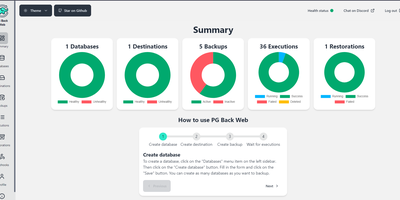
Automating PostgreSQL backup lifecycles across local volumes and S3-compatible object storage, PG Back Web gives database administrators and developers a self-hosted web console to schedule, encrypt, monitor, download, and restore database dumps without writing manual shell scripts. Instead of maintaining fragile crontab entries across individual database servers, you register PostgreSQL 13, 14, 15, 16, 17, or 18 instances in one dashboard and define recurring backup schedules with custom retention policies and timezone-aware timestamps. Each backup execution can target local directories or multiple S3 buckets across providers like AWS S3, MinIO, Backblaze B2, and Cloudflare R2, with built-in connection testing and presigned download links for rapid archive retrieval. To protect sensitive production records at rest and in transit, the platform applies PGP encryption to dump files while encrypting stored database connection strings and bucket credentials. Real-time execution logs record exact archive sizes, durations, and output streams, and the web interface lets operators trigger on-demand dumps, duplicate existing backup jobs, or run direct browser-based restorations when disaster recovery is required. Automated background health checks continuously verify connectivity to every registered PostgreSQL database and storage destination, firing configurable HTTP webhooks to Slack, Discord, or incident pipelines whenever a backup completes, fails, or changes health status. Running on a dedicated VPS on RepoCloud with guaranteed CPU, RAM, and SSD, full root SSH access, and a browser serial console. AGPL-3.0 licensed.
Circuit Breaker
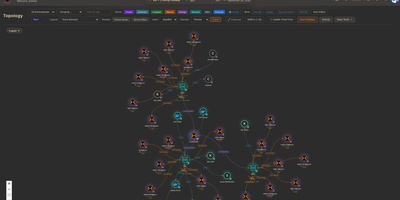
Mapping every physical server, virtual machine, container, and network link across a sprawling homelab into a live interactive canvas, Circuit Breaker gives infrastructure operators real-time topology visualization, IP address management, and rack elevation modeling on a single screen. Operators can switch between hierarchical, concentric, cortex ring, radial, and force-directed graph layouts where animated edges reflect link speeds and color-coded status rings display live hardware health. Automated discovery scans local subnets using nmap, SNMP, and ARP while querying Proxmox VE clusters, TrueNAS storage pools, and UniFi controllers, staging newly detected nodes in a review queue before adding them to the map. For multi-site labs or isolated VLANs, lightweight remote agents connect outbound over Noise-encrypted links after fingerprint approval to report host telemetry and run scoped network scans without opening inbound firewall ports. Rack diagrams let administrators drag servers into U slots with cabling overlays using a built-in catalog covering Dell, HPE, Supermicro, Ubiquiti, MikroTik, Synology, and APC gear alongside live iDRAC, iLO, and UPS metrics. Role-based access control, OIDC single sign-on, TOTP multi-factor authentication, encrypted full-state snapshots, and a SHA-256 hash-chained audit log keep multi-user operations accountable. Running on a dedicated VPS on RepoCloud with guaranteed CPU, RAM, and SSD, full root SSH access, and a browser serial console. MIT licensed.
Traceway
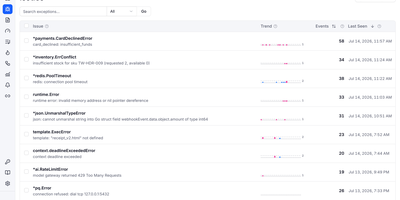
Production debugging slows to a crawl when logs, distributed traces, metrics, and session replays live in four disconnected dashboards, which is why Traceway consolidates every OpenTelemetry signal into a single self-hosted observability platform. Point any standard OTLP exporter directly at the ingestion endpoints without maintaining an intermediary collector or installing proprietary vendor SDKs. When an unhandled exception fires in production, automatic SHA-256 stack trace fingerprinting groups duplicates into prioritized issues complete with source-mapped frames and attached browser or Flutter session replays showing exact user clicks before the crash. Clicking any structured log entry jumps straight to its corresponding distributed span waterfall so engineers can trace slow database queries or failing downstream HTTP calls across microservices. Route performance bottlenecks surface immediately through per-endpoint P50, P95, and P99 latency percentiles ranked by Apdex and a five-factor impact score. Teams shipping AI features can also inspect LLM token consumption, model costs, tool calls, and multi-turn conversations grouped by customer identifier. Built-in on-call rotation schedules, escalation policies, and multi-channel alerts via Slack, Telegram, Pushover, email, and webhooks ensure incidents reach the right responder with one-click acknowledgment links. Running on a dedicated VPS on RepoCloud with guaranteed CPU, RAM, and SSD, full root SSH access, and a browser serial console. MIT licensed.
FeatBit
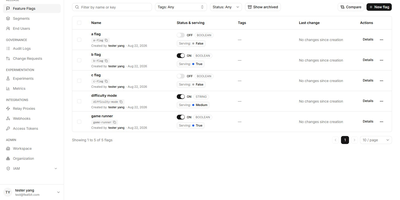
Engineering and product teams ship code to production daily with FeatBit, an enterprise feature flag and experimentation platform that controls exactly which user segments, regions, or percentage rollouts see each new capability. When a regression appears in production, operators toggle an instant kill switch, dial back canary weights from full traffic to one percent, or restrict access to internal QA accounts without redeploying containers. Reusable user segments group customers by subscription tier, device property, or custom attributes for consistent targeting across environments. Server-side and client-side SDKs for .NET, Java, Go, Python, Node.js, React, React Native, JavaScript, and OpenFeature synchronize flag states over WebSockets in under 100 milliseconds and evaluate rules locally in memory. Built-in A/B/n experimentation links flag variations to custom conversion events, click tracking, and pageview metrics so teams can validate product hypotheses with live telemetry. Scheduled rollouts, multi-step approval workflows, flag triggers, and webhook integrations with Slack, Datadog, Grafana, New Relic, and OpenTelemetry keep release operations auditable. Role-based access control and single sign-on govern every flag change. Running on a dedicated VPS on RepoCloud with guaranteed CPU, RAM, and SSD, full root SSH access, and a browser serial console. MIT licensed.
Borg UI
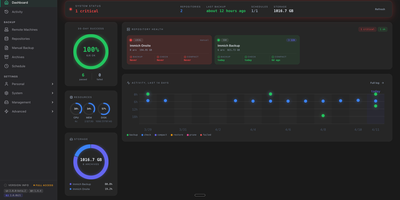
Borg UI is a self-hosted web management interface for BorgBackup that eliminates complex command-line syntax by organizing deduplicated backups, automated pruning schedules, and interactive file restorations into an intuitive graphical control center. System administrators connect local drives, remote SSH hosts, and SFTP endpoints to establish resilient storage repositories guarded by client-side encryption and cryptographic authentication. The centralized dashboard visualizes storage capacity, compression ratios, deduplication savings, and the health status of active backup jobs in real time. Configurable backup plans schedule automated cron jobs with granular retention rules, executing pre-backup database dumps and filesystem snapshots before running incremental syncs and background integrity checks. Users browse multi-version archive filesystems directly from the web browser, searching file trees and extracting individual files or entire folders without manual command line extraction. The platform orchestrates remote fleet backups by deploying SSH keys across client machines, tracking connection health, and executing non-disruptive background operations. Comprehensive alert routing dispatches real-time job status notifications, failure warnings, and storage alerts across Discord, Telegram, Slack, and email using integrated multi-channel messaging services. Running on a dedicated VPS on RepoCloud with guaranteed CPU, RAM, and SSD, full root SSH access, and a browser serial console. GNU AGPLv3 licensed.
Cronmaster
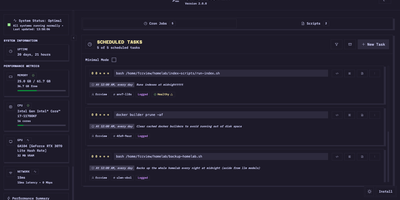
Silent background task failures and scattered crontab files across Linux hosts make routine maintenance risky, which Cronmaster solves with a visual scheduling dashboard and live execution log viewer. Five-field cron expressions translate automatically into plain English alongside one-click schedule presets. Operators can create, comment, clone, pause, or delete scheduled jobs across single or multiple Linux users in seconds. A built-in script manager lets you write, duplicate, and organize reusable Bash scripts from starter templates right inside the browser. Turning on per-job execution logging wraps commands automatically to record standard output, standard error, start and finish timestamps, duration, and exit codes. Log retention policies keep disk usage bounded automatically. Long-running tasks stream their console output live over Server-Sent Events, and any job can be triggered on demand with a single click. Across the top of the workspace, real-time hardware telemetry cards report system uptime, CPU load, memory consumption, network throughput, and GPU utilization. Administrators can protect the interface with local password authentication, OpenID Connect single sign-on with group and role rules, or Bearer API keys for the full REST API. Running on a dedicated VPS on RepoCloud with guaranteed CPU, RAM, and SSD, full root SSH access, and a browser serial console. AGPL-3.0 licensed.
Radar
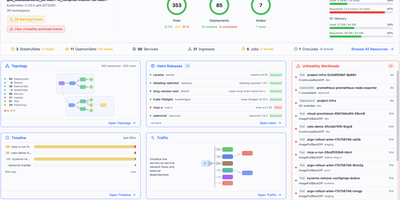
Radar is an open-source Kubernetes management dashboard and Model Context Protocol server that gives engineering teams complete cluster visibility, automated issue diagnosis, and GitOps controls through a unified web interface. Operators explore live interactive cluster topology maps rendered with automated layout engines, grouping workloads by namespace or custom application labels to trace network communication pathways. The unified event timeline retains Kubernetes activity and state change diffs well beyond default one-hour limits, allowing site reliability engineers to diagnose historical CrashLoopBackOff states and investigate failed deployment rollouts. Teams manage Helm releases by inspecting deployed values, comparing manifest revisions side by side, and initiating rollbacks or upgrades with a single click. The built-in GitOps workspace correlates ArgoCD and Flux applications, surfacing synchronization health, field-level configuration drifts, and automated remediation suggestions. Developers inspect container image filesystems directly from pod detail panels without pulling images locally or establishing interactive terminal sessions, browsing permissions and downloading specific files. Native Model Context Protocol endpoints expose cluster telemetry and operational tools to artificial intelligence coding assistants, enabling external agents to diagnose failing pods and inspect access controls securely. Running on a dedicated VPS on RepoCloud with guaranteed CPU, RAM, and SSD, full root SSH access, and a browser serial console. Apache 2.0 licensed.
DBackup
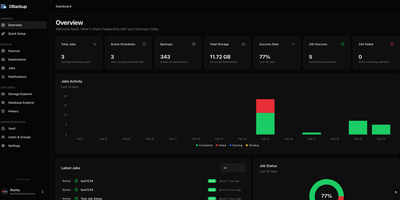
When a bad migration or disk failure strikes at 3 AM, DBackup guarantees that your PostgreSQL, MySQL, MariaDB, MongoDB, SQL Server, Redis, Valkey, SQLite, and Firebird databases, along with the application directories that belong to them, are encrypted, verified, and ready to restore in a few clicks. Connect directly over TCP or tunnel through SSH with zero agents installed on your target servers. Bundle database dumps and Docker volumes or remote SFTP directories into a single atomic job so your schema and uploaded assets always share the exact same recovery point. Every archive is compressed with Brotli or GZIP, sealed with AES-256-GCM encryption before leaving the host, and pushed simultaneously to up to 14 storage backends including Amazon S3, Cloudflare R2, Hetzner, Google Drive, Dropbox, OneDrive, SMB, and WebDAV. Reusable Grandfather-Father-Son retention policies prune daily, weekly, monthly, and yearly snapshots automatically. Need to inspect live tables or recover a single file? Use the built-in Database Explorer, remap a dump into a staging schema, or extract individual files over HTTP byte ranges without downloading the entire archive. Even if your backup server goes offline, the downloadable Recovery Kit decrypts standard SQL dumps and plain TAR archives using a standalone script. Running on a dedicated VPS on RepoCloud with guaranteed CPU, RAM, and SSD, full root SSH access, and a browser serial console. GPL-3.0 licensed.
Warpgate
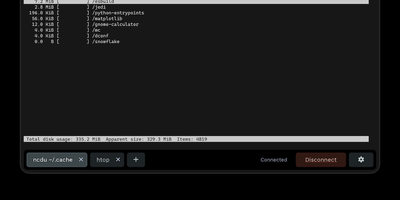
Warpgate is a clientless bastion host and privileged access management gateway that lets engineering teams secure, assign, and audit access to internal SSH servers, databases, Kubernetes clusters, web applications, and remote desktops from a single portal without installing VPN clients. Connect directly from standard tools like OpenSSH, VS Code Remote, psql, mysql, kubectl, or native RDP clients using formatted credentials, or launch browser-based SSH terminals, RDP desktops, and VNC sessions straight from the web interface. Administrators map users and roles to specific internal targets with granular 1:1 permissions, enforcing multi-factor authentication via TOTP and Single Sign-On through OpenID Connect providers like Google Workspace, Microsoft Entra ID, and Okta with automatic group-to-role provisioning. Every interactive terminal command, database query, HTTP request, and remote desktop session is captured in real time so security auditors can watch active connections live or replay historical recordings on demand from the web dashboard. Built-in brute-force defense automatically blocks suspicious IP addresses and locks compromised accounts, while temporary access tickets, just-in-time session approvals, encrypted credential storage, and S3-compatible recording archival support enterprise compliance workflows across multi-node clusters. Running on a dedicated VPS on RepoCloud with guaranteed CPU, RAM, and SSD, full root SSH access, and a browser serial console. Apache-2.0 licensed.
Domain Locker
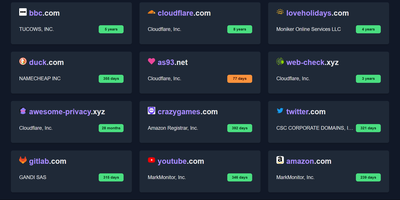
Domain Locker provides an all-in-one domain portfolio dashboard that consolidates expiration tracking, DNS records, and infrastructure health across every registrar you use. Add your domains to automatically harvest registration dates, name servers, SSL validity windows, IP allocations, and subdomains without manual data entry. Customizable notification rules broadcast renewal warnings and configuration change alerts through webhooks, email, Telegram, Slack, or WhatsApp before services experience unintended downtime. Interactive timeline views map renewal deadlines and calculate historical acquisition costs against annual operating expenses to clarify portfolio valuations. Built-in monitoring tools ping endpoints to record response latencies, HTTP status codes, and server availability metrics for every registered address. Audit logs preserve historical snapshots of DNS modifications, WHOIS adjustments, and registrar migrations to simplify infrastructure troubleshooting across teams. Integrated tags and resource associations organize personal blogs, client projects, and staging environments into isolated workspaces with role-based permissions and two-factor authentication. Running on a dedicated VPS on RepoCloud with guaranteed CPU, RAM, and SSD, full root SSH access, and a browser serial console. MIT licensed.
Quantum
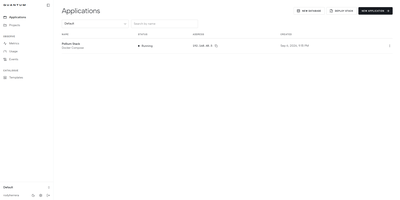
From a bare Linux server, Quantum builds and runs GitHub repositories, multi-service Docker Compose stacks, and managed databases through a self-hosted PaaS dashboard with automated webhook deployments and live container telemetry. Connect a GitHub account, pick a branch, and let the build engine compile from a Dockerfile or custom install, build, and start commands on every git push or release tag. Multi-service Compose files can be pulled from a repository or pasted into the editor, with automatic `${VAR}` placeholder detection and isolated internal networks so containers communicate by service name. Provision PostgreSQL, MySQL, MariaDB, MongoDB, and Redis instances with one-click backups, or deploy pre-configured templates for n8n, Directus, WordPress, Uptime Kuma, and Ollama. Live log streams, an interactive browser terminal, `.env` secret management, persistent volume mounts, and private registry credentials come built into every service view. Need to patch a file quickly? Clicking Open in VS Code launches a sidecar `code-server` instance mounted directly to the container filesystem. Organization and project roles enforce granular access while real-time CPU, memory, and network charts track health across 15-minute to 24-hour windows. Running on a dedicated VPS on RepoCloud with guaranteed CPU, RAM, and SSD, full root SSH access, and a browser serial console. MIT licensed.
Bex
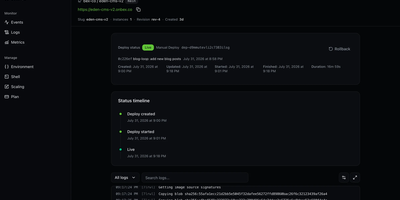
To give engineering teams a Render-style workflow of connecting a repository and getting a live HTTPS URL on infrastructure they control, Bex builds and runs web services, private services, background workers, cron jobs, and static sites from Git or container images. Dockerfiles and native builds for Node.js, Python, Go, Ruby, Rust, and Elixir deploy from public or private GitHub repositories with push-to-deploy, health checks, pre-deploy commands, and manual or policy-driven autoscaling. Blueprints in render.yaml format describe multi-resource environments in one file, and a Render-compatible CLI and API let existing tooling carry over where supported. Deploy history with cancel and rollback, live log tailing with search and filters, CPU and memory charts marked with deploy events, and suspend, resume, restart, native SSH, and browser shell controls cover daily operations. Custom domains receive automatic TLS certificates, and environment variables and secret files save and deploy in one step. Managed PostgreSQL provides backups with point-in-time recovery, high availability, and read replicas, and managed Valkey-compatible Key Value adds persistence and backups. Workspaces, projects, and environments come with OpenFGA roles, OAuth 2.1, API keys, audit logs, and signed outbound webhooks. Coding agents operate the same control plane through a remote or stdio MCP server with OAuth consent, deploy-from-chat, managed sandboxes, and structured machine-readable status, since no action is dashboard-only. Running on a dedicated VPS on RepoCloud with guaranteed CPU, RAM, and SSD, full root SSH access, and a browser serial console. Apache-2.0 licensed.
ZaneOps
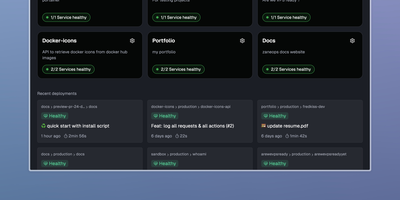
Shipping a Git repository to a live HTTPS URL takes one dashboard and one server with ZaneOps, an open-source alternative to Heroku, Railway, and Render. Linked GitHub or GitLab repositories build with a Dockerfile, Nixpacks, Railpack, or a static directory builder. Deploys start by hand, on git push, or from a CI webhook. Blue/green releases keep the previous version serving traffic while the new one starts. Each pull request or merge request can open its own preview environment, and the API can create one on demand. Configuration edits queue up as changes that you review before a new version deploys. A pasted docker-compose.yml or a ready-made template (Postgres, Redis, WordPress) deploys a whole stack with blue/green rollouts. Every domain gets a free SSL certificate that renews itself. Wildcard hosts, permanent or temporary redirects, and several services under one domain all work. Runtime logs, request logs, metrics, and health checks gather in the dashboard. Services get CPU and memory limits and volumes, and environment variables import or export as .env files. Viewer, Member, Admin, and Owner roles decide who can see and change what; the free tier allows one workspace and three users. A web terminal opens a shell inside any running deployment, and a second one reaches the server itself over SSH. Running on a dedicated VPS on RepoCloud with guaranteed CPU, RAM, and SSD, full root SSH access, and a browser serial console. MIT licensed.
What's Up Docker
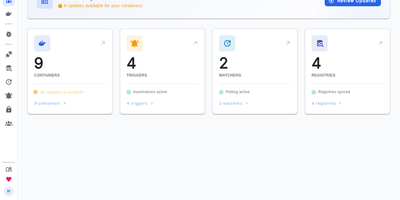
Does your container fleet silently fall behind on upstream patches until a critical vulnerability advisory forces an emergency audit? What's Up Docker continuously watches standalone Docker daemons, Compose stacks, Swarm services, Kubernetes workloads, and Nomad jobs to detect new image tags across public and private registries before sending alerts or rolling out updates automatically. Watchers connect over local sockets, TLS-secured TCP endpoints, kubeconfigs, or Nomad APIs to inventory active workloads without invasive sidecars. From there, registry connectors authenticate against Docker Hub, GitHub Container Registry, AWS ECR, Google Artifact Registry, Azure Container Registry, Quay, GitLab, Gitea, Forgejo, and self-hosted OCI registries to compare digests and tags. Flexible filtering rules let you restrict alerts to major, minor, or patch semantic version increments, match custom regular expressions, or pin specific tag patterns per container label. Once an eligible release appears, over thirty built-in triggers can dispatch notifications to Discord, Slack, Telegram, Matrix, Mattermost, Gotify, Ntfy, Pushover, Apprise, PagerDuty, or SMTP, publish events to MQTT, Kafka, RabbitMQ, or NATS, or recreate containers directly on demand. A responsive web dashboard and REST API provide manual update controls, OpenID Connect single sign-on with role-based access control, and Prometheus metrics for Grafana observability. Running on a dedicated VPS on RepoCloud with guaranteed CPU, RAM, and SSD, full root SSH access, and a browser serial console. MIT licensed.
Termix
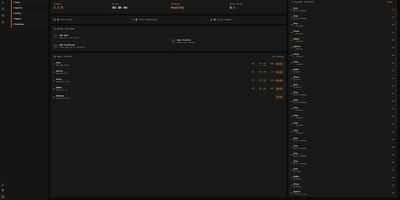
Termix delivers a unified, self-hosted infrastructure control center that consolidates SSH terminals, remote desktop streaming, and fleet automation into an intuitive browser workspace that replaces proprietary tools like Termius. Administrators connect to Linux servers and desktop environments using embedded RDP, VNC, and Telnet protocols powered by Apache Guacamole without requiring local client installations. The multi-panel terminal interface supports four-way split screens, allowing operators to broadcast keystrokes simultaneously across multiple production hosts or execute saved reusable script snippets with dynamic parameters. Real-time multiplayer session sharing lets engineers invite teammates via secure, time-limited links with configurable read-only or collaborative write permissions for troubleshooting incidents. Advanced networking layers handle SSH jump hosts, SOCKS5 proxy chains, Warpgate relays, and port knocking sequences to access segmented private networks securely. Integrated SFTP file managers provide drag-and-drop file transfers with editable path bars, inline text editing, and folder synchronization across remote machines. Background telemetry monitors CPU loads, memory utilization, disk IOPS, and container statuses, while built-in session recording captures complete terminal sessions for compliance auditing. Running on a dedicated VPS on RepoCloud with guaranteed CPU, RAM, and SSD, full root SSH access, and a browser serial console. Apache 2.0 licensed.
Calagopus
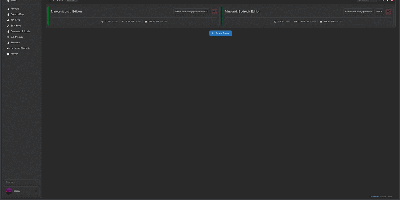
When hosting multiplayer game servers for communities or friends requires container isolation and low-overhead administration, Calagopus steps in as a modern game server management panel. Server operators use it to deploy and control Minecraft, Rust, ARK, Valheim, FiveM, and any other Linux containerized workload while reusing existing Pterodactyl and Pelican eggs without modification. From the live WebSocket console, administrators monitor real-time CPU, memory, and network graphs, autocomplete saved command snippets, inspect per-layer Docker image pull progress bars, and pop the terminal out into a secondary window. Managing configuration files and modpacks happens directly in the browser through a split-pane tabbed editor featuring real-time collaborative editing, side-by-side revision diffs with one-click rollback, a visual disk usage treemap, in-place archive browsing, and VS Code workspace mounting. Database workflows are equally streamlined: you can provision MySQL, PostgreSQL, MongoDB, or Redis instances, browse and edit rows or SQLite files in a built-in data explorer, and run read-only or writable SQL queries without external database clients. Automated schedules support conditional if-else branching, regex variable extraction from console output, crash-detection triggers, and eight backup storage drivers including S3, Restic, Kopia, ZFS, Btrfs, and Proxmox Backup Server. Running on a dedicated VPS on RepoCloud with guaranteed CPU, RAM, and SSD, full root SSH access, and a browser serial console. MIT licensed.