Categories
devops observability monitoring opentelemetry apm log-management error-tracking session-replayStars
Forks
Watchers
Developer links
Traceway
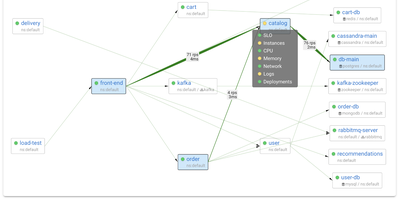
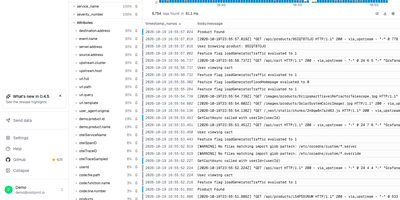
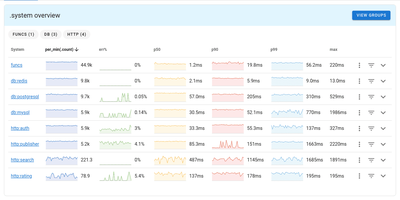
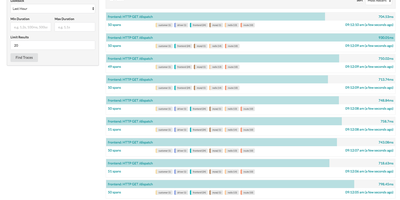
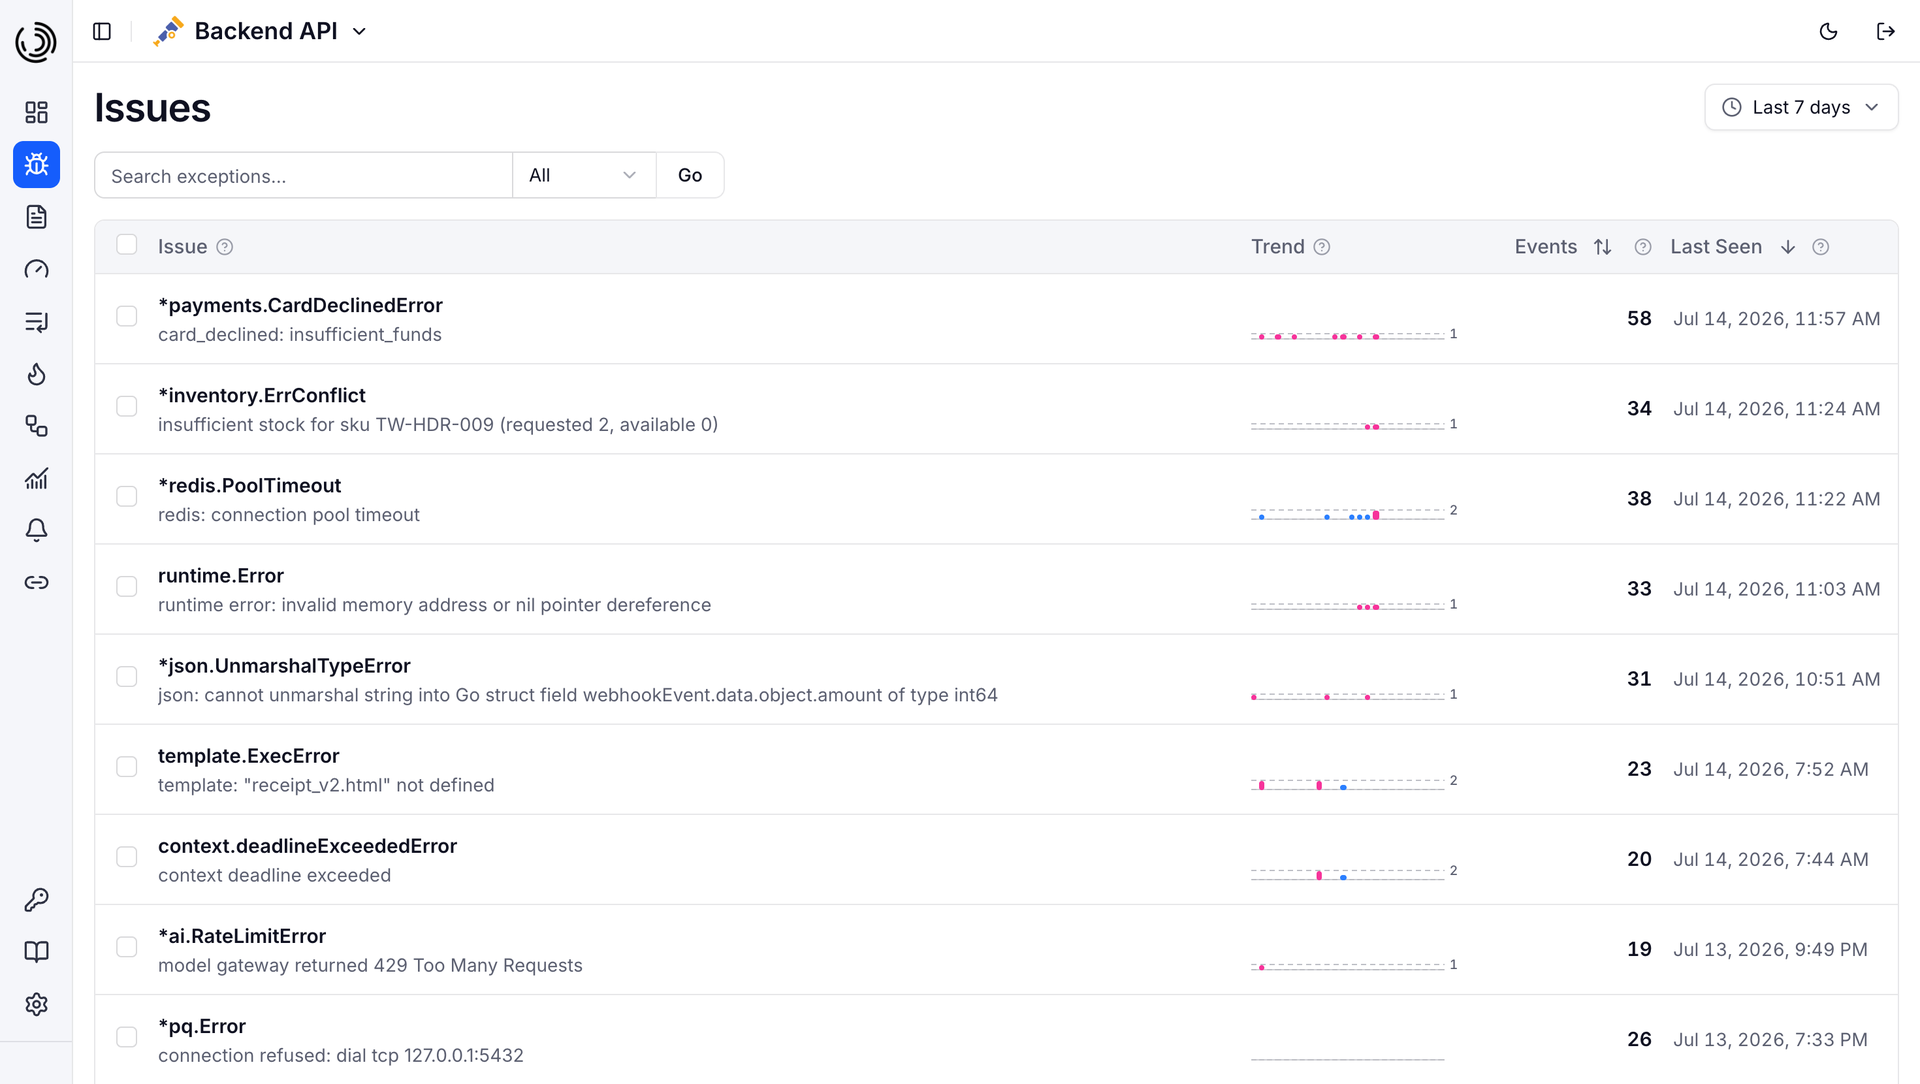
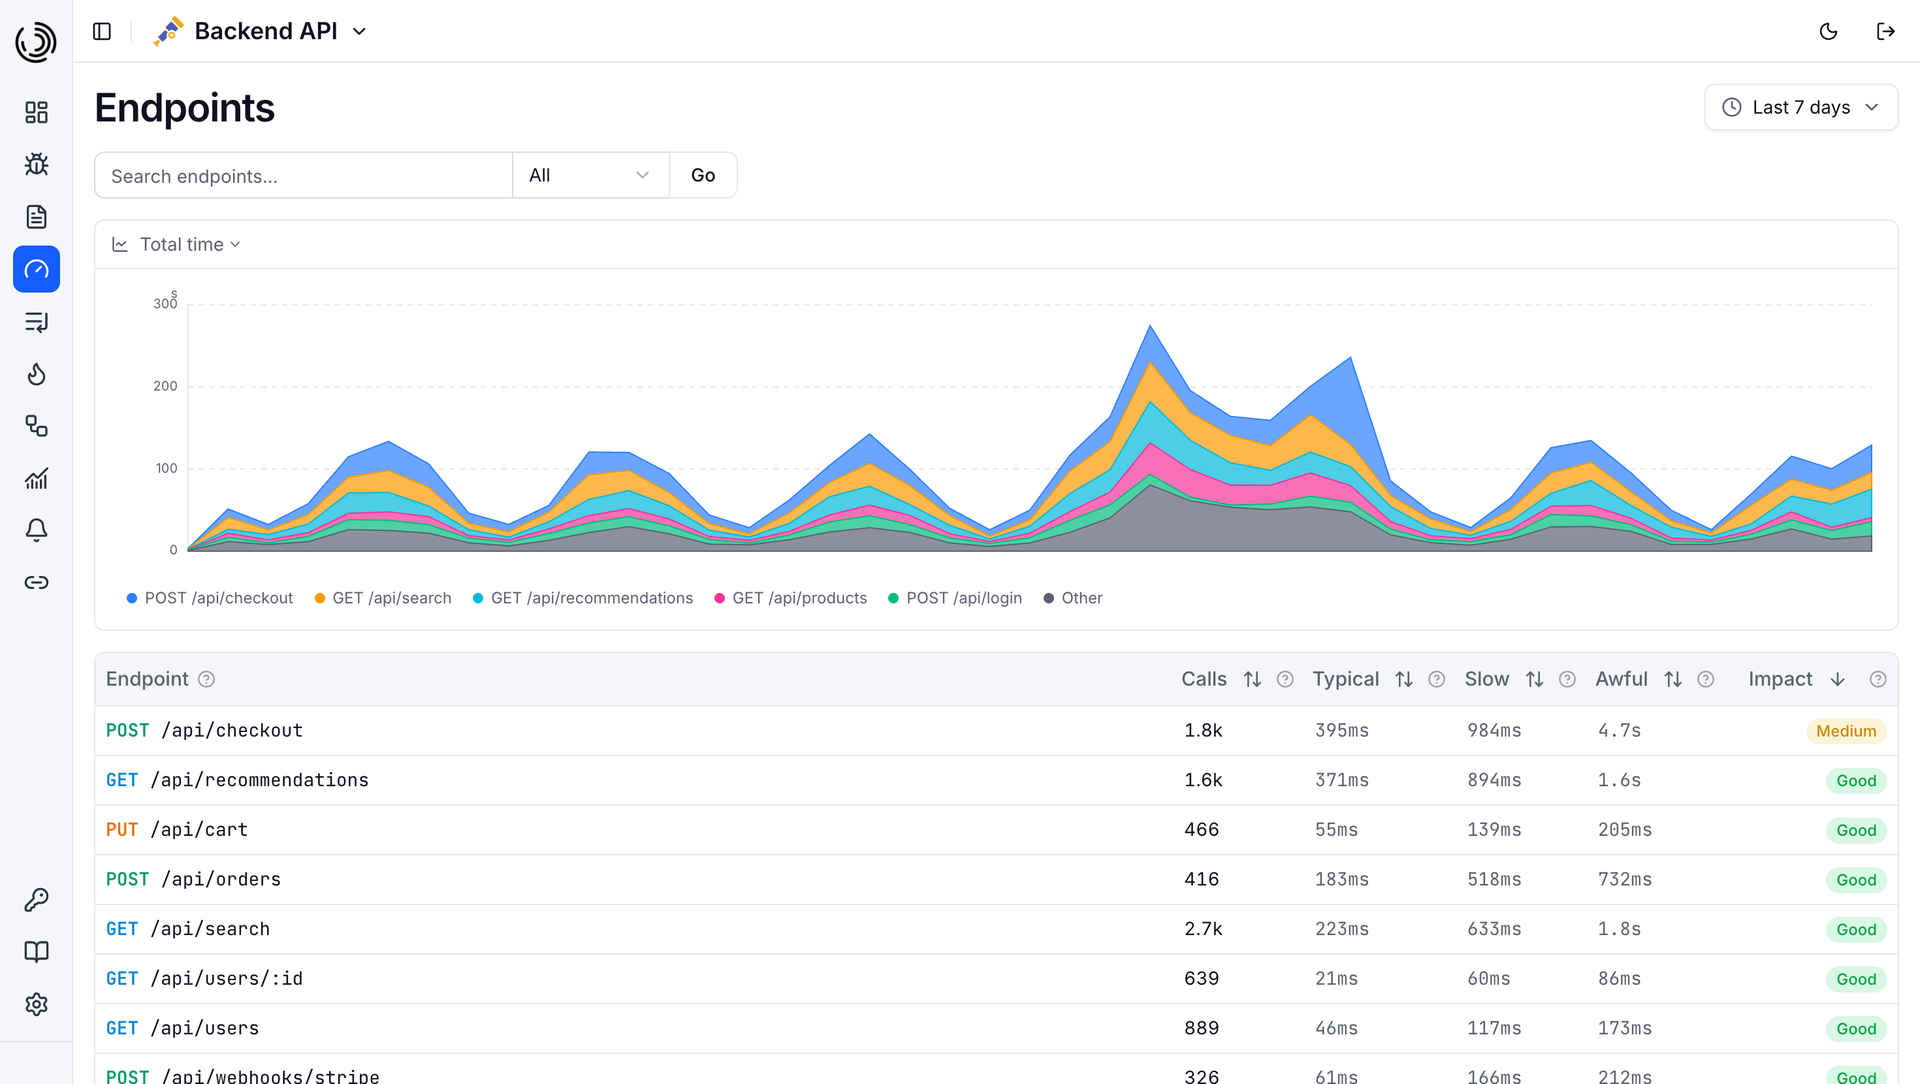
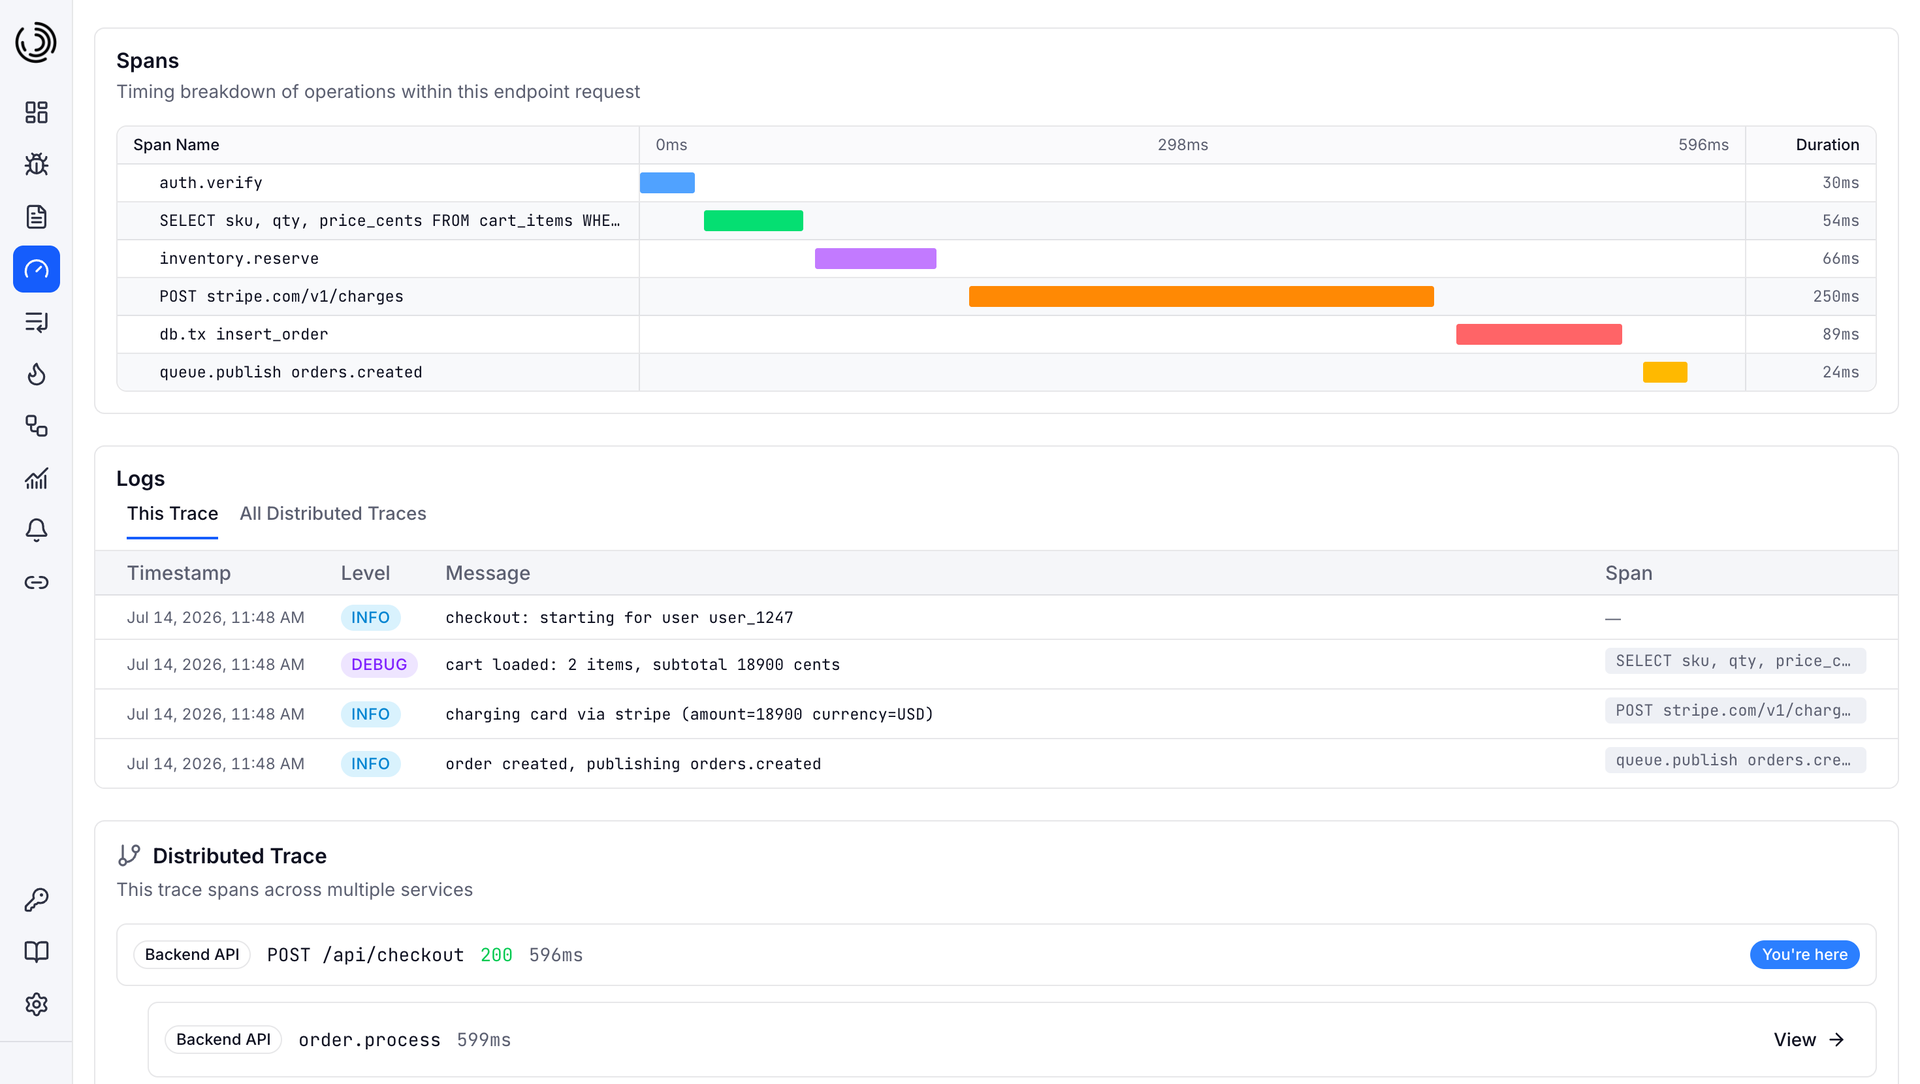
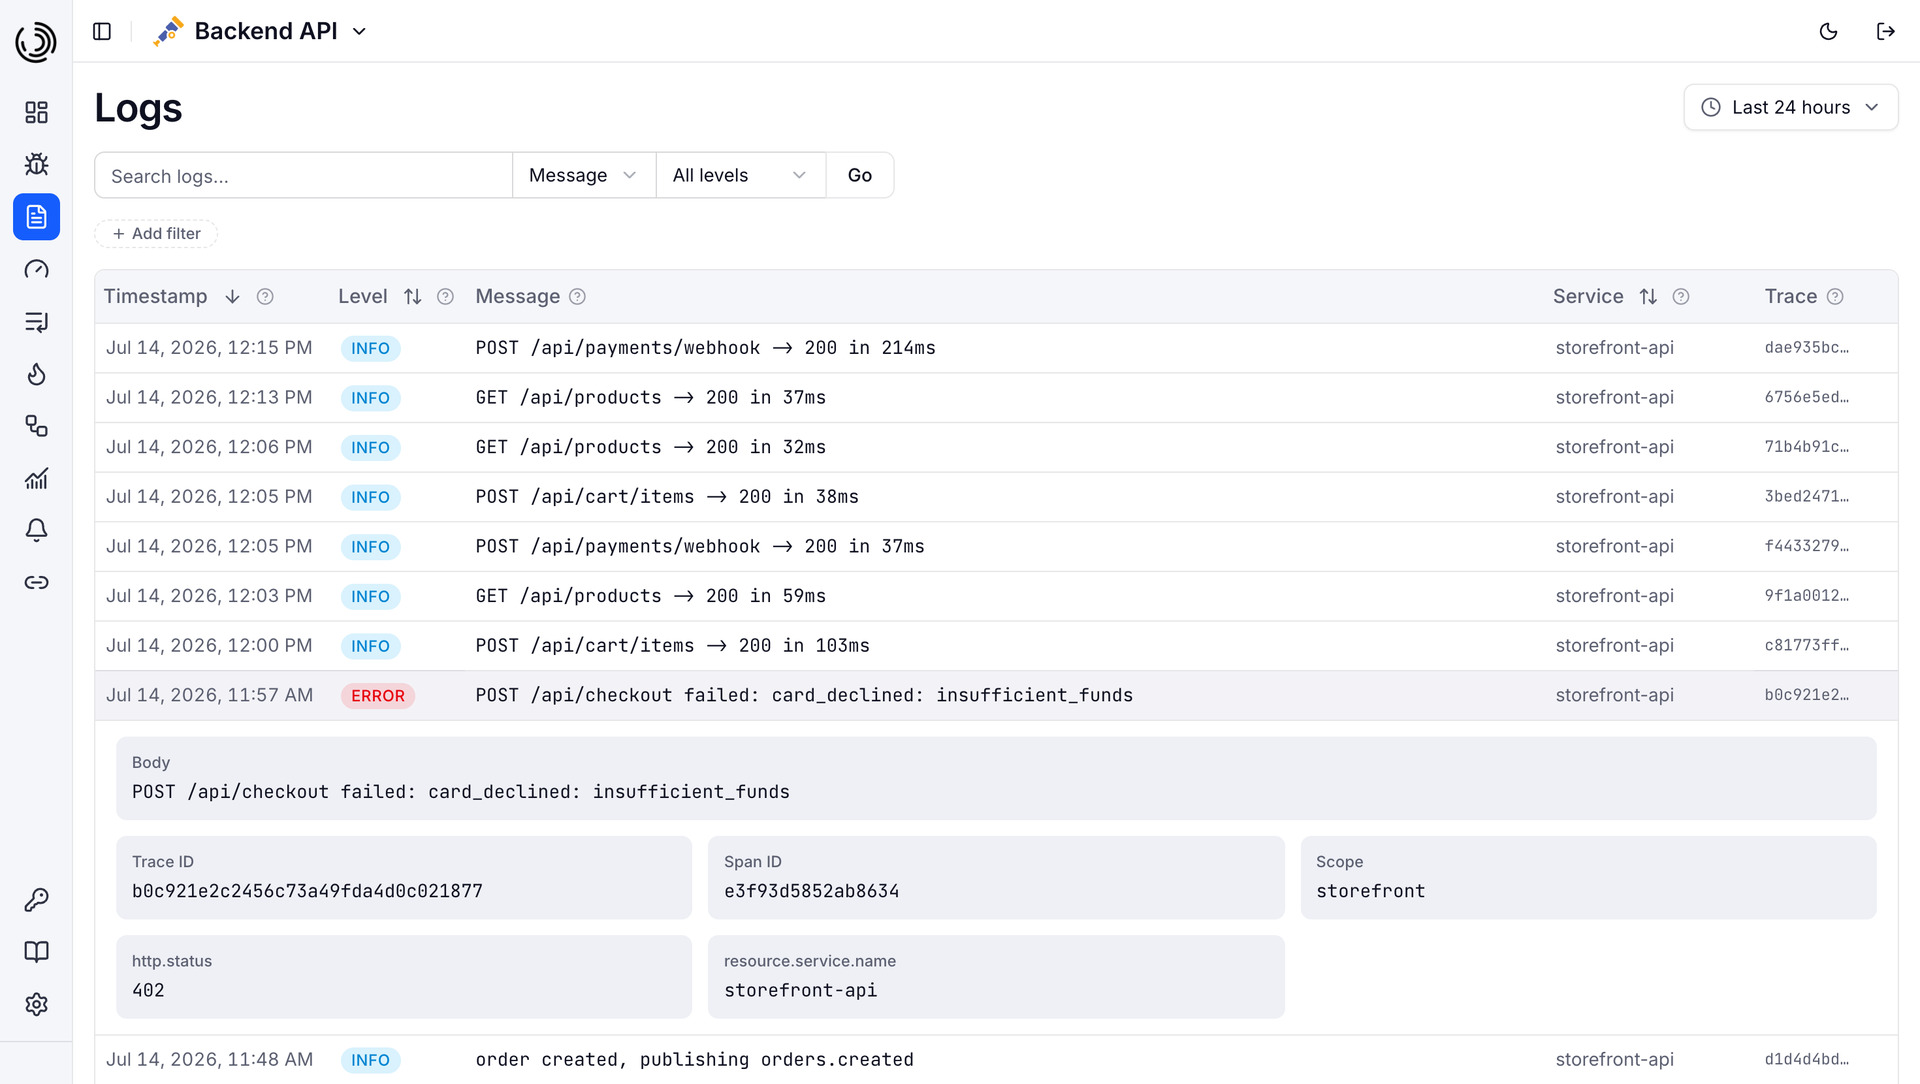
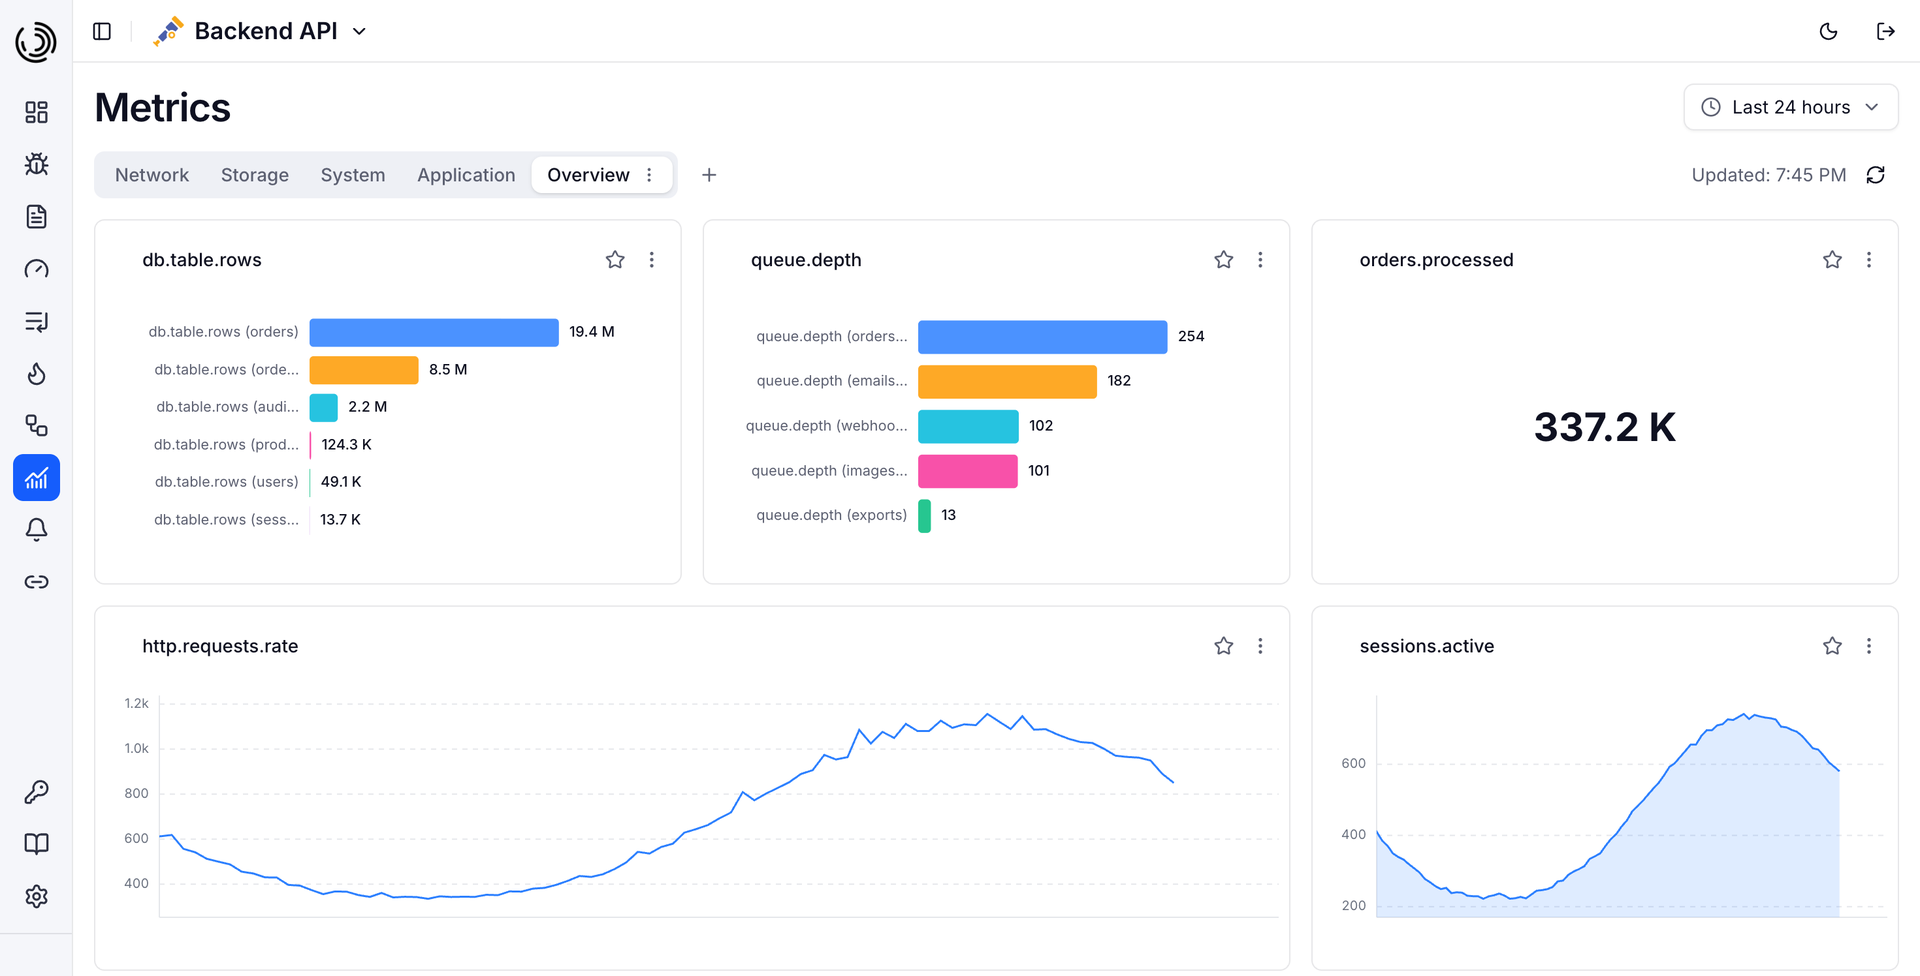
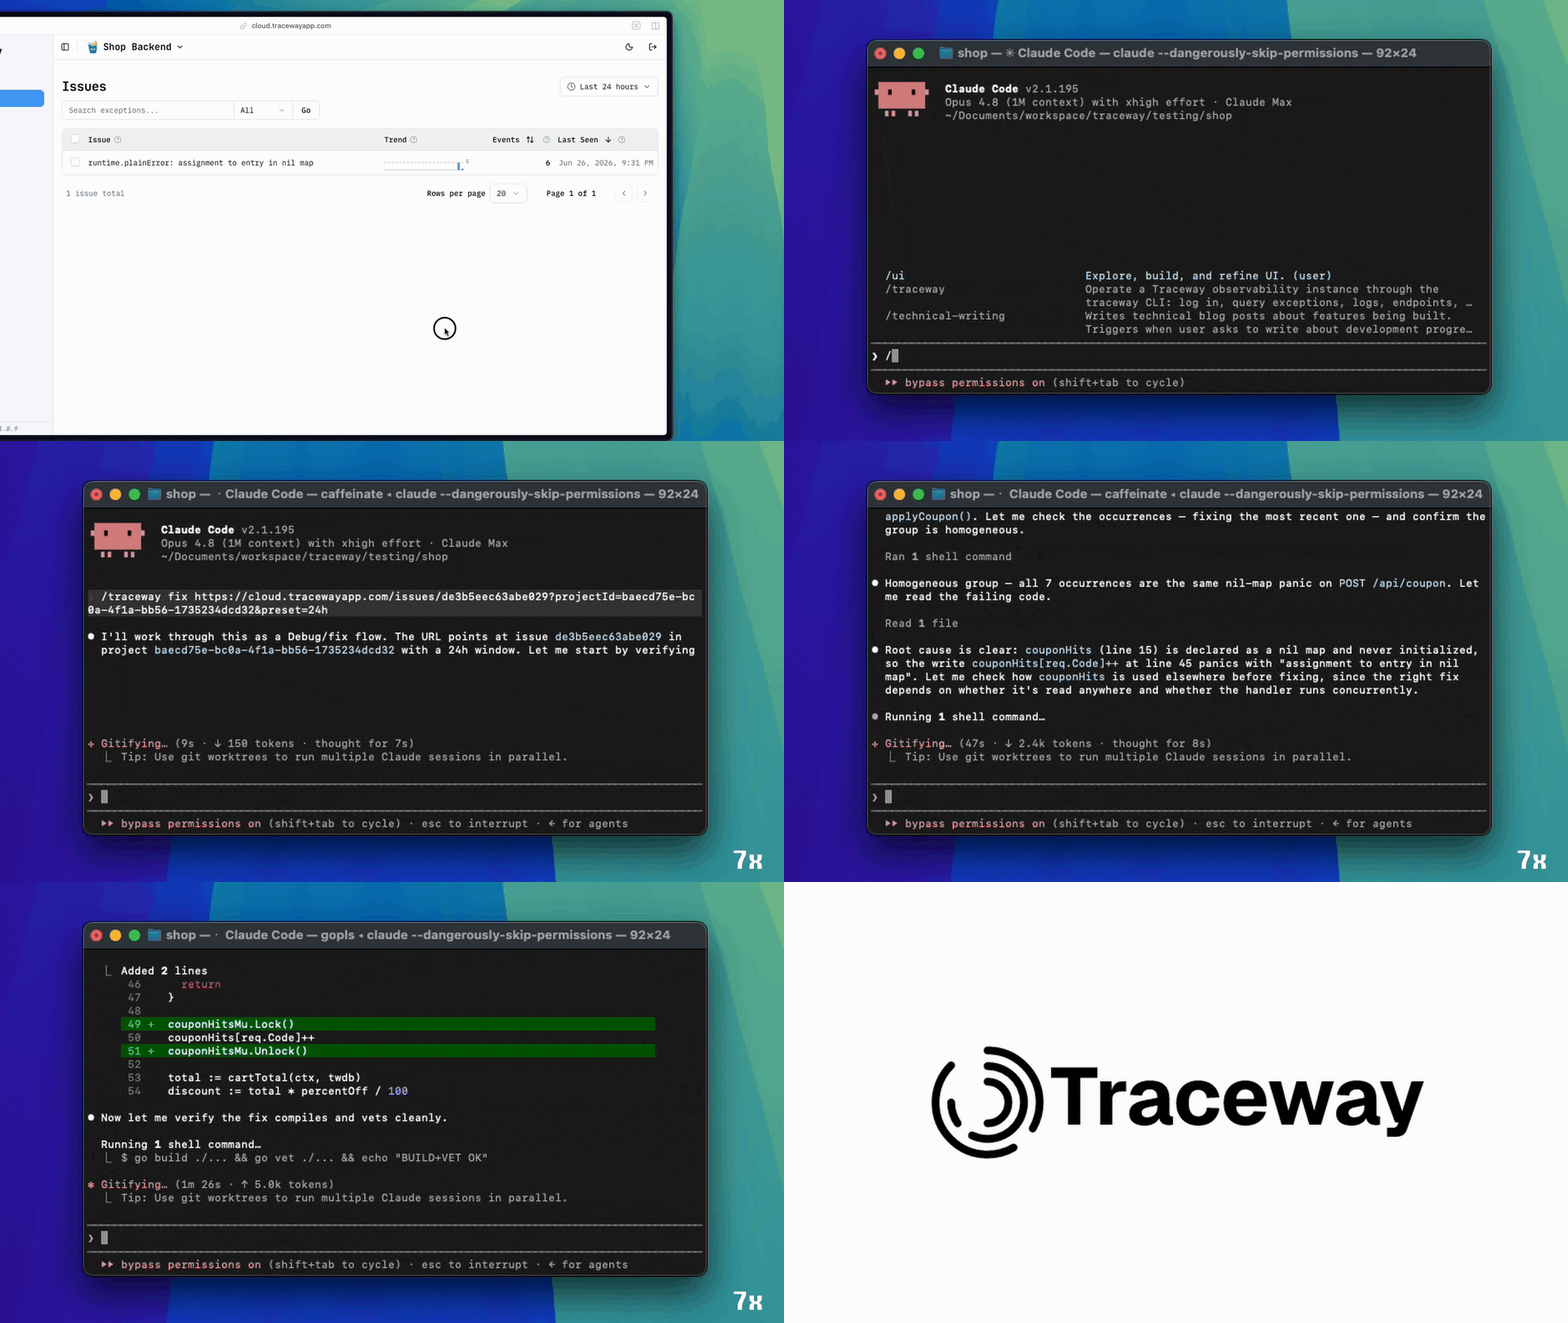
Production debugging slows to a crawl when logs, distributed traces, metrics, and session replays live in four disconnected dashboards, which is why Traceway consolidates every OpenTelemetry signal into a single self-hosted observability platform. Point any standard OTLP exporter directly at the ingestion endpoints without maintaining an intermediary collector or installing proprietary vendor SDKs. When an unhandled exception fires in production, automatic SHA-256 stack trace fingerprinting groups duplicates into prioritized issues complete with source-mapped frames and attached browser or Flutter session replays showing exact user clicks before the crash. Clicking any structured log entry jumps straight to its corresponding distributed span waterfall so engineers can trace slow database queries or failing downstream HTTP calls across microservices. Route performance bottlenecks surface immediately through per-endpoint P50, P95, and P99 latency percentiles ranked by Apdex and a five-factor impact score. Teams shipping AI features can also inspect LLM token consumption, model costs, tool calls, and multi-turn conversations grouped by customer identifier. Built-in on-call rotation schedules, escalation policies, and multi-channel alerts via Slack, Telegram, Pushover, email, and webhooks ensure incidents reach the right responder with one-click acknowledgment links. Running on a dedicated VPS on RepoCloud with guaranteed CPU, RAM, and SSD, full root SSH access, and a browser serial console. MIT licensed.
Benefits
- Direct OpenTelemetry Ingestion Without Collectors
- Accepts standard OTLP over HTTP requests for traces, metrics, and structured logs directly from any OpenTelemetry SDK, removing the operational overhead of deploying external collector pipelines.
- Correlated Logs Traces And Session Replays
- Links every structured log line, exception stack trace, and DOM session recording to its exact distributed trace ID so engineers diagnose root causes without switching tools.
- Flexible ClickHouse Or Embedded DuckDB Storage
- Supports full production deployments backed by ClickHouse and PostgreSQL alongside zero-dependency single-container modes using embedded DuckDB or SQLite storage with local or S3-compatible blob retention.
- Integrated On-Call Rotations And Alerting
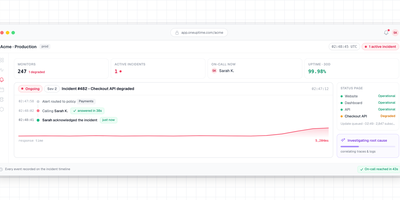
- Replaces separate paging subscriptions with built-in rotation layers, overrides, escalation policies, and one-click incident acknowledgments delivered across Slack, Telegram, Pushover, SMS, email, and GitHub issues.
Features
- Distributed Span Waterfalls
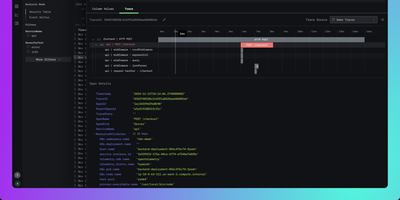
- Visualizes cross-service request execution timelines with sub-second OTLP span search, trace-linked structured logs, and direct navigation from error events to offending spans.
- Endpoint Impact Scoring
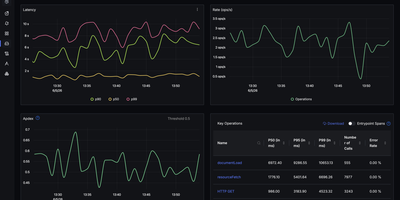
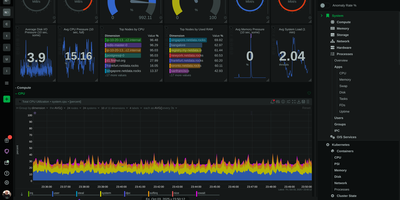
- Tracks per-route P50, P95, and P99 latency percentiles, throughput, and error rates ranked automatically by Apdex and a five-factor service impact score.
- Symbolicated Exception Grouping
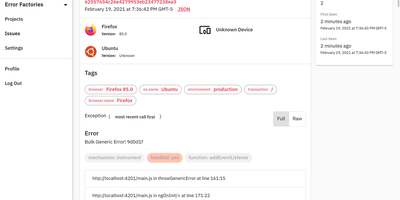
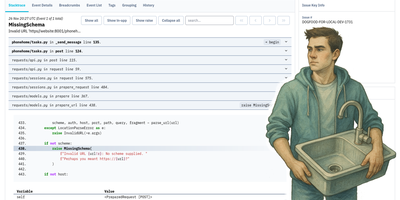
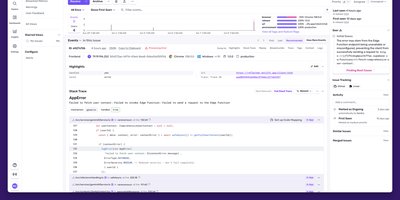
- Normalizes stack traces with SHA-256 fingerprinting and resolves minified JavaScript, TypeScript, Flutter, iOS dSYM, and Android R8 frames via uploaded source maps.
- Web And Flutter Session Replay
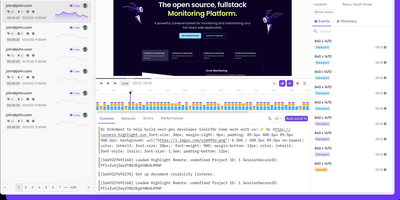
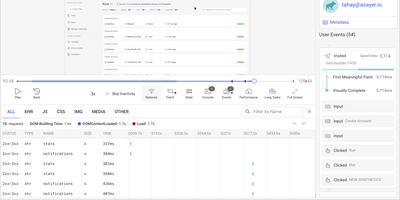
- Captures privacy-aware DOM recordings and Flutter mobile interactions immediately preceding an unhandled exception so developers can watch the exact reproduction steps.
- LLM And AI Observability
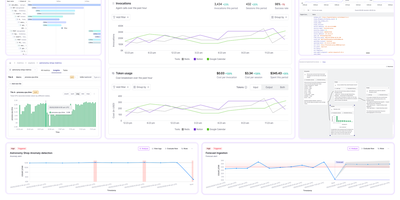
- Monitors generative AI latency, token usage, per-customer costs, tool invocations, and full multi-turn conversations across OpenRouter and OpenTelemetry-compatible LLM gateways.
- Continuous CPU And Heap Profiling
- Ingests native Go pprof and OTLP profiles to render interactive flame graphs for CPU, memory heap, and goroutines with version-to-version diffing.