LogForge
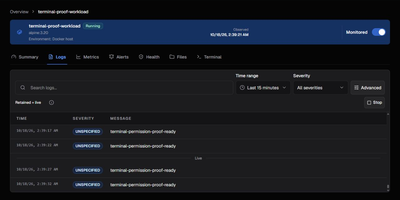
LogForge puts container logs, metrics, events, alerts, and guarded fixes behind one self-hosted web UI for Docker. The overview gathers container health, status, logs, metrics, Docker events, and file access for its host, so a sick container gets inspected without juggling docker commands across terminals. Logs stream in real time, interactive terminals open into running containers, and collected logs, metrics, and events are stored for later review and trend checks. Alert rules watch logs, metrics, and container events, and one-click templates cover stability, performance, log, and security signals. Fired rules notify through Email, Slack, Teams, Discord, Telegram, Gotify, or webhooks, and alert history records acknowledgements plus delivery attempts. A rule can also act: restart, stop, start, kill, or run a script, throttled by cooldowns, rate limits, backoff, and verification delays so automation cannot thrash a host. Other Docker hosts join through mTLS-protected agent enrollment, letting one console watch a small fleet. Running on a dedicated VPS on RepoCloud with guaranteed CPU, RAM, and SSD, full root SSH access, and a browser serial console. Apache-2.0 licensed.
Better Status Page
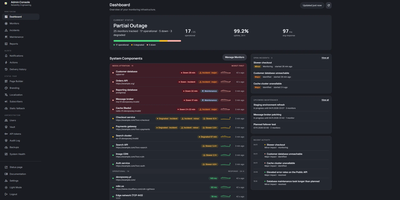
Better Status Page watches your services around the clock and turns outages into calm, branded status updates for your users instead of a flood of support tickets. Its monitors probe HTTPS endpoints with authentication flows and TLS expiry warnings, ping and TCP ports, DNS records, Docker containers, mail servers over SMTP, IMAP, and POP3, and databases from PostgreSQL and MySQL to Redis, MongoDB, SQL Server, and Oracle. A slower-than-usual alert fires when a monitor's p95 response time climbs against its own last seven days, and passive webhook heartbeats catch jobs that simply stop checking in. Alerts reach the team through email, Slack, Discord, Microsoft Teams, Telegram, ntfy, Pushover, webhooks, and Twilio SMS or voice calls, with failure thresholds, quiet hours, rate caps, and grouping keeping the noise down. Incidents carry severity levels, public updates, linked monitors, and recurring maintenance windows, and subscribers follow along by email, webhook, RSS or Atom feed, or a JSON status API. A drag-and-drop builder restyles the public page with your branding, dark mode, and translations, a static fallback keeps the page readable if the server itself falls over, and uptime reports export to CSV for SLA reviews. Running on a dedicated VPS on RepoCloud with guaranteed CPU, RAM, and SSD, full root SSH access, and a browser serial console. MIT licensed.
OpenClaw Dashboard
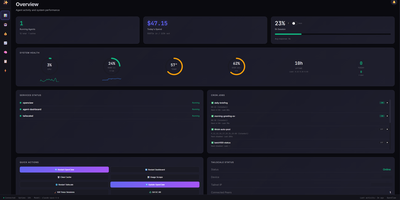
OpenClaw Dashboard is a secure real-time monitoring dashboard for OpenClaw AI agents that tracks live sessions, API costs, rate limits, and host health from one browser page. The overview refreshes every five seconds with live session activity, token totals, and lifetime spending, so you can see what every agent is doing right now. Cost views break spending down by model, session, and time period, and rate limit panels track Claude and Gemini usage against rolling windows with browser alerts before quotas run out. A live feed streams agent messages across all sessions, and a session browser adds search, status filters, timelines, and a 30 day activity heatmap. You can read agent memory files (MEMORY.md, HEARTBEAT.md, daily notes) and edit workspace files, skills, and configuration with JSON validation and automatic backups. Host panels report CPU, memory, disk, and temperature with 24 hour sparklines, plus Docker containers, cron jobs, real-time logs, and one-click service restarts. A security page shows firewall rules, open ports, fail2ban status, and SSH login history, and sign-in uses PBKDF2 hashed passwords with optional TOTP two-factor codes. Running on a dedicated VPS on RepoCloud with guaranteed CPU, RAM, and SSD, full root SSH access, and a browser serial console. MIT licensed.
Jarvis
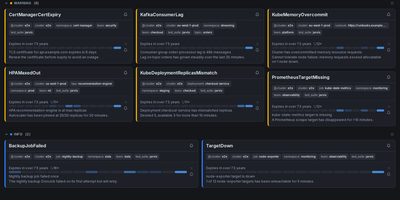
Alertmanager forgets an alert the moment it resolves; Jarvis remembers everything. This web frontend watches all your Alertmanager clusters at once and streams firing alerts into one live view over WebSocket, no refresh as problems appear or clear. Every alert's lifecycle is stored, so the resolved view answers how often something fired and how long it burned, and a grace period keeps a missed poll from being recorded as a phantom resolution. When an alert lands, claim it so the team sees who is on it, and leave comments bound to that alert fingerprint; notes survive restarts and re-fires, so the next person inherits the context. Silencing gets a rehearsal: preview exactly which alerts a silence will hit before creating it, fire a one-click Fast-Silence from the list, and save templates for recurring maintenance. Filters use the Alertmanager matchers you already know, save as named sets, ride in shareable URLs, and one can be your default view. Point Jarvis at every member of an HA gossip cluster and duplicates collapse by fingerprint, while protected upstreams authenticate with OAuth2, bearer tokens or basic auth per cluster. Sign-in is optional through built-in accounts or any OIDC provider, and it runs as one hardened container on port 8080, with PostgreSQL available when you want replicas. Keep it behind your VPN or an authenticating proxy, as its own docs insist. Running on a dedicated VPS on RepoCloud with guaranteed CPU, RAM, and SSD, full root SSH access, and a browser serial console. Apache-2.0 licensed.
Rackpad
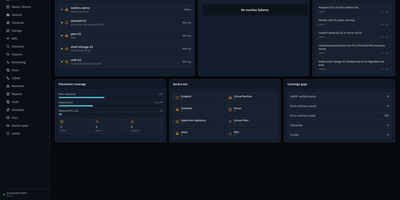
Every cable, switch port, VLAN, and rack unit in a homelab or small server room gets a documented place in Rackpad, a self-hosted inventory and operations workspace. Rack elevations show mounted gear, including paired half-width appliances. Switch-panel port maps and aggregate ports show what is patched where. Cables carry type, length, and color, editable in bulk. VLANs, subnets, DHCP scopes, reservations, and zones sit in one Networks workspace, with gateway and DNS protection and a mismatch review for IP assignments. Storage topology follows drives, bays, and pools that span several devices. Wi-Fi controllers, access points, hypervisor hosts, and virtual machines have pages of their own, and Proxmox and Hyper-V hosts can be imported after review. Discovery scans a subnet or any CIDR and stages every finding in an inbox. Per-device checks over ICMP, TCP, HTTP, HTTPS, and SNMP raise alerts by email, Discord, or Telegram. Everything feeds a movable topology map. Markdown runbooks attach to devices, and an audit log records every change. Admin, editor, and viewer roles control access, and OpenID Connect login is optional. Running on a dedicated VPS on RepoCloud with guaranteed CPU, RAM, and SSD, full root SSH access, and a browser serial console. MIT licensed.
OpenSRE
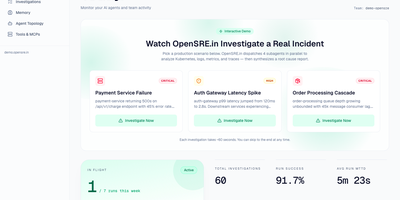
The pager fires at 3am, and OpenSRE starts the investigation before a human has found the dashboard password. It queries the connected observability and infrastructure tools, works toward a root cause, and records what the evidence supports. Past incidents stay useful because episodic memory stores root causes, alert types, affected services, and fixes, then surfaces the matching playbook during a similar failure. A Neo4j knowledge graph maps service dependencies and ownership, so the agent can traverse dependencies, estimate blast radius, and check recent changes with structural context. Fifty-one production skills cover Elasticsearch, Datadog, Grafana, PagerDuty, Kubernetes, AWS, Jenkins, Argo CD, and more, so teams keep the stack they already operate. Start investigations from the web console, Slack, or Microsoft Teams, and follow progress from the same places. The console holds the investigation list, a memory hub for browsing episodes, and a config editor for the deployment. Direct Anthropic access is the default path, and the optional LiteLLM proxy adds OpenAI, Gemini, and other providers. Microsoft Entra single sign-on signs users into the console, with token login kept as break-glass access. Fault-injection tests against a demo application exercise cart, product, recommendation, and advertising failures end to end. Running on a dedicated VPS on RepoCloud with guaranteed CPU, RAM, and SSD, full root SSH access, and a browser serial console. Apache-2.0 licensed.
Resolvr DNS Dashboard
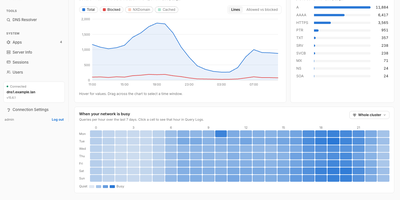
Resolvr gives your Technitium DNS server the clean, readable dashboard it deserves, turning raw query traffic into an overview you can understand at a glance. Four tabs divide the picture: Traffic charts queries over time with allowed and blocked stacked together and a seven-day heatmap of when your network is busy; Resolution shows where answers come from, cache, upstream, blocked, or authoritative, with response times and a flow diagram of each lookup; Top lists rank your chattiest clients and most-requested domains; and Infrastructure tracks DHCP scope usage, zones, and cache growth. Every chart is a doorway: click one and you land in Query Logs already filtered to what you clicked. Pick any device on the Clients page to see its queries, block rate, DHCP lease, and favourite domains. Query Logs themselves filter by client, name, protocol, response code, and time window, export to CSV, and can live-tail as new lookups arrive. Blocked Zones manages your feeds, your own blocked domains, and a checker that tells you whether a name is blocked and which feed caught it. Run a Technitium cluster and each panel gains a scope chip, comparing nodes side by side or merging their logs into one timeline. Running on a dedicated VPS on RepoCloud with guaranteed CPU, RAM, and SSD, full root SSH access, and a browser serial console. MIT licensed.
AbuseBox
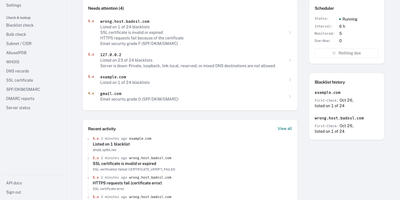
AbuseBox is a self-hosted monitor for the mail servers you operate, checking your IPs and domains against 24 DNS blacklists on a schedule and alerting you when a listing appears, disappears, or is about to matter. A listing is never just a red flag. AbuseBox decodes each list's return codes into a plain meaning and a severity, links the removal page, and folds the result into a risk score out of 100 for every asset, with each factor and its contribution shown. Before any verdict is trusted, the list itself is tested against its RFC test addresses, so a resolver being refused reads as No answer rather than clean. The same asset page grades SPF, DKIM, and DMARC from A to F, parses DMARC aggregate reports, and tracks certificate validity, domain expiry, DNS records, WHOIS details, and server reachability with response times. Assets arrive one at a time, in bulk lists of up to 300, or as an entire subnet, each with its own owner, check selection, and interval. The activity log records every change, history charts show the trend, and email, Slack, Discord, or webhook alerts carry the news. A public quick-check page answers one-off lookups without an account, and the REST API covers the rest. Running on a dedicated VPS on RepoCloud with guaranteed CPU, RAM, and SSD, full root SSH access, and a browser serial console. MIT licensed.
Statainer
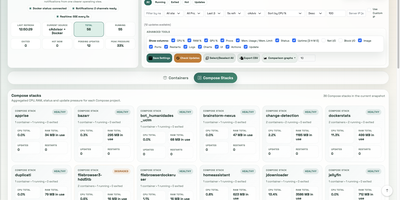
Monitoring and safeguarding Docker infrastructure without heavy enterprise software overhead is the primary mission of Statainer, an open-source management control center for container hosts. System operators inspect live CPU loads, memory consumption, network throughput, and disk I/O metrics across individual containers or comparative top-ranking charts. The interface groups containers by Compose projects, enabling administrators to start, stop, or restart entire application stacks and inspect real-time log streams without opening SSH sessions. The built-in Update Manager detects available image tags, executes single-click container updates, and maintains persistent deployment history with automated rollback capabilities for failed recreations. Custom alert configurations trigger instant notifications to Telegram, Discord, Slack, Pushover, or generic webhook endpoints whenever resource thresholds are breached or container health states change. Developers can provision scoped API keys with token authentication to automate container state transitions and export performance telemetry into custom monitoring workflows. Running on a dedicated VPS on RepoCloud with guaranteed CPU, RAM, and SSD, full root SSH access, and a browser serial console. MIT licensed.
Domain Monitor
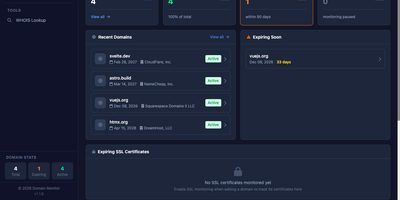
The renewal notice always seems to land in an inbox nobody checks anymore, so Domain Monitor tracks every domain you own from your own server and warns you long before each expiry date arrives. It pulls expiration dates and registrar details automatically through WHOIS and RDAP across more than 1,400 supported TLDs, keeping the whole portfolio current without anyone remembering to look. Add domains one at a time or import them in bulk, group them with tags and watchlists, and let scheduled cron checks refresh the data on their own. Alerts escalate on your schedule, at 60, 30, 21, 14, 7, 5, 3, 2, and 1 day before expiry, and arrive through email, Telegram, Discord, Slack, Mattermost, Pushover, or webhooks, routed by notification groups so the right people hear about the right domains. Each domain also gets tabbed views for its DNS records, SSL certificate validity, billing notes, notification history, and raw WHOIS output, with per-domain toggles for DNS and certificate monitoring. The dashboard surfaces what expires soon, how domains distribute across registrars, and whether every domain is actually covered by an alert channel. Multiple users get their own accounts with two-factor authentication, tracked sessions, and an in-app notification center. Running on a dedicated VPS on RepoCloud with guaranteed CPU, RAM, and SSD, full root SSH access, and a browser serial console. MIT licensed.
DAC
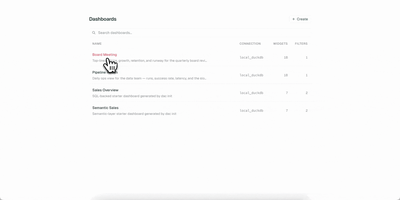
Your dashboards deserve version control, code review, and reproducible builds, just like the rest of your stack. DAC lets you define interactive data dashboards in YAML or TSX, validate them in CI, and serve them from a single Go binary that embeds a full React frontend. Choose from 21 chart types including line, bar, area, pie, scatter, bubble, funnel, sankey, heatmap, calendar, sparkline, waterfall, gauge, treemap, radar, and candlestick, plus metric cards, data tables, text blocks, and image widgets. The built-in semantic layer lets you define metrics and dimensions once in reusable model files, then reference them from any widget while DAC generates the SQL automatically. Connect to Postgres, MySQL, Snowflake, BigQuery, Redshift, Databricks, and DuckDB through standard Bruin connection configs. Interactive filters with date pickers, dropdowns, multiselects, and search inputs inject values via Jinja templating and re-execute only affected widgets. Live reload via Server-Sent Events refreshes connected browsers instantly when you save a file. Export dashboards as self-contained static HTML with baked-in query results for S3, GitHub Pages, or offline sharing, and render slide decks via the Google Slides export command. On RepoCloud, deploy DAC on a dedicated VPS with root SSH access and persistent storage for your dashboard definitions and database connections under the AGPL-3.0 license.
Depl0y
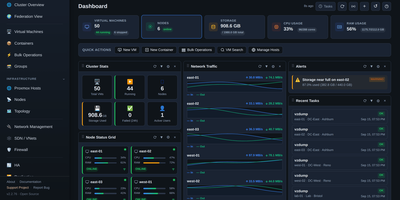
Three Proxmox sites, a lab host in the corner, and a rack of Dell and HPE servers can all share one screen when Depl0y runs the show. The dashboard totals virtual machines, containers, CPU, RAM, storage, and network traffic across every registered endpoint, with draggable widgets, alerts, and recent task feeds. Virtual machine pages cover start, stop, restart, snapshots, cloning, migration, templates, and a browser console, and node pages add metric charts, storage, networking, and update status. A guided failover wizard checks quorum, storage, and disks, then protects a guest so it restarts on another node if its host fails. A topology view maps hosts, guests, bridges, storage, and BMCs, with PNG, SVG, and draw.io export. Hardware pages poll iDRAC and iLO for health, temperature, power draw, DIMMs, drives, and firmware, and power controls reach machines that are fully off. Deployment tools build VMs from cloud images, import OVA, VMDK, and QCOW2 files, and launch self-hosted LLM guests. Admin, Operator, and Viewer roles, TOTP, host pinning, and a searchable audit log keep access tidy. MSPs managing client clusters, homelabs with several nodes, and data center teams that want hypervisor and hardware status together are the target audience. Running on a dedicated VPS on RepoCloud with guaranteed CPU, RAM, and SSD, full root SSH access, and a browser serial console. MIT licensed.
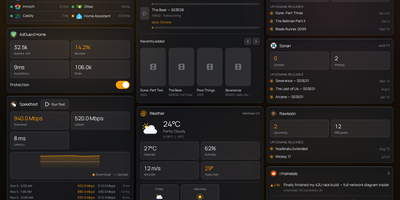
Labby
Labby gathers a whole homelab onto one live dashboard you host yourself, covering services, containers, downloads, and media servers. Widgets watch your service monitor, Docker containers, qBittorrent or Transmission queues, SABnzbd, AdGuard Home, Jellyfin, Emby, Plex, Beszel, Radarr, Sonarr, plus weather, calendar, speedtest, bookmarks, Reddit, and Hacker News, and the server pushes every change to your browser over server-sent events so nothing waits on a refresh timer. The dashboard is not a read-only poster: start and stop containers, pause and resume torrents, and toggle AdGuard protection straight from its widgets. Everything configures from the in-app Manage Services page, where service URLs, API keys, poll intervals, and multiple instances of the same integration (two Radarr servers, say) live in a small SQLite database instead of scattered environment files. Named color schemes restyle the board and save with the config, and icon sources span dashboard-icons, selfh.st, Lucide, or your own URLs. Login is off by default for trusted home networks, with a clear warning to keep it behind a LAN, VPN, or forward-auth proxy, and optional OIDC sign-in through Authentik, Authelia, Keycloak, or Pocket ID when you want a real front door. One container, one volume, and your lab finally explains itself at a glance. Running on a dedicated VPS on RepoCloud with guaranteed CPU, RAM, and SSD, full root SSH access, and a browser serial console. MIT licensed.
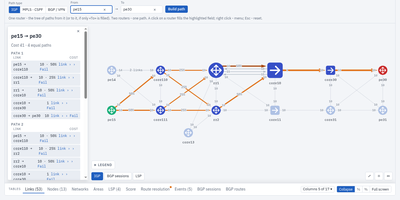
Topolograph
Before the maintenance window, know exactly where the traffic will go: Topolograph rebuilds your network the way its routing protocols see it and lets you break it safely on screen. Upload one router's LSDB output, from Cisco, Juniper, Arista, FRRouting, MikroTik, and a dozen other vendors, and the whole area's topology appears as an interactive graph, because the protocol already flooded it everywhere. Compute the shortest path between any two routers and see every equal-cost alternative with per-link loads, then fail a link or a node and watch SPF recalculate: which pairs moved to backup, which are left with none, and how the load shifted on every surviving link. Search the graph for prefixes, MAC addresses, or any network element, plan an MPLS TE path against real bandwidth attributes, and compare snapshots from different moments to answer what changed before the incident. Collectors can stream live OSPF, IS-IS, and BGP events over GRE, BGP-LS, or BMP so the timeline replays the network at the moment things broke, and a REST API, Python SDK, and MCP server let your own tooling and AI agents ask the same questions. Running on a dedicated VPS on RepoCloud with guaranteed CPU, RAM, and SSD, full root SSH access, and a browser serial console. MIT licensed.
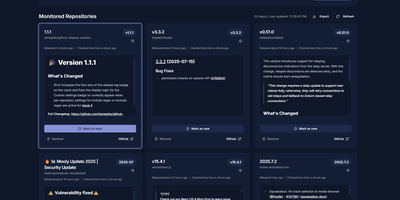
GitHub Release Monitor
GitHub Release Monitor turns release day into a notification instead of a discovery, watching GitHub, GitLab, Codeberg, and self-hosted Forgejo repositories in the background and reporting each new release to the channels you already read. Your watchlist is the whole interface. Add the projects your stack depends on, and scheduled checks compare what is published against what you have seen. Email carries the full notes over SMTP. Apprise carries them further, to Discord, Telegram, Slack, and dozens of other services, either one message per release or bundled into a digest for each check. Filtering happens at two levels. Global rules decide which release types count, and any repository can override them with its own channels, its own include and exclude regular expressions on tags, and its own choice of alpha, beta, or release candidate lines. A pattern the current engine no longer supports is flagged in settings rather than silently passing nothing. The list itself is portable JSON, ready to export from one install and import into another. When the alerts stop, the diagnostics page separates suspicion from evidence by testing forge connectivity, SMTP, and Apprise in one place. Accounts protect the app, dark mode and nineteen languages shape it, and the layout works on a phone. Running on a dedicated VPS on RepoCloud with guaranteed CPU, RAM, and SSD, full root SSH access, and a browser serial console. AGPL-3.0 licensed.
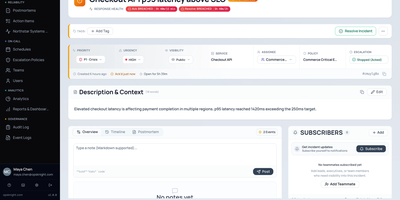
OpsKnight
When production breaks at 3 a.m., somebody has to know it is their turn, and OpsKnight keeps that answer on your own server instead of a per-seat subscription. Alerts from Prometheus, Grafana, Datadog, Sentry, CloudWatch, and generic webhooks arrive at authenticated endpoints, get deduplicated, and are routed to the right service. On-call schedules support rotation layers, daylight saving safe handoffs, and temporary overrides, and escalation policies page users, schedules, or whole teams in timed steps. Responders get push, email, SMS, WhatsApp, and Twilio voice calls where the keypad acknowledges the page. Each incident has an ownership panel, a timeline, notes, subscribers, action items, and SLA timers, and Slack or Teams war rooms keep chat in step. The Command Center shows active, muted, and unassigned incidents at a glance, analytics report MTTA, MTTR, and SLA compliance, and a System Health Center runs live diagnostics. A public status page with uptime history, maintenance notices, and subscribers keeps customers informed, and postmortems capture what the team learned. Sign-in supports OIDC and SCIM provisioning, and an installable mobile web app brings pages to your phone. Running on a dedicated VPS on RepoCloud with guaranteed CPU, RAM, and SSD, full root SSH access, and a browser serial console. AGPL-3.0 licensed.
Thruk
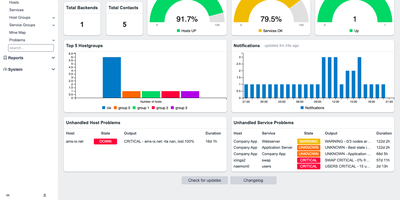
Thruk gives operations teams one fast web interface for watching hosts and services across several monitoring servers, with live status, dashboards, reports, and configuration in one place. One view combines Naemon, Icinga, Nagios, and Shinken servers, groups them by site, and reads them live. A home page of widgets shows host and service totals, gauges, notification charts, and unhandled problems, and a tactical overview adds outages and network health. Users filter, bookmark, and export status tables to Excel, and a mine map shows every host against its services as colored squares. A host page lists performance data beside actions to reschedule a check, submit a passive result, send a custom notification, or schedule downtime. Panorama dashboards place icons, graphs, and widgets on a free canvas or an OpenStreetMap, then share them with contact groups. A business process editor models an application as a tree of nodes with worst-of or best-of rules, and notifications can fire for individual steps. SLA reports in HTML and PDF go out by email on a schedule, and any page can become a recurring email report. A config tool edits hosts, services, commands, and contacts, manages users and teams, and reloads the monitoring core. Scripts reach status and commands through the REST API with API keys or through the command-line client. Running on a dedicated VPS on RepoCloud with guaranteed CPU, RAM, and SSD, full root SSH access, and a browser serial console. Artistic-1.0-Perl OR GPL-1.0-or-later licensed.
Solectrus
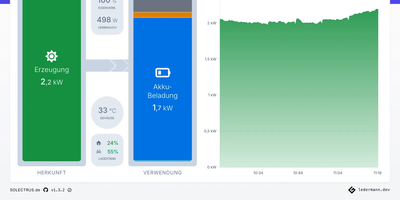
The inverter app tells you the sun shone; SOLECTRUS tells you what that sunshine was worth. It is a dashboard for your whole photovoltaic system that balances every watt: what the panels produced, what the house consumed, what the battery stored, and what crossed the grid meter in either direction, for any period you care to name. Up to five generators, from the main roof array to a balcony power plant, appear individually or summed, and up to twenty custom consumers, wallbox included, get their own accounting. The Power-Splitter shows how much green electricity actually landed in the car, the heat pump, or the washing machine, and what each load truly cost once lost feed-in revenue counts. Enter your electricity prices and feed-in tariff, including their changes over the years, and it computes savings, self-consumption costs, return, and the day the system has paid for itself from measured data rather than the sales brochure. Forecasts from pvnode, Solcast, or Forecast.Solar look up to seven days ahead using your location, orientation, tilt, and peak capacity. Heat pump owners see generated heat and coefficient of performance beside the power draw. Everything lands in InfluxDB and stays there, with daily aggregation keeping multi-year views fast, trends against last month or last year, and a Top-10 of your best and worst days. Running on a dedicated VPS on RepoCloud with guaranteed CPU, RAM, and SSD, full root SSH access, and a browser serial console. AGPL-3.0 licensed.