Categories
Self-Hosted DevOps Server Monitoring Virtualization Infrastructure Management High Availability Proxmox Management Hardware MonitoringStars
Forks
Watchers
Developer links
Depl0y
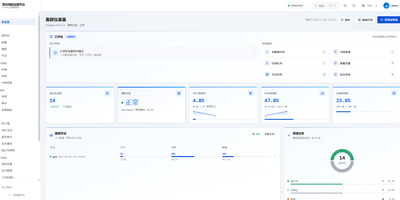
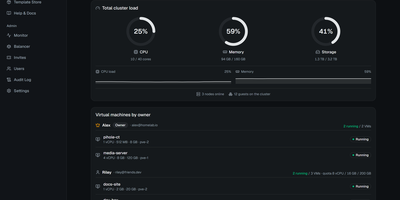
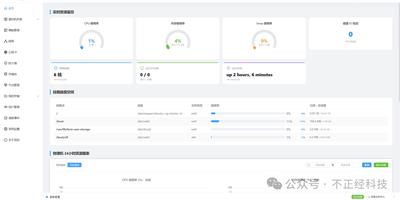
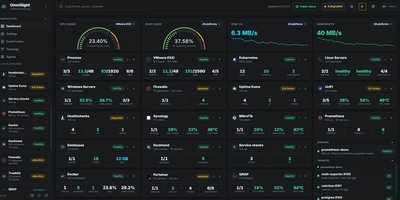
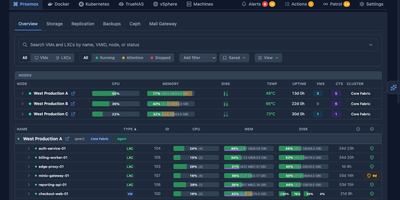
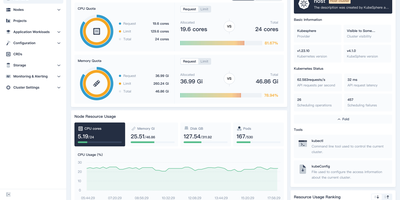
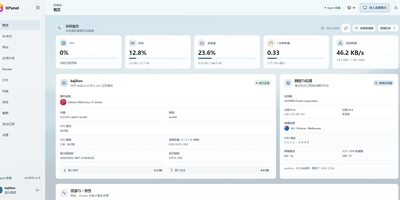
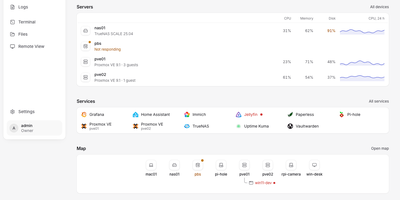
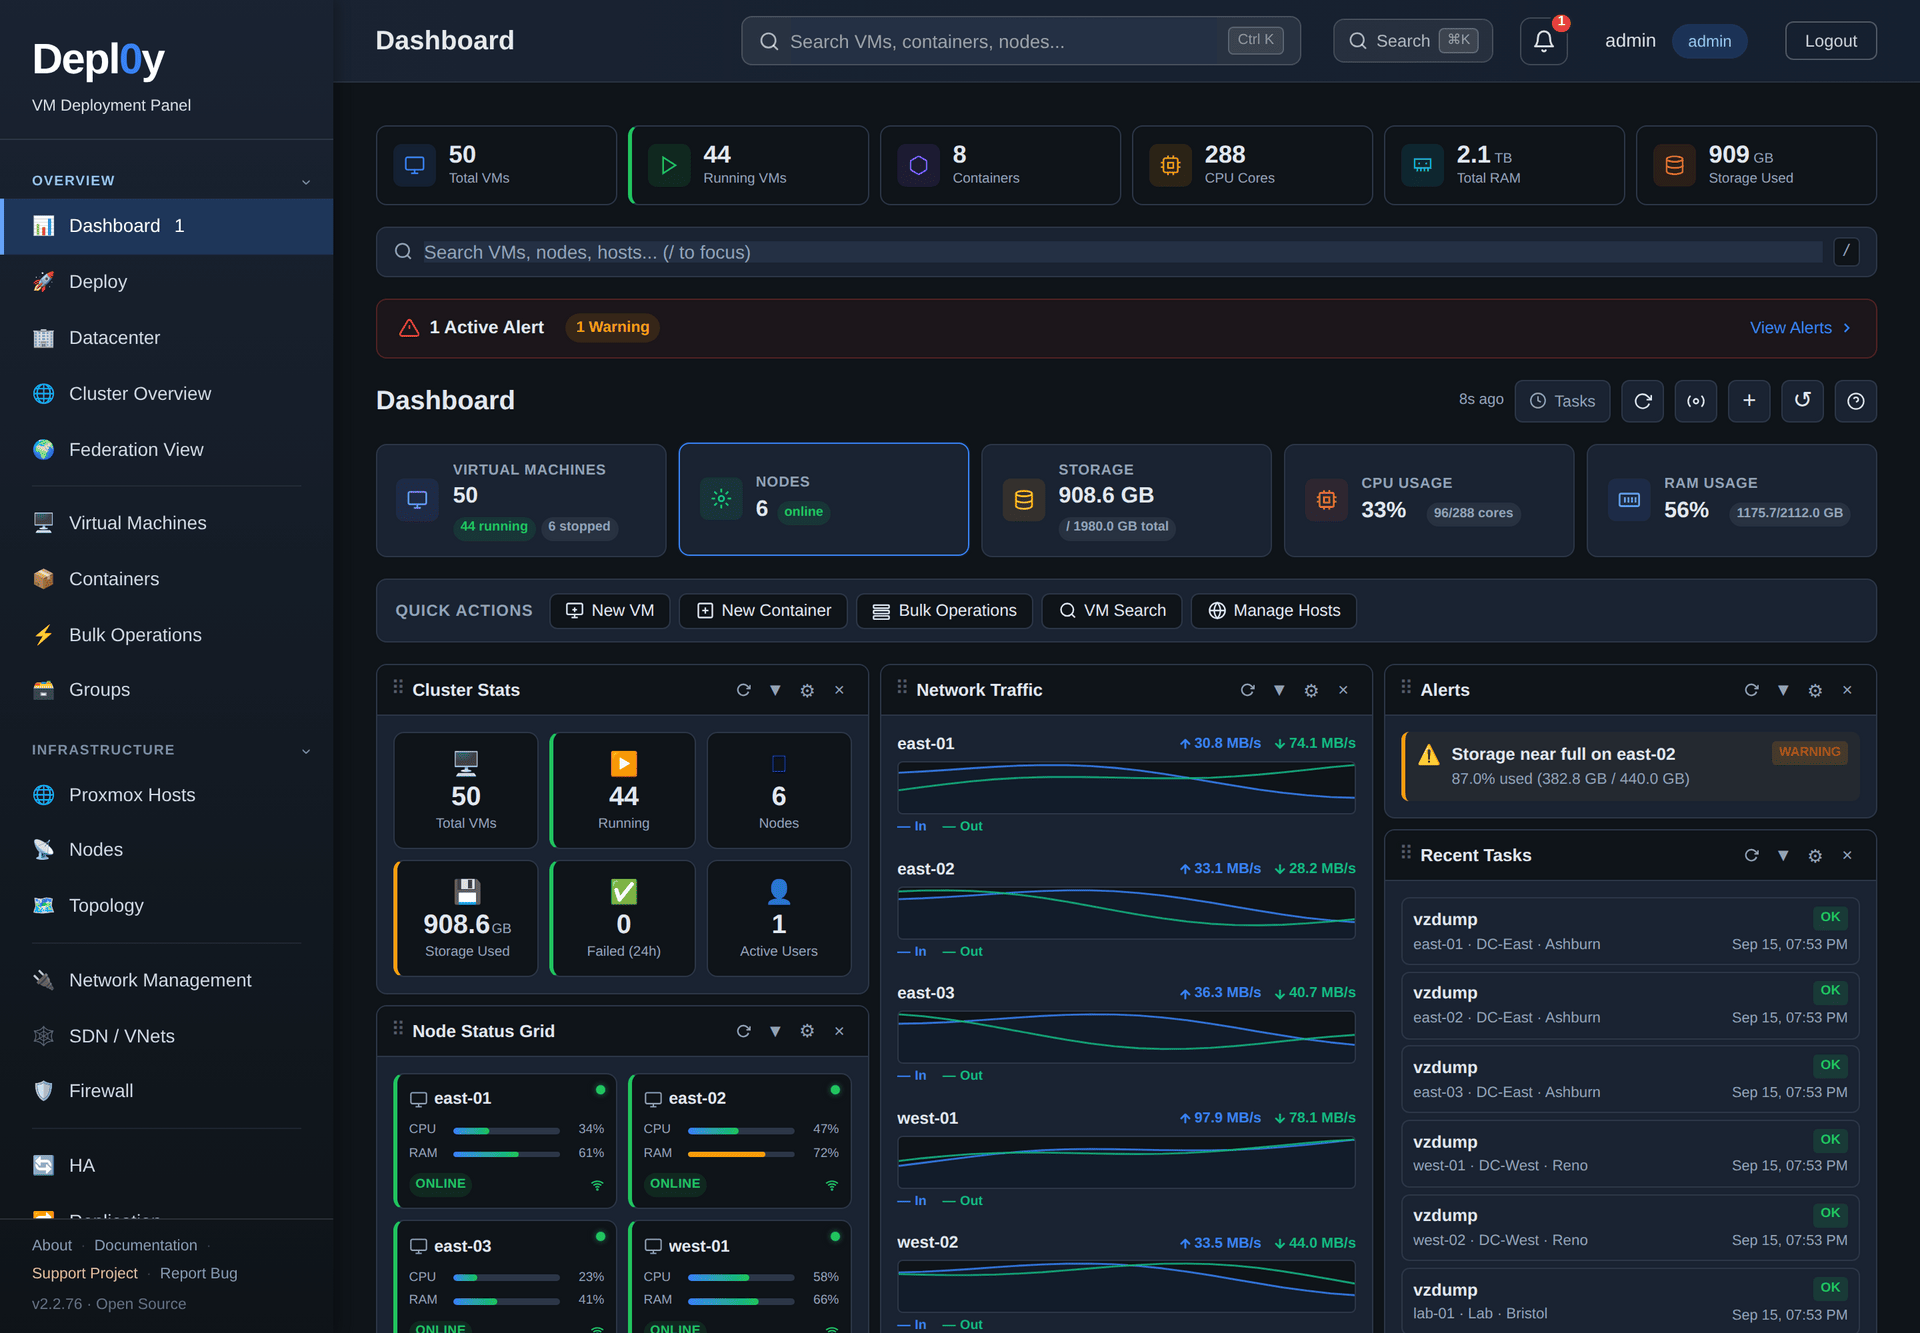
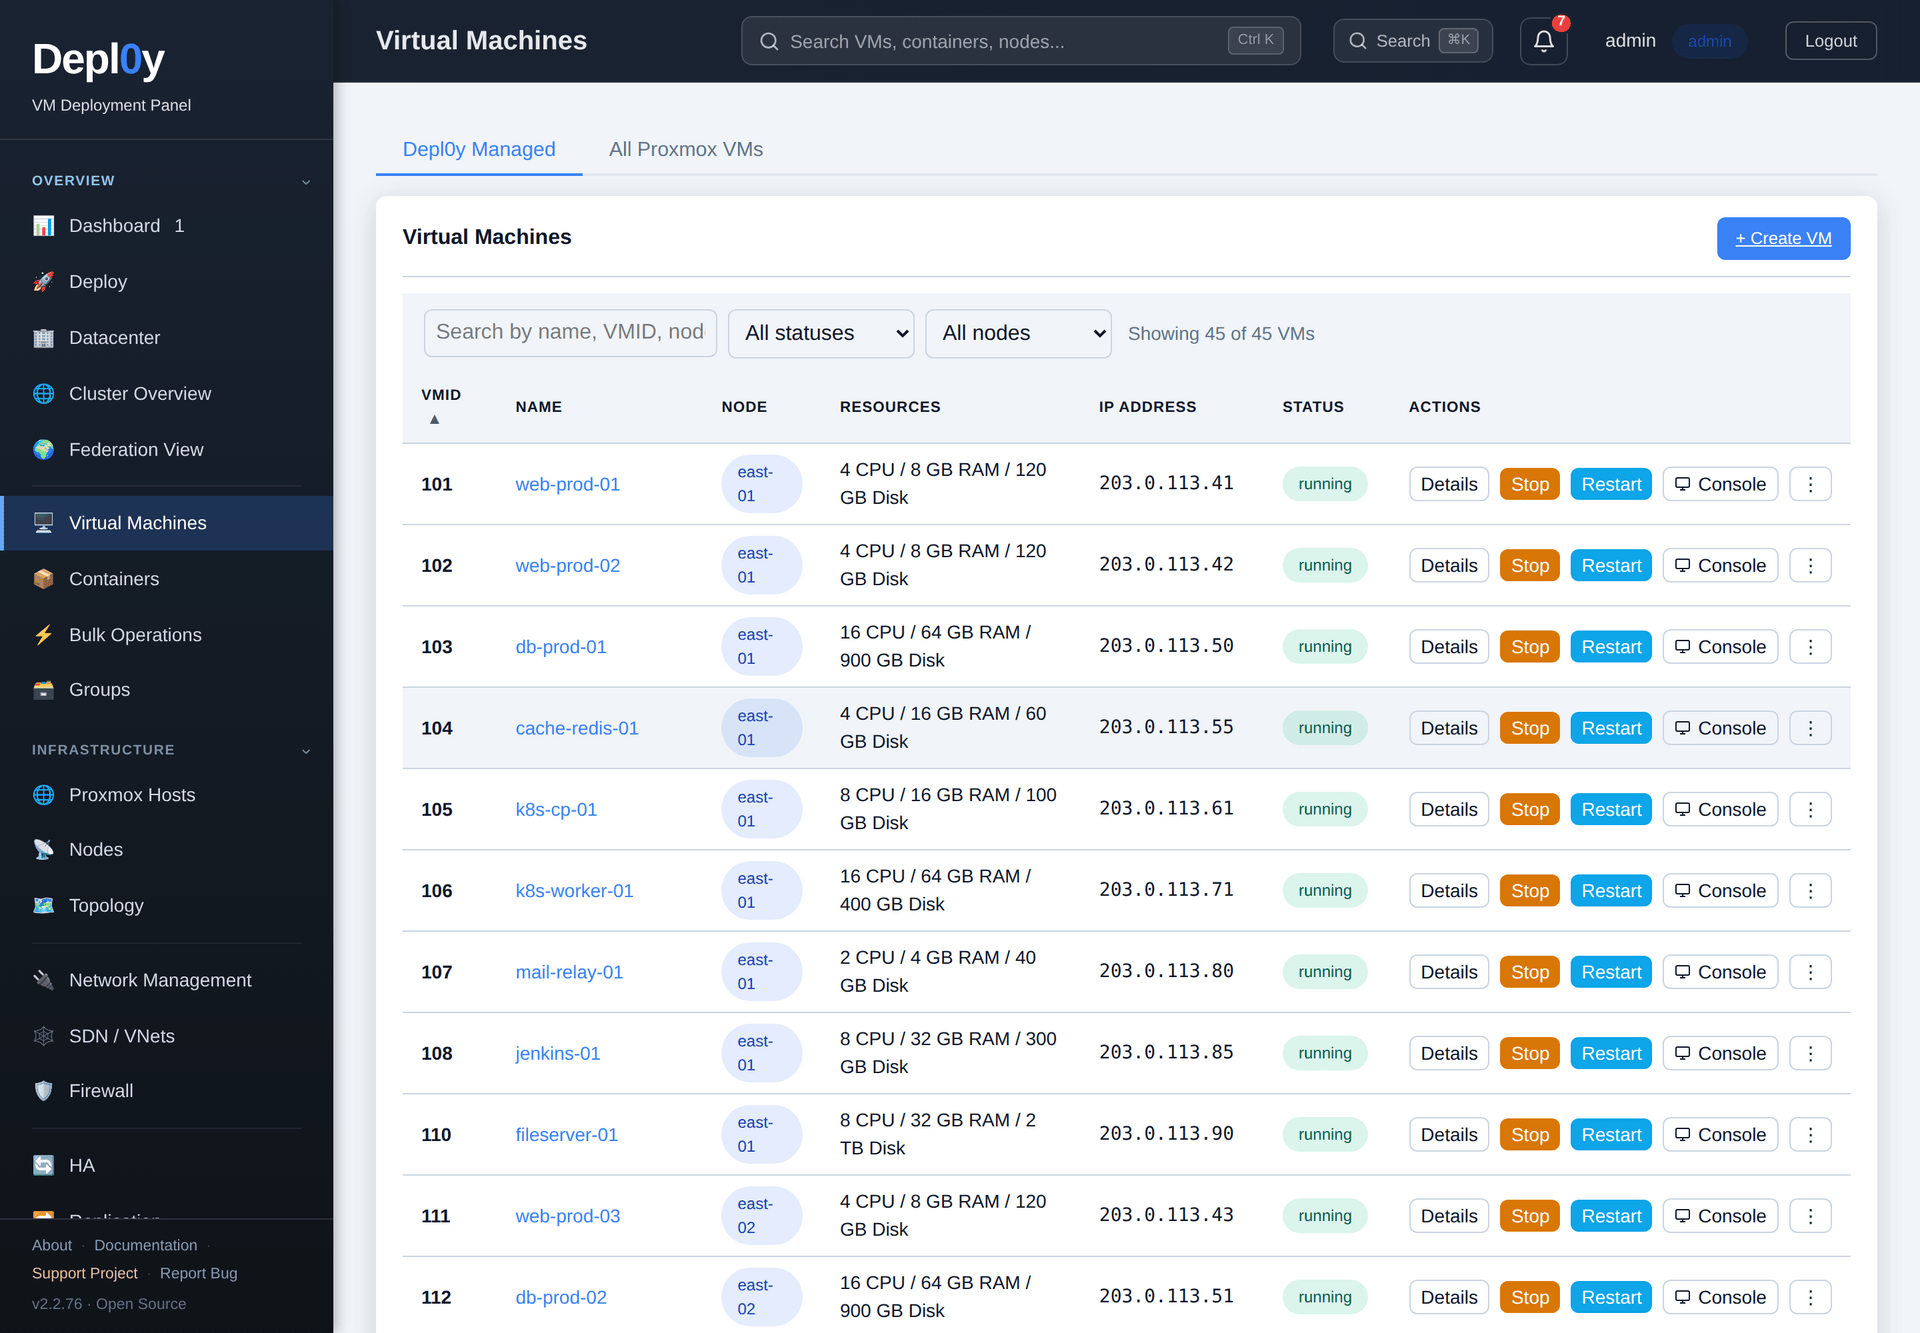
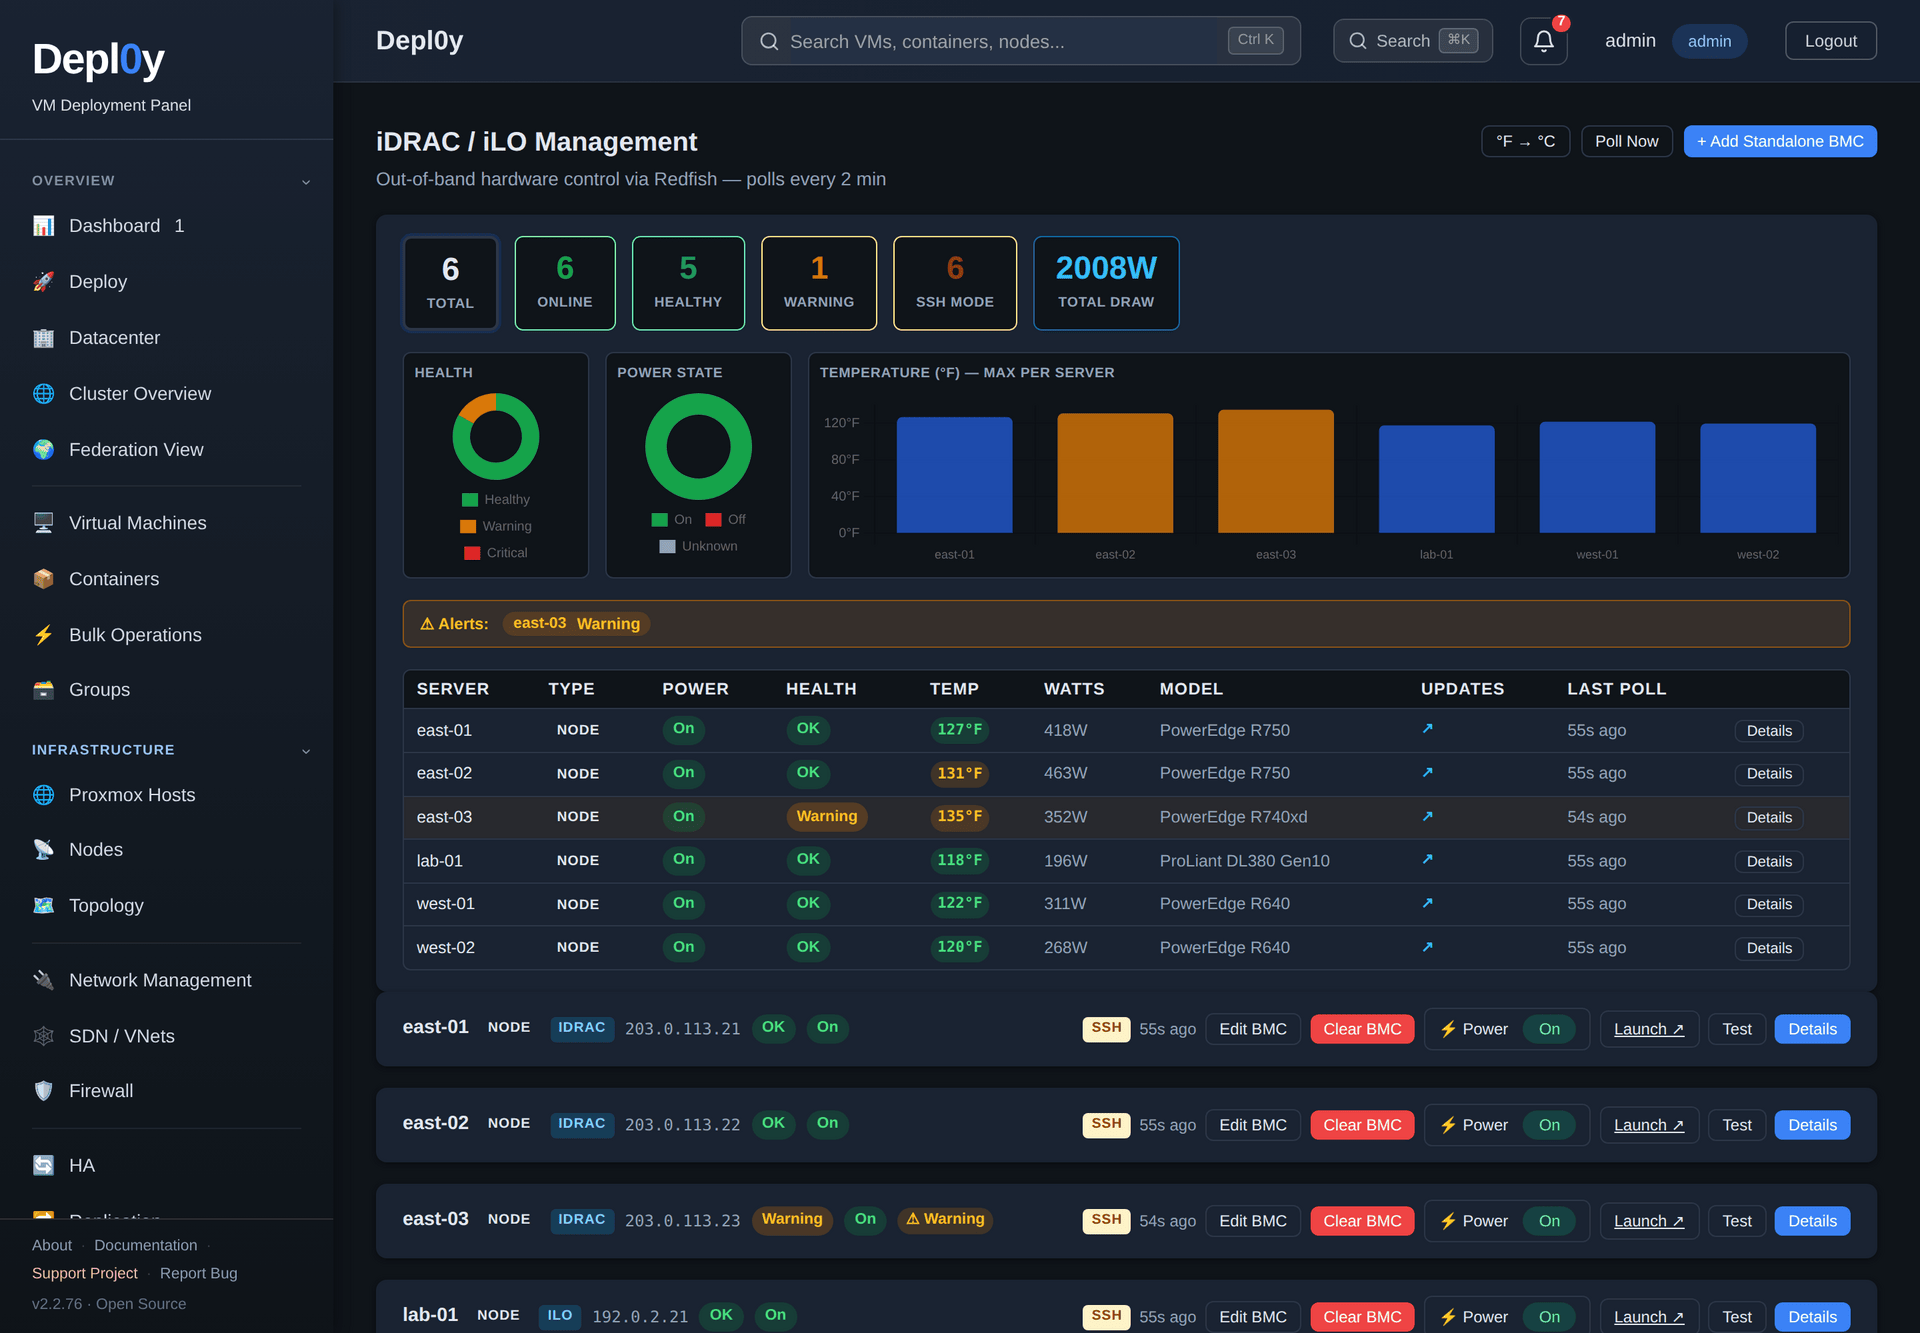
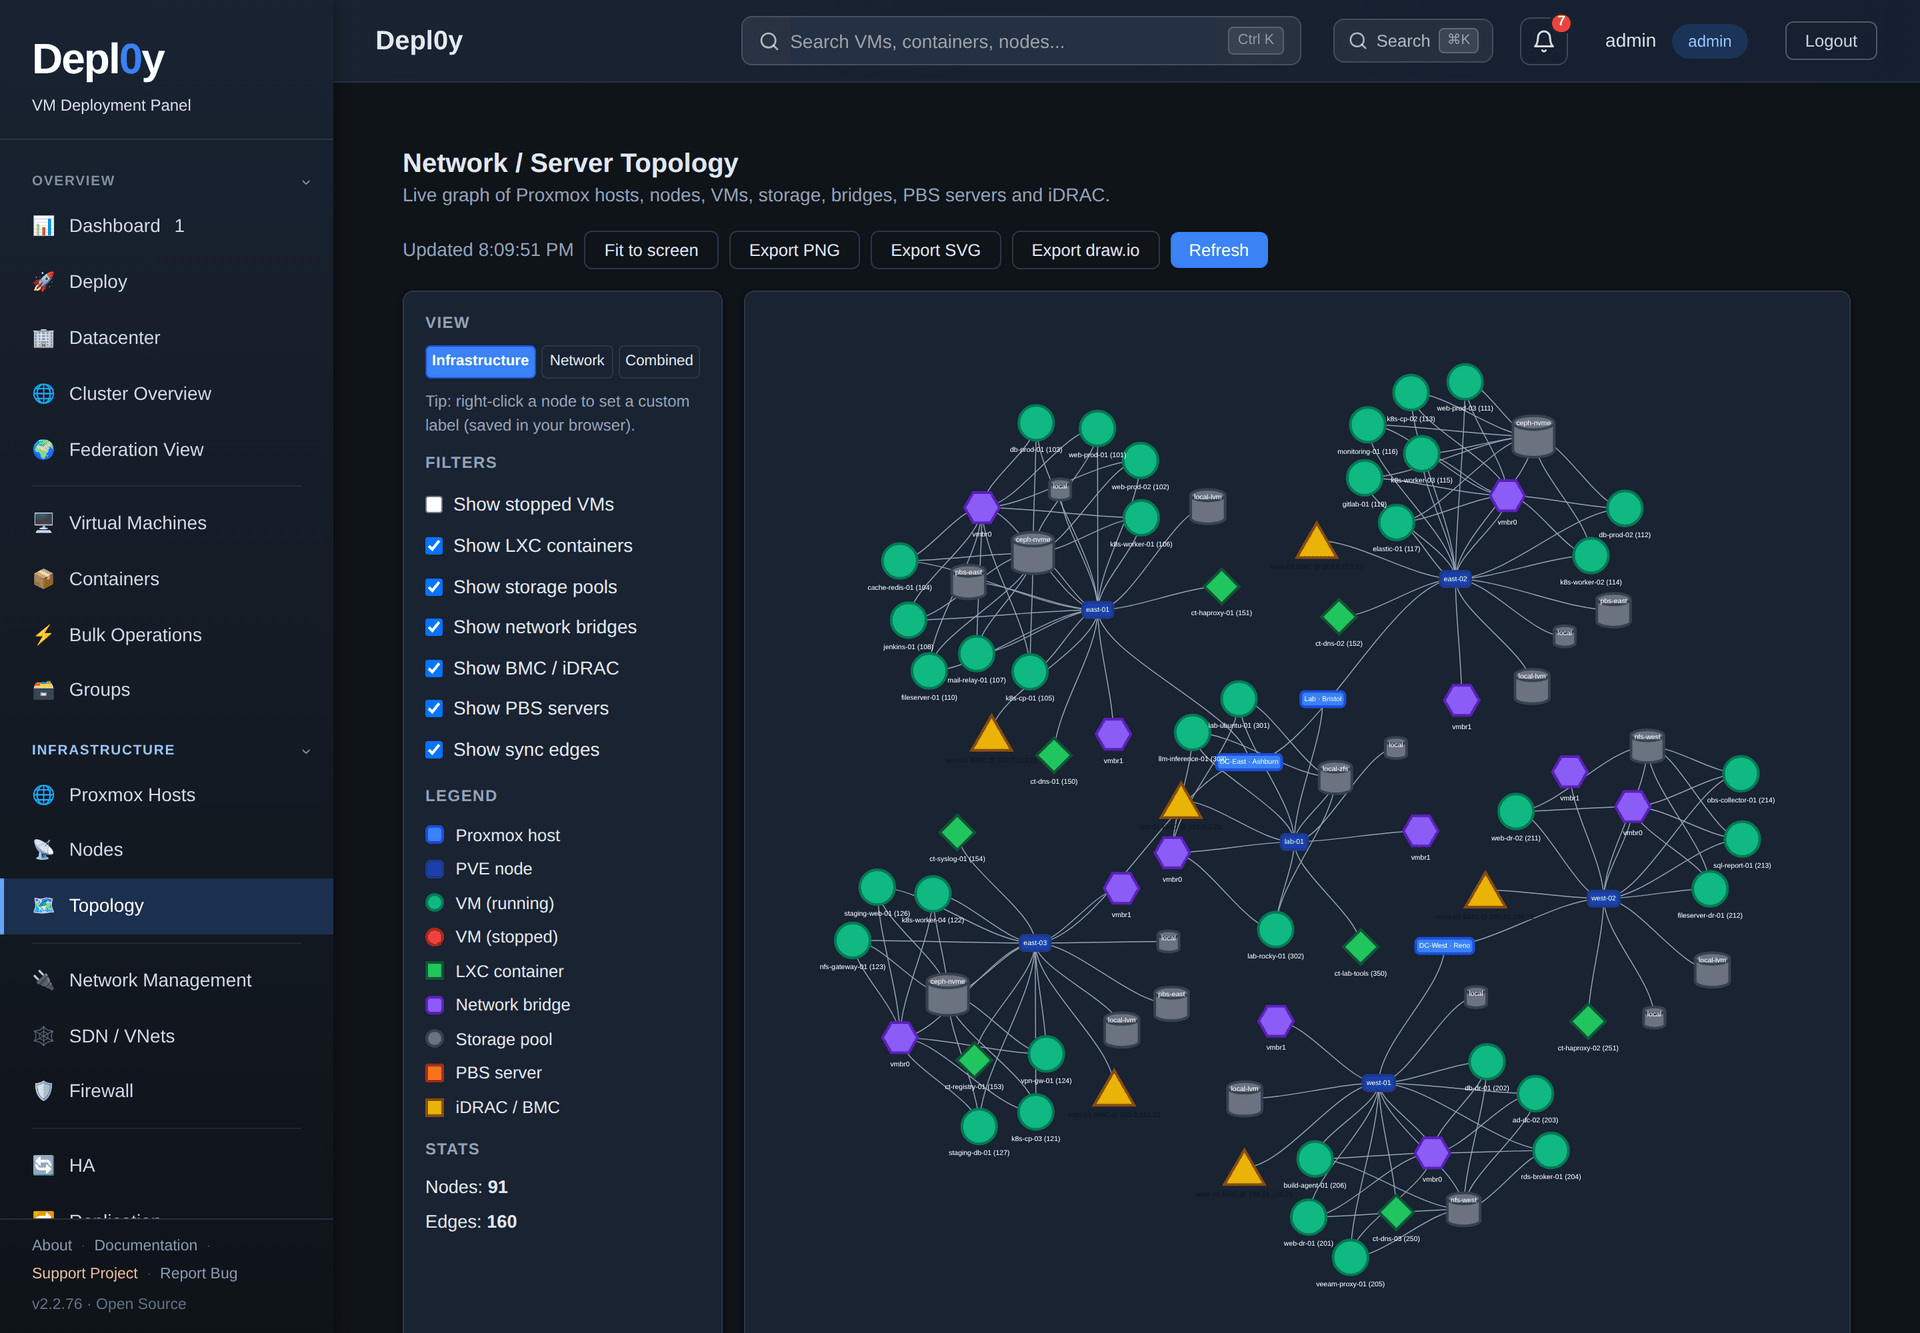
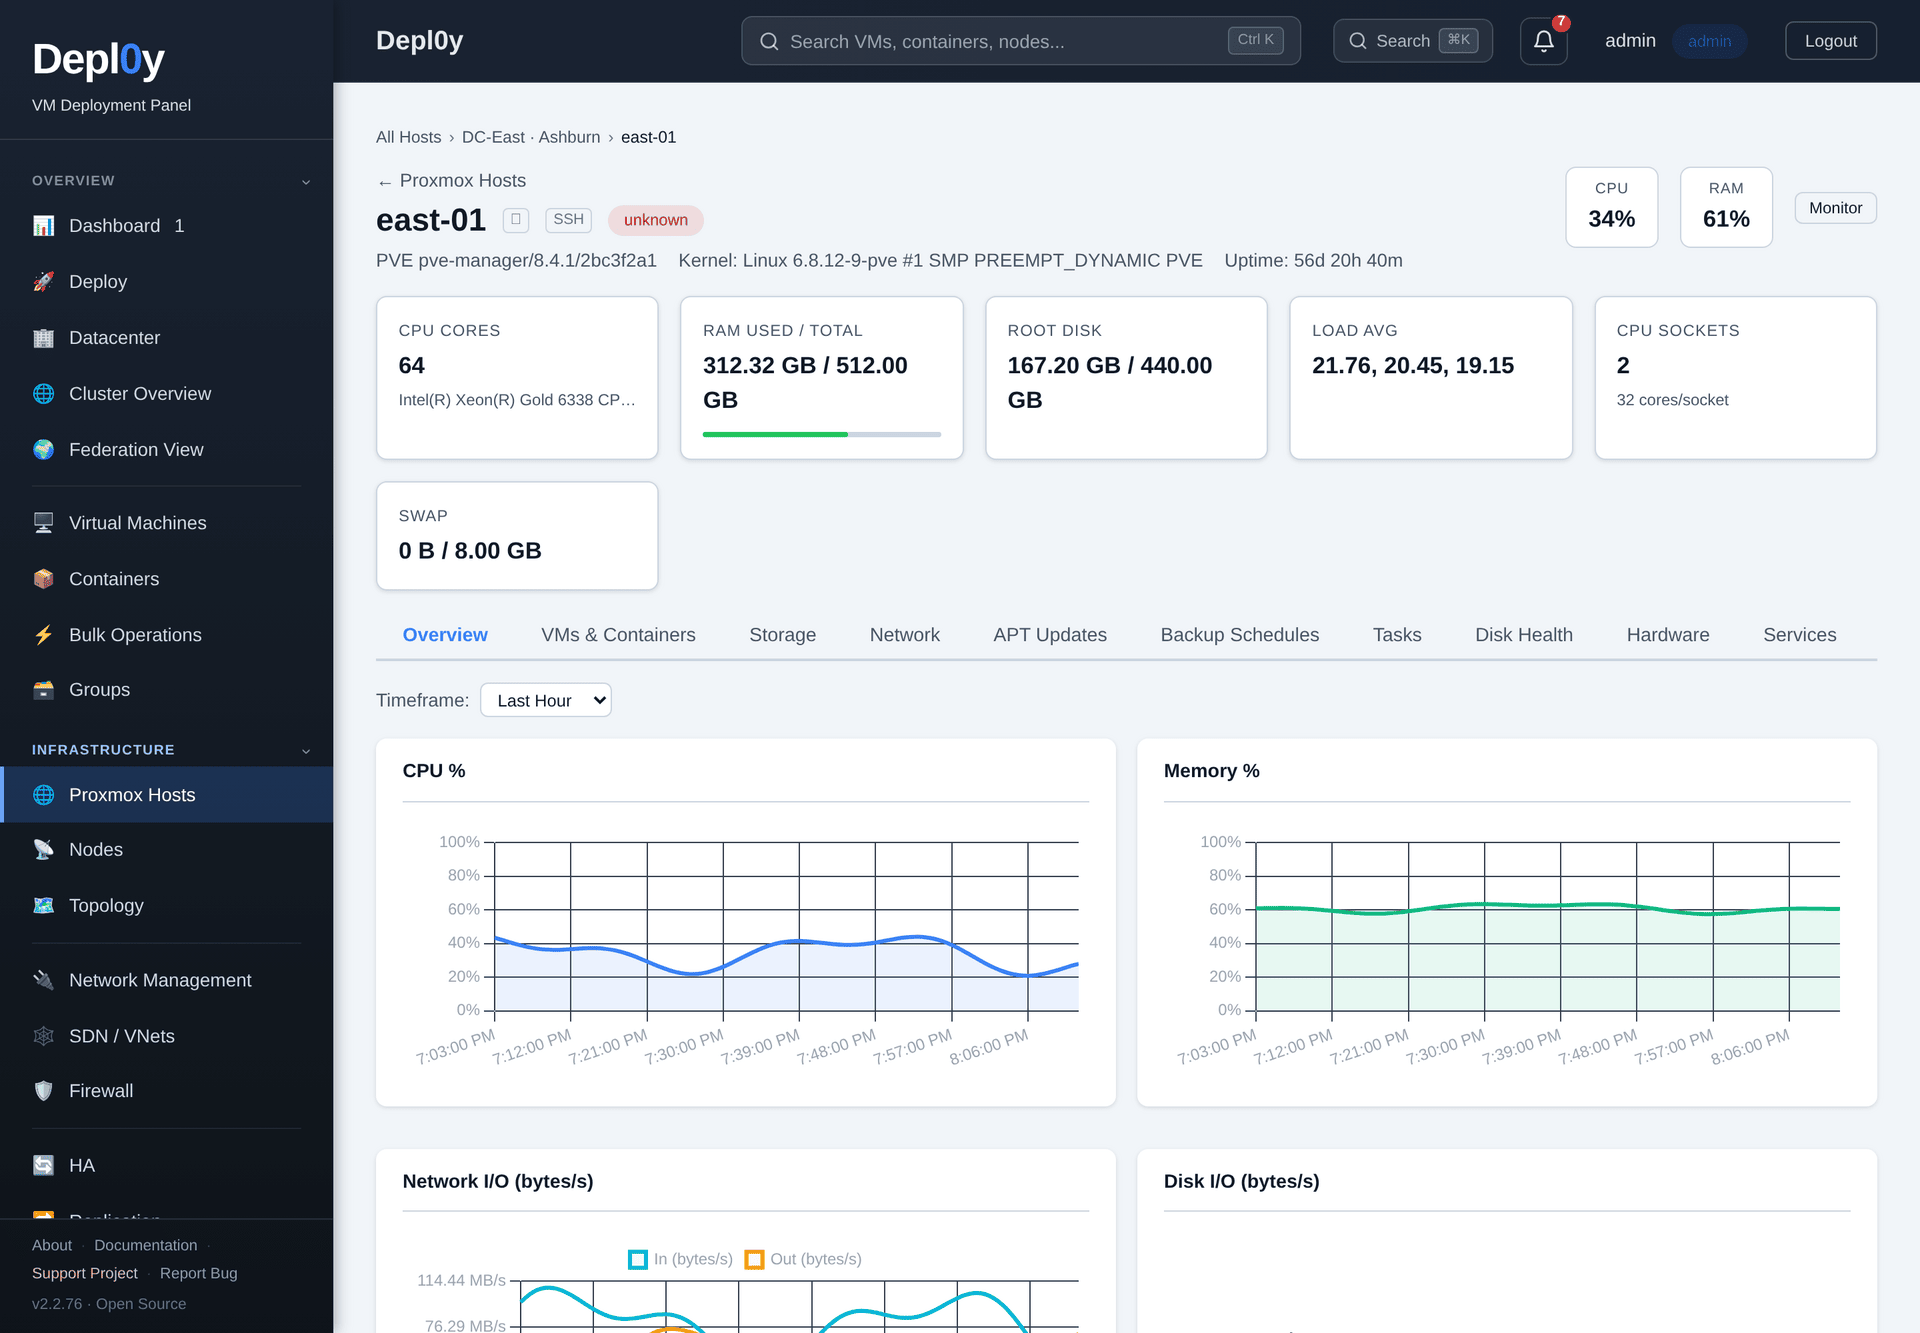
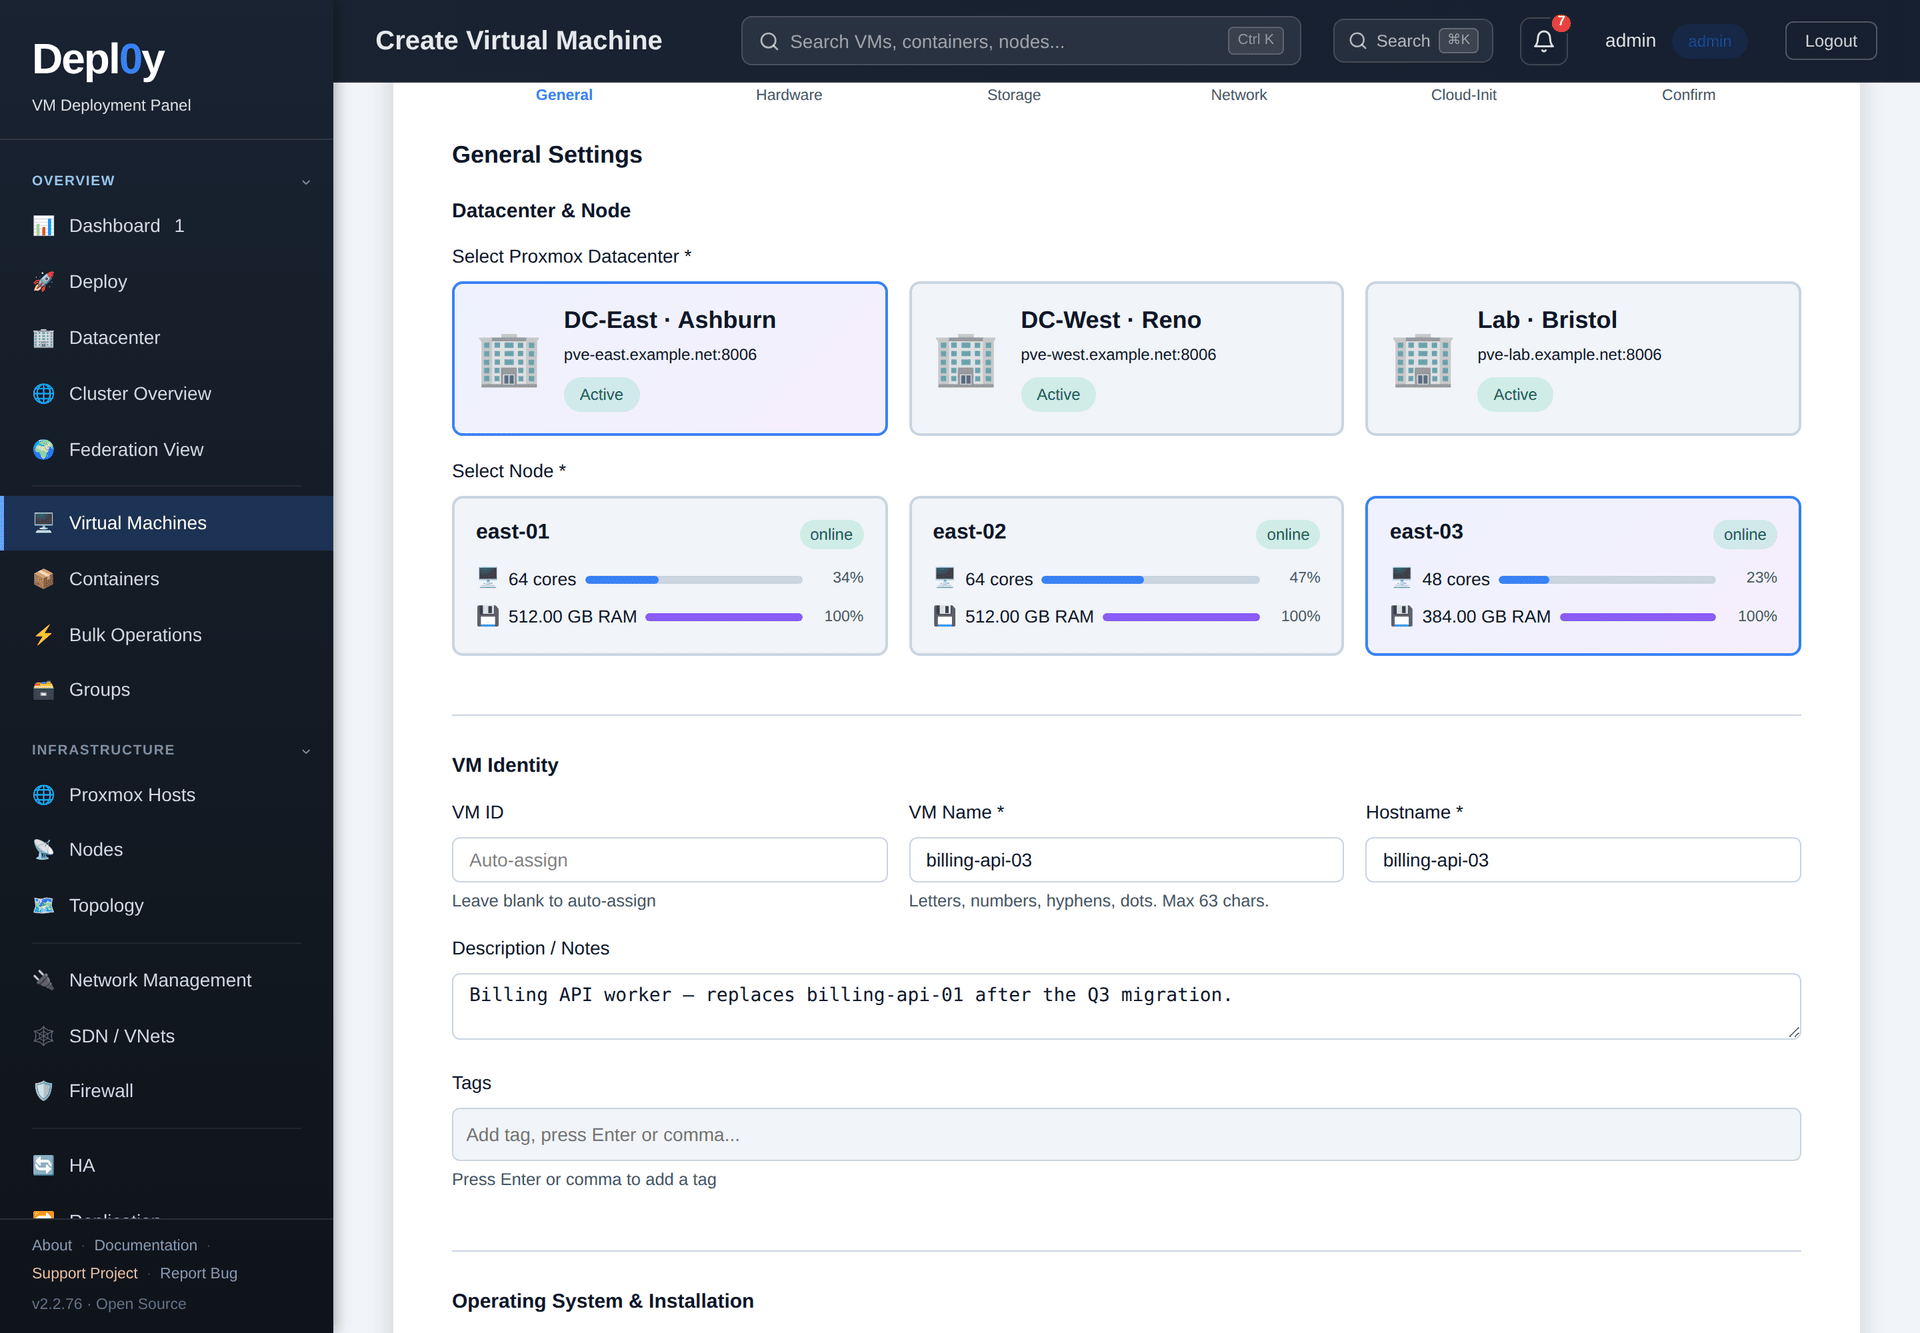
Three Proxmox sites, a lab host in the corner, and a rack of Dell and HPE servers can all share one screen when Depl0y runs the show. The dashboard totals virtual machines, containers, CPU, RAM, storage, and network traffic across every registered endpoint, with draggable widgets, alerts, and recent task feeds. Virtual machine pages cover start, stop, restart, snapshots, cloning, migration, templates, and a browser console, and node pages add metric charts, storage, networking, and update status. A guided failover wizard checks quorum, storage, and disks, then protects a guest so it restarts on another node if its host fails. A topology view maps hosts, guests, bridges, storage, and BMCs, with PNG, SVG, and draw.io export. Hardware pages poll iDRAC and iLO for health, temperature, power draw, DIMMs, drives, and firmware, and power controls reach machines that are fully off. Deployment tools build VMs from cloud images, import OVA, VMDK, and QCOW2 files, and launch self-hosted LLM guests. Admin, Operator, and Viewer roles, TOTP, host pinning, and a searchable audit log keep access tidy. MSPs managing client clusters, homelabs with several nodes, and data center teams that want hypervisor and hardware status together are the target audience. Running on a dedicated VPS on RepoCloud with guaranteed CPU, RAM, and SSD, full root SSH access, and a browser serial console. MIT licensed.
Benefits
- Every Proxmox Site In View
- Register each cluster or standalone host as its own endpoint, with separate credentials, and see combined VM, node, and storage totals on a single dashboard.
- Hardware Health Beside Hypervisors
- iDRAC and iLO data over Redfish shows temperature, power draw, and firmware next to the VMs on each machine, so an overheating server is spotted early.
- Safer Access Than Shared Root
- Operators sign in with their own Admin, Operator, or Viewer accounts, protected by TOTP and logged in an audit trail, instead of sharing Proxmox root credentials.
- Failover Without Guesswork
- The failover wizard checks quorum, storage, and disks, explains what will change, and sets up Proxmox HA so guests restart elsewhere when a node fails.
Features
- Federated Dashboard Widgets
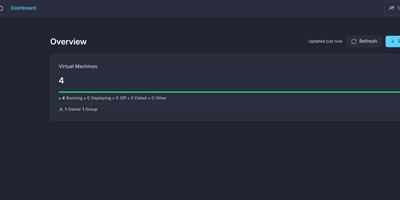
- Arrange draggable widgets for CPU, RAM, storage, network traffic, alerts, node status, and recent tasks, each linking to the view behind it.
- VM And Container Control
- Start, stop, snapshot, clone, migrate, and template guests, edit their configuration, and open a console from the browser for any VM or container.
- Topology Map Export
- Explore a live graph of hosts, nodes, guests, bridges, storage pools, and BMCs, filter what is shown, and export it as PNG, SVG, or draw.io.
- iDRAC And iLO Monitoring
- Poll Dell and HPE servers over Redfish for health, power state, temperature, wattage, DIMM and drive inventory, firmware versions, and BMC power controls.
- Cloud Image Deployment
- Create VMs from Ubuntu, Debian, and Rocky cloud images with cloud-init settings, or import OVA, VMDK, and QCOW2 disks from other platforms.
- Roles TOTP And Auditing
- Assign Admin, Operator, and Viewer roles, require TOTP, scope users to specific hosts, and review every action in a filterable audit log.