Categories
Infrastructure Monitoring Monitoring Dashboard Business Process Monitoring Nagios Web Interface Icinga Frontend Naemon Frontend SLA ReportingStars
Forks
Watchers
Developer links
Thruk
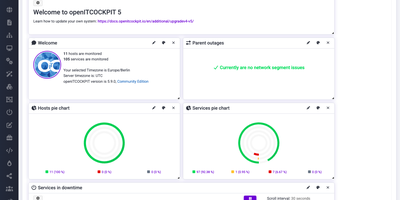
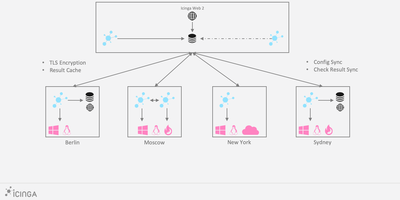
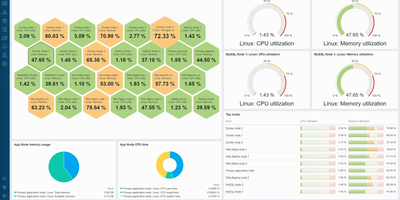
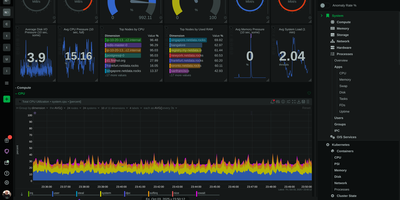
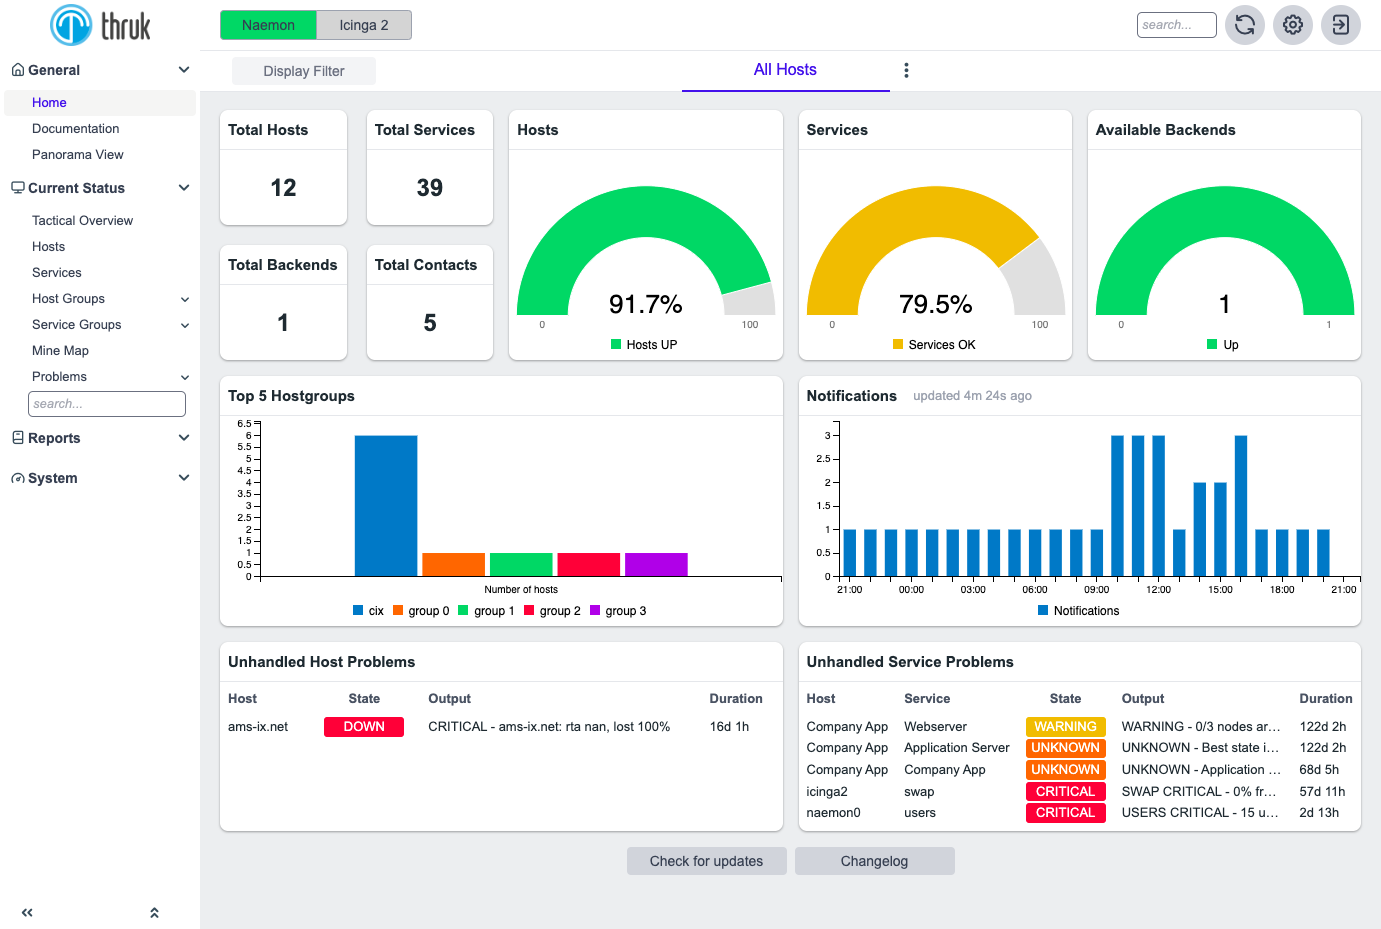
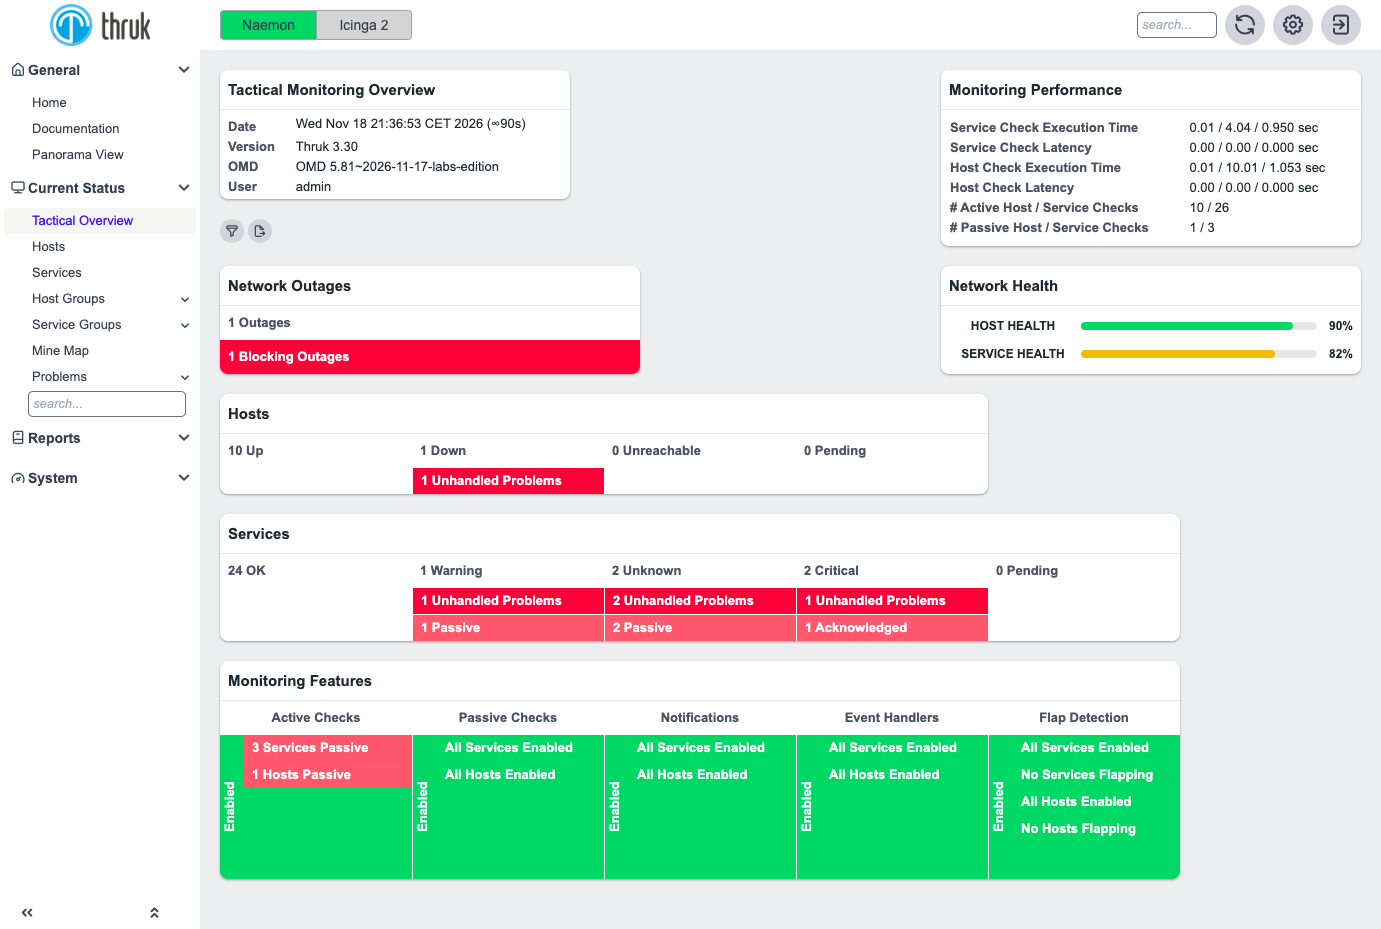
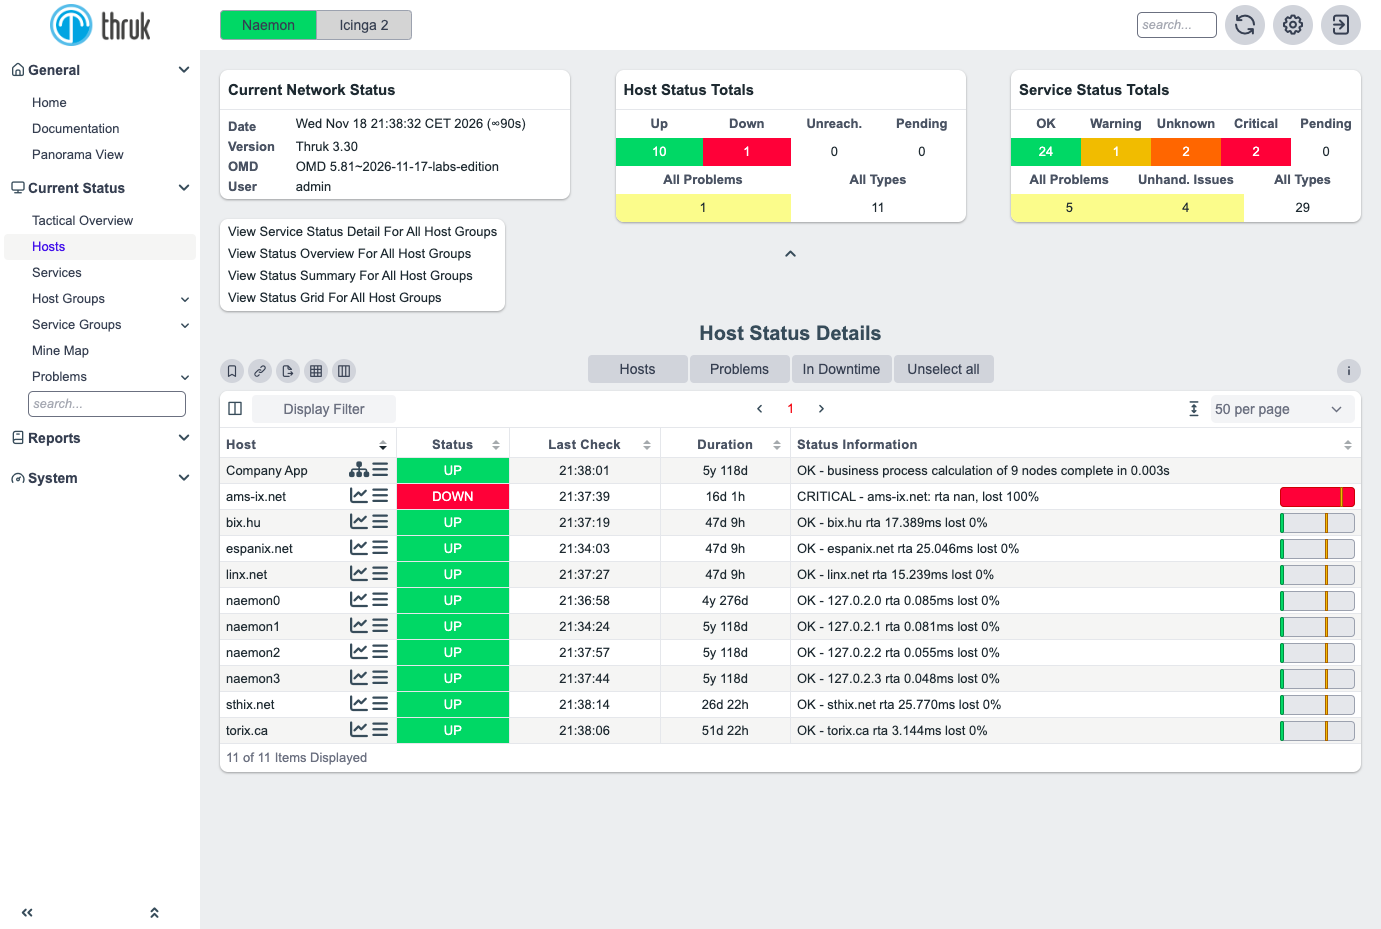
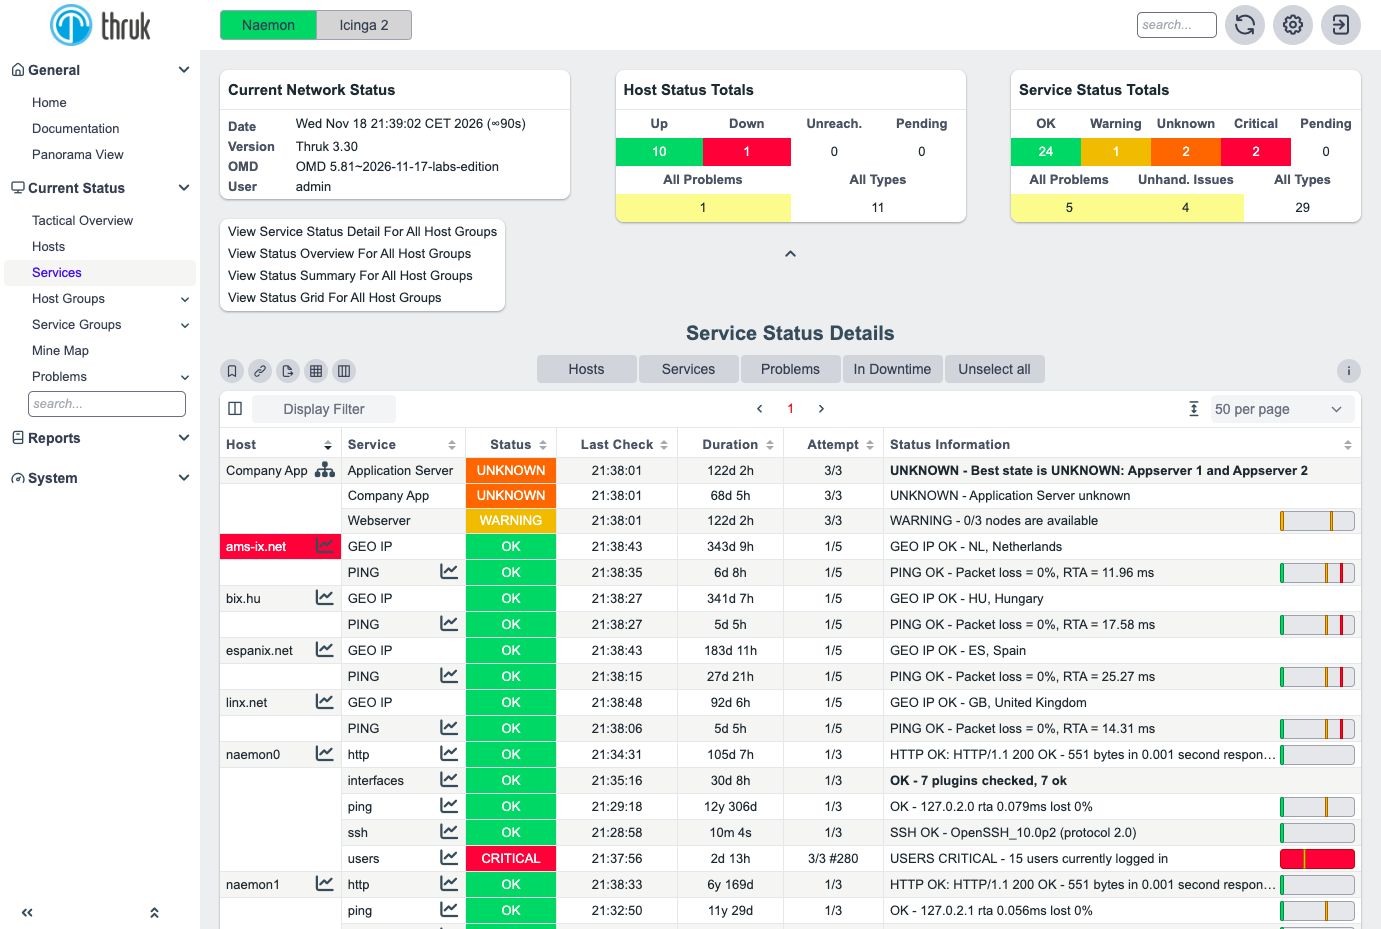
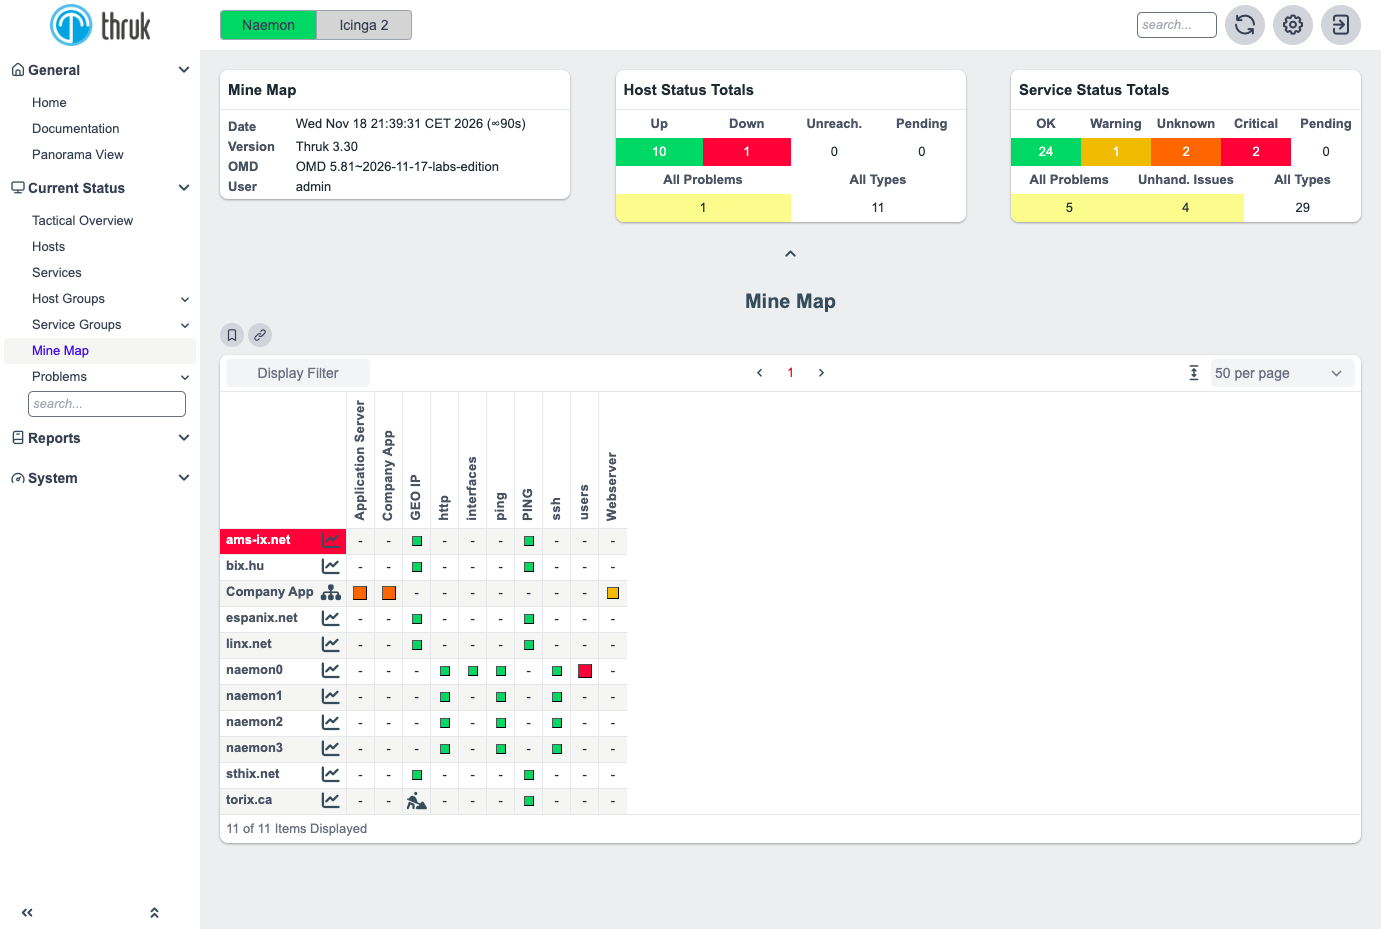
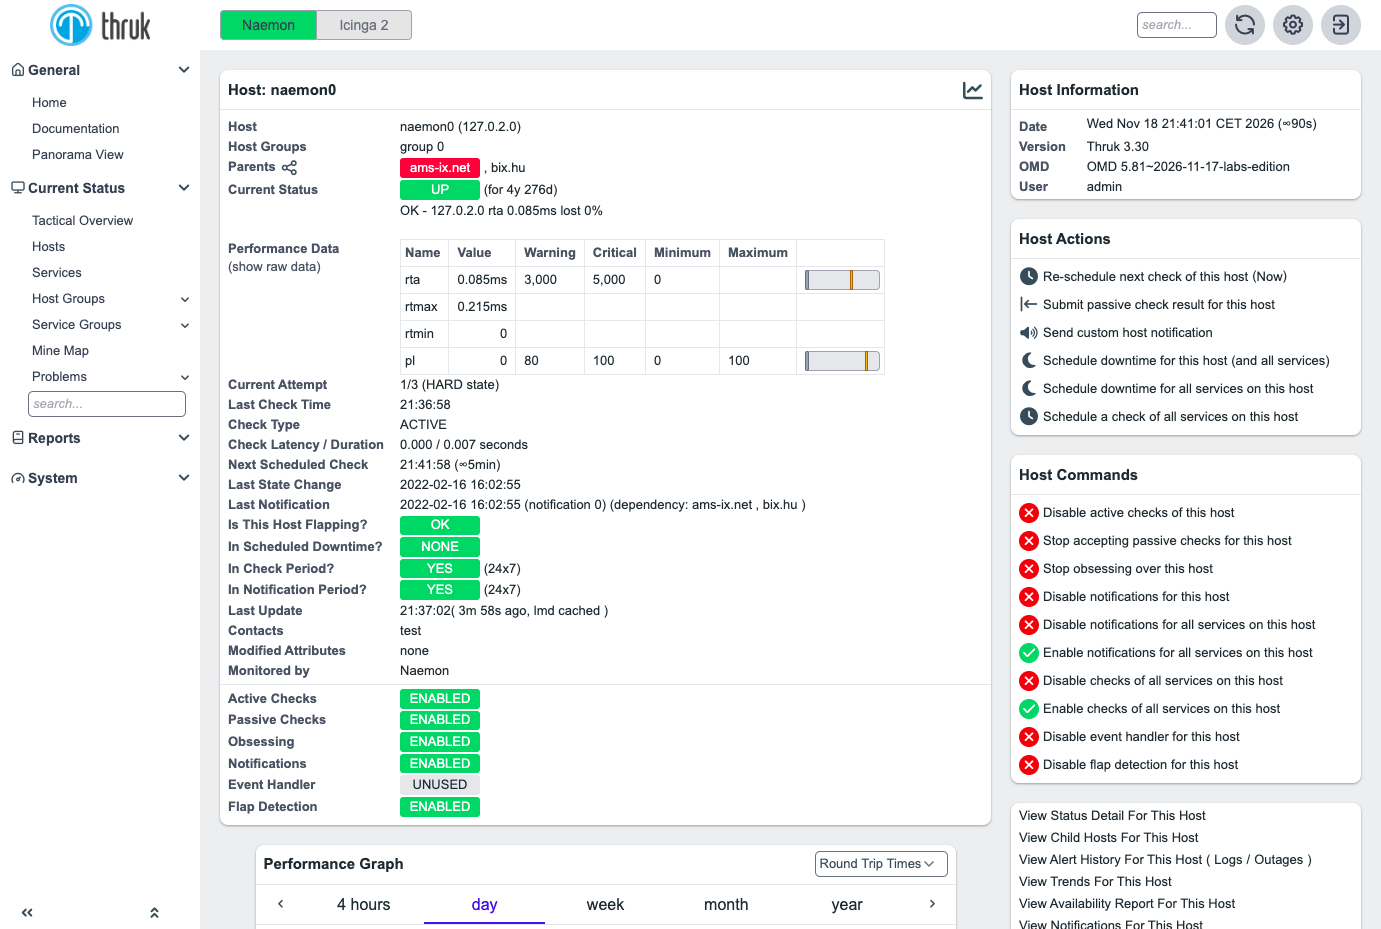
Thruk gives operations teams one fast web interface for watching hosts and services across several monitoring servers, with live status, dashboards, reports, and configuration in one place. One view combines Naemon, Icinga, Nagios, and Shinken servers, groups them by site, and reads them live. A home page of widgets shows host and service totals, gauges, notification charts, and unhandled problems, and a tactical overview adds outages and network health. Users filter, bookmark, and export status tables to Excel, and a mine map shows every host against its services as colored squares. A host page lists performance data beside actions to reschedule a check, submit a passive result, send a custom notification, or schedule downtime. Panorama dashboards place icons, graphs, and widgets on a free canvas or an OpenStreetMap, then share them with contact groups. A business process editor models an application as a tree of nodes with worst-of or best-of rules, and notifications can fire for individual steps. SLA reports in HTML and PDF go out by email on a schedule, and any page can become a recurring email report. A config tool edits hosts, services, commands, and contacts, manages users and teams, and reloads the monitoring core. Scripts reach status and commands through the REST API with API keys or through the command-line client. Running on a dedicated VPS on RepoCloud with guaranteed CPU, RAM, and SSD, full root SSH access, and a browser serial console. Artistic-1.0-Perl OR GPL-1.0-or-later licensed.
Benefits
- Watch Many Servers Together
- Connect Naemon, Icinga, Nagios, and Shinken servers from several sites, group them, and see live status without delay in one interface that stays independent of the monitoring cores.
- Spot Problems at a Glance
- Home widgets, a tactical overview, and a mine map turn check results into colored status, so unhandled outages and critical services stand out immediately.
- Deliver SLA Reports Automatically
- Create SLA reports in HTML and PDF, schedule them for email delivery, or turn any page into a recurring report so managers receive availability numbers without logging in.
- Configure Monitoring in the Browser
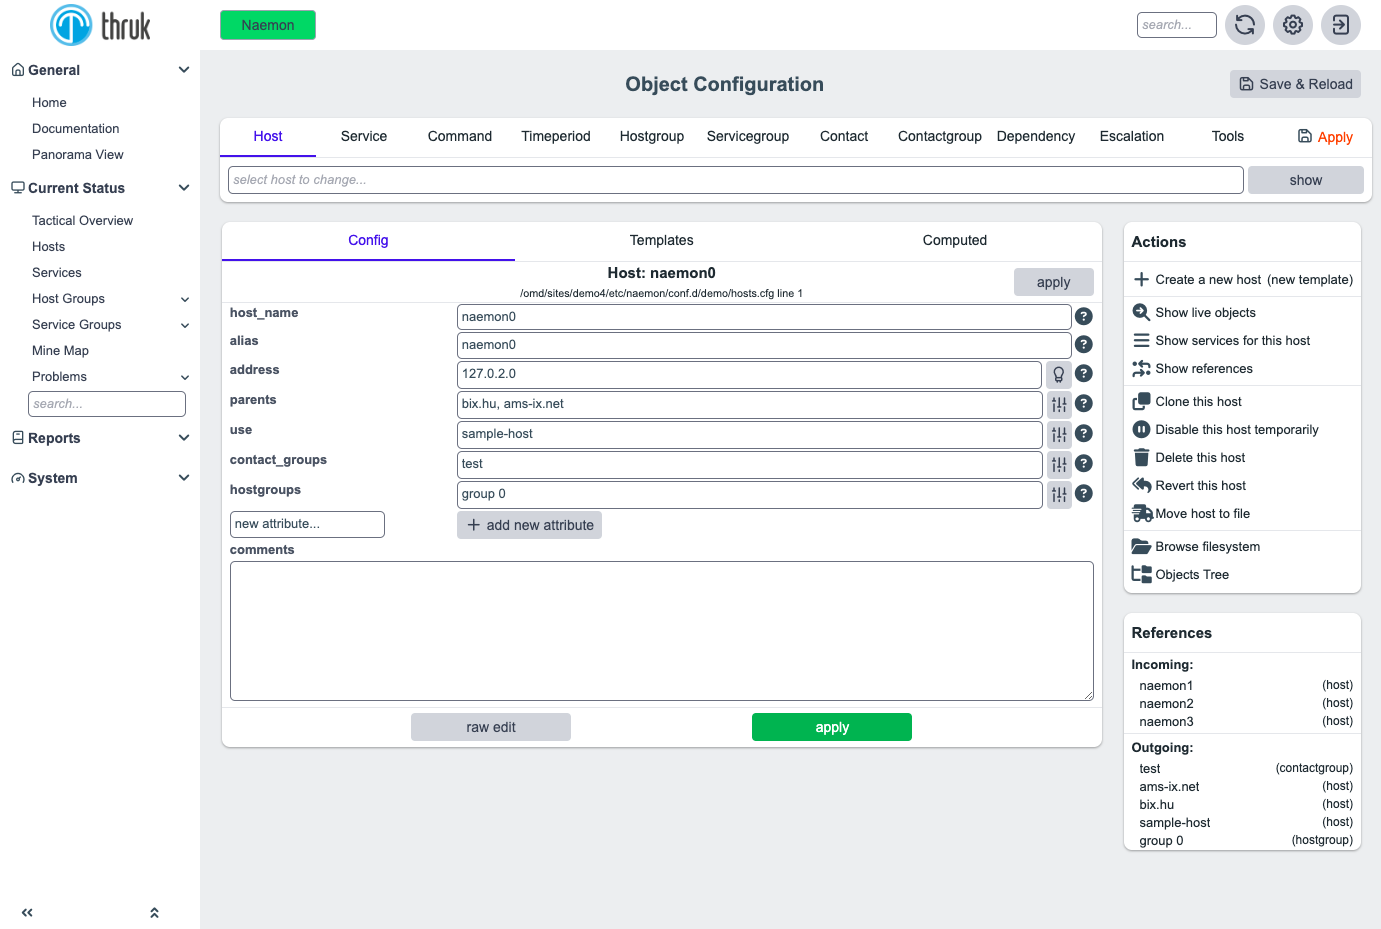
- The config tool edits hosts, services, commands, and contacts, manages users and teams, and reloads the core, so routine changes can be made from the browser.
Features
- Status Tables and Filters
- Host and service tables offer filters, sorting, pagination, personal bookmarks, and Excel export, and an extended log search finds earlier alerts and notifications.
- Panorama Dashboards
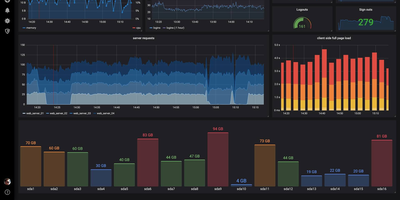
- Place icons, graphs, and widgets on a free canvas or OpenStreetMap, link dashboards into control centers, and share them read-only or editable with contact groups.
- Business Process Modeling
- An online editor builds application trees from checks and rule nodes, shows their live state, and creates a host and services in Naemon so notifications can follow.
- SLA Reporting
- Generate availability reports as HTML or PDF, schedule them for email delivery, and turn any Thruk page into a recurring email report.
- Config Tool and Plugins
- Edit monitoring objects, backends, users, and teams in the browser, and enable plugins like Agents and Node Control from the same tool.
- REST API and CLI
- A JSON REST API accepts API keys and exposes hosts, services, and commands, an OpenAPI description is available, and the thruk command line client calls the same endpoints.