HashiCorp Consul
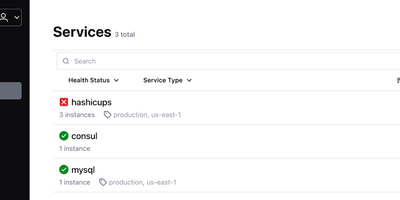
With nearly 30,000 GitHub stars and deployment across organizations including Criteo, Pandora, and Barclays, HashiCorp Consul is the industry-standard platform for service discovery, service mesh, and distributed configuration across dynamic multi-cloud and multi-datacenter infrastructure. Services register themselves and become discoverable via a built-in DNS interface on port 8600 or an HTTP API on port 8500, with health checks ensuring only healthy instances receive traffic through automatic catalog deregistration and service-level circuit breaking. The service mesh capabilities use Envoy sidecar proxies with Transparent Proxy mode to establish automatic mTLS encryption for all service-to-service communication, while identity-based intentions define fine-grained authorization rules controlling which services can communicate. The integrated API Gateway manages north-south traffic into the mesh with configurable routing rules, TLS termination, and header-based matching policies. Consul's distributed key-value store provides hierarchical configuration storage accessible via CLI, HTTP API, and the built-in web UI, with blocking queries enabling watch-based configuration updates without polling. Multi-datacenter federation connects Consul clusters across regions through WAN gossip and RPC forwarding, enabling cross-datacenter service discovery and failover with configurable prepared queries. The Raft consensus protocol provides strong consistency for the service catalog and KV store, with anti-entropy mechanisms ensuring agent state converges with the server catalog. Consul integrates natively with Kubernetes via Helm charts with automatic sidecar injection, Nomad for workload orchestration, Vault for secrets management, and Terraform for infrastructure provisioning. Running on a dedicated VPS on RepoCloud with guaranteed CPU, RAM, and SSD, full root SSH access, and a browser serial console. BUSL 1.1 licensed.
Beszel
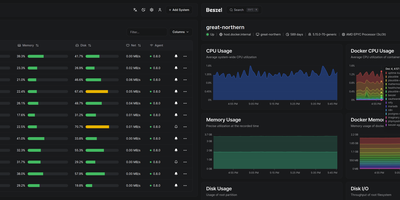
Reaching 24,000 GitHub stars within two years of its first commit in July 2024, Beszel delivers Netdata-grade monitoring dashboards from a single Docker container with no Prometheus stack, no external database, and no complex configuration — just a one-binary hub on PocketBase (SQLite embedded) and a sub-15 MB agent per host that auto-discovers Docker and Podman containers on contact. The agent connects outbound via WebSocket or SSH tunnel, requiring zero open ports on monitored servers and zero manual network configuration. Per-host metrics cover CPU usage, memory with swap and ZFS ARC breakdown, disk I/O across multiple partitions, network throughput, load average, sensor temperatures, battery charge, and GPU utilization with power draw for Nvidia, AMD, and Intel cards — features that competitors lock behind paid tiers. S.M.A.R.T. disk health including eMMC wear indicators and Linux mdraid array status surface hardware degradation before failures occur. Container statistics track CPU, memory, and network history per container with automatic discovery as new containers start. Configurable threshold alerts notify via email, Discord, Telegram, ntfy, Pushover, Gotify, Matrix, Mattermost, Signal, Slack, Microsoft Teams, and Twilio when metrics exceed defined limits. Multi-user accounts with OAuth/OIDC authentication let teams share monitored systems with role-based access, while automatic backups persist data to disk or S3-compatible storage. Running on a dedicated VPS on RepoCloud with guaranteed CPU, RAM, and SSD, full root SSH access, and a browser serial console. MIT licensed.
CoreObs
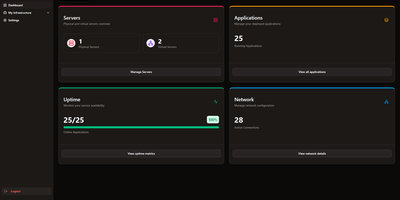
CoreObs delivers a unified self-hosted dashboard that replaces the typical combination of Uptime Kuma, Homer, and separate monitoring tools with a single interface for managing your entire server infrastructure. The Next.js frontend with shadcn components provides a modern dark-themed UI displaying server hardware metrics collected by a lightweight Go agent that leverages Glances for hardware abstraction — streaming real-time per-core CPU load, RAM utilization, NVIDIA GPU statistics, disk usage, system uptime, and load averages via WebSocket connections. The application registry tracks all self-hosted services with configurable uptime monitoring, availability history charts, and instant notifications through Discord, Telegram, Pushover, and email when services go down or recover. Quick-access links provide one-click navigation to each application's management panel directly from the dashboard. The network visualization module built on React Flow enables creating visual topology maps of your infrastructure with drag-and-drop nodes representing servers, switches, and services connected by labeled edges. Server data can be organized with tags, copied between entries, and monitored with configurable pagination and compact view modes. Deploy via Docker Compose with three containers — the Next.js web interface, the Go monitoring agent, and PostgreSQL 17 for persistent storage. Running on a dedicated VPS on RepoCloud with guaranteed CPU, RAM, and SSD, full root SSH access, and a browser serial console. MIT licensed.
CubeJS
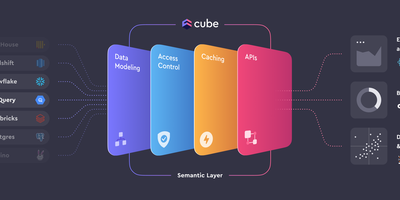
Between your databases and everything that consumes data - BI tools, embedded analytics, AI agents - sits Cube (formerly Cube.js), an open-source semantic layer. Metrics, dimensions, joins, and access rules are defined once as code in YAML, JavaScript, or Python, forming a governed data model that every downstream consumer shares, so "revenue" means the same thing in every dashboard. Caching is two-level: an in-memory cache absorbs bursts of identical queries, and declared pre-aggregations - rollup tables built in the warehouse or in Cube Store, Cube's distributed columnar engine, and refreshed in the background - deliver sub-second latency while cutting warehouse compute costs. The query planner routes each request to cache, rollup, or source automatically. Consumers connect through a Postgres-compatible SQL API (any tool that speaks Postgres works), plus REST, GraphQL, and a Meta API for model introspection. Row-level security and multi-tenancy are enforced in the layer itself, upstream of every client. Sources include Snowflake, BigQuery, Databricks, Postgres, MySQL, Presto, and Athena. Headless by design - bring your own UI.
OCI Core
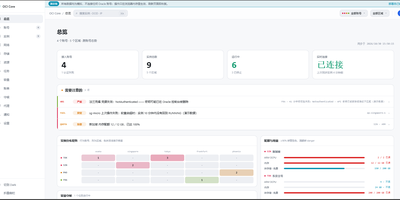
Anyone juggling several Oracle Cloud accounts knows the tab-switching ritual; OCI Core ends it by pulling every tenancy's instances into one self-hosted panel. The cross-account list shows state, shape, volumes, and public IPs for each machine, and you can start, stop, resize, rename, or terminate instances without opening Oracle's console. A creation wizard offers every shape in an availability domain, not just the free presets, while long operations such as IP swaps, resizes, and terminations run as background jobs with visible progress. Capacity hunting watches Oracle's read-only capacity reports and retries creation until a scarce shape appears, notifying you when it lands. Networking tools edit VCNs, subnets, and security rules visually, swap public IPs, enable IPv6, and manage extra network cards. Storage views resize boot and block volumes, and a rescue mode moves a broken system disk to a healthy machine for repair. Billing breaks spend down by service and region, tracks the monthly free egress allowance, and shows real usage for free-tier accounts. Accounts are checked for connectivity, quotas, and credential health, with emails, IPs, and OCIDs masked by default and revealed only on demand. Alerts reach Telegram, WeCom, DingTalk, email, or webhooks, and access is guarded by argon2id passwords, TOTP two-factor sign-in, session controls, and an audit log. Running on a dedicated VPS on RepoCloud with guaranteed CPU, RAM, and SSD, full root SSH access, and a browser serial console. MIT licensed.
PowerDNS-Admin
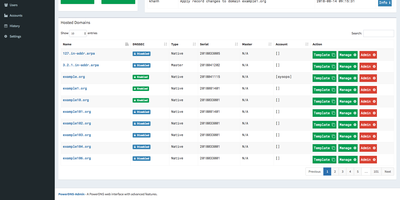
Raw zone files and API calls become something a whole team can operate safely once PowerDNS-Admin puts its web interface in front of a PowerDNS authoritative server. It's a Python/Flask application covering full forward and reverse zone management, with the touches that matter in daily DNS work: zone templates for stamping out consistent new domains, easy IPv6 PTR record editing (reverse zones by hand are misery), full IDN/Punycode support for internationalized domains, and DynDNS 2 protocol support so routers and scripts can update records the way they would against a commercial dynamic-DNS service. Access control is enterprise-grade: local users, LDAP against OpenLDAP or Active Directory, SAML, and OAuth via Google, GitHub, Azure, or OpenID Connect, hardened with TOTP two-factor authentication. Role-based permissions extend to zone-specific access control - hand a developer their project's zone without exposing the rest of your namespace - and activity logging records who changed which record when, the audit trail bare PowerDNS never gives you. The dashboard monitors PDNS service configuration and statistics, and its own API exposes zone and record management for automation on top of the UI. Runs against MySQL/MariaDB or PostgreSQL, talking to PowerDNS through its REST API. MIT-licensed.
Kite
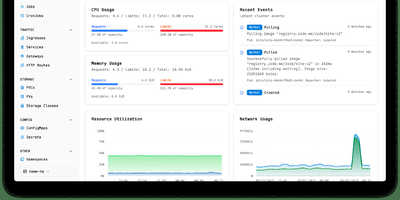
With nearly 3,000 GitHub stars and 14 releases since its June 2025 launch, Kite delivers a lightweight Kubernetes dashboard that replaces the fragmented workflow of switching between kubectl, Lens, and separate monitoring tools with a unified multi-cluster management platform. The dashboard automatically discovers clusters from kubeconfig files and supports independent Prometheus configurations per cluster, providing real-time CPU, memory, and network charts alongside live pod log streaming with filtering and search. A built-in web terminal opens shells directly into pods and nodes without kubectl port-forward, while the Monaco-based YAML editor offers syntax highlighting and validation for in-place resource editing. The integrated AI agent, powered by OpenAI or Anthropic models via native Go SDK integrations, translates natural language into precise client-go API calls — querying cluster health, analyzing pod logs, scaling deployments, patching resources, and cleaning up failed jobs — all operating strictly within the logged-in user's RBAC permissions. Enterprise governance includes OAuth 2.0 single sign-on, multi-factor authentication, FIDO2 passkeys, granular role-based access control with per-namespace permissions, and comprehensive audit logging. Helm chart management enables browsing, installing, and upgrading releases directly from the UI, while the Docker registry integration provides quick image tag selection. Deploy via a single Docker container with SQLite or use the official OCI Helm chart with PostgreSQL or MySQL for production. Running on a dedicated VPS on RepoCloud with guaranteed CPU, RAM, and SSD, full root SSH access, and a browser serial console. Apache 2.0 licensed.
Komodo
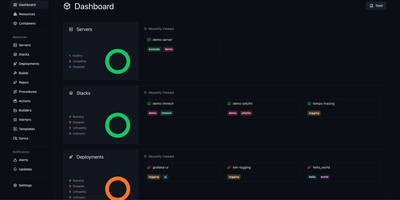
Komodo puts every server, container, and deployment pipeline behind a single dashboard where you build, ship, and monitor Docker workloads across unlimited hosts. Lightweight stateless agents install on each connected server and report CPU, memory, and disk metrics back to the Rust-powered core, giving you real-time visibility without heavyweight monitoring stacks. Docker Compose stacks deploy directly from the UI or link to Git repositories with webhook-triggered automatic redeploys on push. A built-in CI pipeline compiles versioned Docker images from source, with optional AWS spot instances for burst build capacity. For orchestration at scale, Docker Swarm management handles node configuration, service deployment, and multi-node stack orchestration from the same control plane. Browser terminal sessions open persistent named shells on servers and inside containers, complete with shared team access and scriptable Actions that chain executions into multi-stage procedures. Infrastructure-as-code support defines all resources declaratively in TOML files within a Git repository, keeping production state version-controlled and auditable. Granular role-based access control with user groups, per-resource permissions, and OAuth through GitHub and Google keeps teams operating within defined boundaries. A full OpenAPI specification, dedicated CLI, and typesafe client libraries for Rust and TypeScript make programmatic integration straightforward. With 12,000+ stars and active development, the community continues expanding multi-architecture builds and Swarm tooling.
Ralph
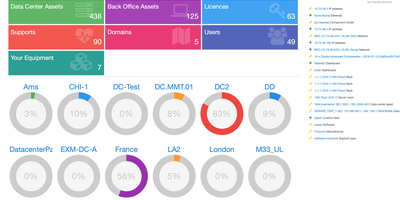
Ralph tracks thousands of assets across data centers and back offices through a unified CMDB, DCIM, and asset management platform, providing the same capabilities as ServiceNow, Device42, and Sunbird dcTrack without per-asset licensing fees. Used by Allegro in production and backed by over 2,500 GitHub stars, it is built on Python 3 with Django and Django REST Framework. Interactive data center floor plans support drag-and-drop rack placement, front and rear rack views showing U-level asset positioning, power consumption tracking per PDU, and ethernet and fiber connection mapping. The back office module manages laptops, desktops, printers, mobile phones, and accessories with user assignment tracking, warehouse inventory, stock-taking audits, and automated loan workflows. IP address management handles network environments with DHCP and DNS integration alongside network topology visualization. Software license tracking monitors per-user and per-core allocations with usage calculations, compliance reporting, and expiration alerts, while vendor support contracts track SLA agreements and warranty renewal dates. The transitions system automates asset lifecycle processes through configurable workflows that trigger HTTP webhooks, custom Python scripts, email notifications, and Puppet and Ansible configuration management integration. Custom fields extend the data model with text, numbers, dates, choices, and URLs per asset type, accessible via the REST API. Multi-tenant architecture organizes assets by regions, data centers, service environments, and business units. Deploy via Docker with the allegro/ralph image alongside MySQL and Redis. Running on a dedicated VPS on RepoCloud with guaranteed CPU, RAM, and SSD, full root SSH access, and a browser serial console. Apache 2.0 licensed.
ServerKit
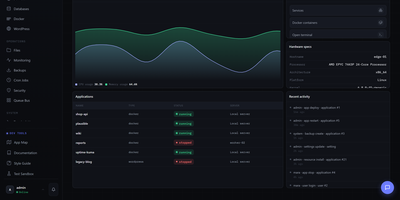
ServerKit delivers a server control panel that fits on a small VPS while managing everything from Docker containers to mail servers. The Python/Flask backend exposes 1,519 REST endpoints across 107 blueprints with full OpenAPI documentation at /api/v1/docs, while the React frontend spans 65 screens in a 1.75MB gzipped bundle served entirely from your own infrastructure. Docker management includes full container lifecycle control, Docker Compose project orchestration, real-time log streaming, and terminal access. Database panels cover MySQL/MariaDB and PostgreSQL with user management, browser-based query consoles, and automated backups to S3, Backblaze B2, or local storage. Nginx virtual host management automates Let's Encrypt certificate provisioning with hardened TLS 1.2+ configurations and Cloudflare-aware setups. The Go-based cross-platform agent enables multi-server fleet management with HMAC-SHA256 authentication over a WebSocket gateway, supporting Linux, Windows, and macOS across amd64 and ARM64 architectures. Fleet monitoring provides cross-server heatmaps, metric comparison charts, alert thresholds, anomaly detection, and capacity forecasting. A built-in marketplace distributes 106 one-click application templates using a declarative YAML schema with Docker Compose stacks. The extension system allows community plugins for Kubernetes management, Redis browsers, and WordPress site orchestration. Running on a dedicated VPS on RepoCloud with guaranteed CPU, RAM, and SSD, full root SSH access, and a browser serial console. MIT licensed.
BitRouter
BitRouter is a context-aware LLM router that learns which model delivers the cheapest successful outcome per workflow step, cutting agent costs by up to 80% while maintaining 96% quality versus all-frontier baselines. Point any agent runtime at http://localhost:4356 with a one-line OPENAI_BASE_URL change and BitRouter routes to OpenAI, Anthropic, Google, Groq, DeepSeek, Mistral, Moonshot, MiniMax, Nvidia, and any OpenAI-compatible endpoint simultaneously, normalizing authentication, streaming, and cross-protocol translation between wire formats. The act-observe-evaluate-learn loop traces every hop with cost, tokens, and latency attribution, scores each decision against a versioned policy-lock.yaml, then tightens routes automatically with no LLM judge in the path. Native MCP gateway auto-discovers tools from connected servers and makes them routable and governed alongside model calls. Agent Client Protocol integration enables the TUI to manage Claude Code, Codex, OpenCode, OpenClaw, Gemini, and Copilot sessions in real time with inline tool-call approval and live streaming. Built-in guardrails inspect, redact, or block risky content before requests leave your network. Virtual keys scope API access per agent or user without exposing upstream credentials. Per-agent spend caps and loop guards contain runaway cost automatically. Multi-account failover reroutes mid-run so rate limits never re-pay completed work. Ships as a single Rust binary via npm or Cargo. Running on a dedicated VPS on RepoCloud with guaranteed CPU, RAM, and SSD, full root SSH access, and a browser serial console. Apache 2.0 licensed.
Icinga 2
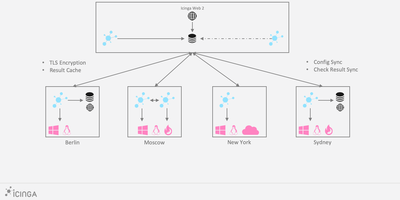
Servers, services, and network gear report their health to Icinga 2, the open-source monitoring core that runs checks, evaluates thresholds, and decides who gets woken up. A distributed hierarchy of master, satellite, and agent zones scales from a single box to global estates: satellites execute checks in remote regions and keep working when the master is unreachable, while agents run local checks under TLS-secured, certificate-based trust. The object-based configuration language defines hosts, services, dependencies, and notification rules as code, with apply rules generating checks across whole groups automatically. Performance data streams into Graphite, InfluxDB, or Elasticsearch writers, and Icinga DB carries runtime state and history into Redis and SQL for the web frontends. The REST API drives acknowledgements, downtimes, and check scheduling from scripts and chat tools, with fine-grained permissions down to diagnostic information. The 2.16 line hardens API security, streams richer runtime updates to Icinga DB for the new Icinga Notifications 1.0 incident workflows, and lets operators set exact acknowledgement times through the API. Running on a dedicated VPS on RepoCloud with guaranteed CPU, RAM, and SSD, full root SSH access, and a browser serial console. GPL-3.0-or-later licensed.
RushDB
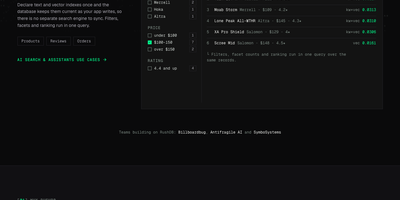
RushDB is a database your AI agents can actually understand, because it remembers the shape of everything you write. Send nested JSON and each object becomes a record, automatically linked to its parent, while field names, types, and values are cataloged on every write. Agents introspect that catalog before querying, so they ask questions the data can answer instead of hallucinating tables that never existed. The same records answer five query styles: a JSON query language, SQL over the PostgreSQL wire protocol, Cypher over HTTP or Bolt, Gremlin, and Mongo-style document queries. Vector, full-text, and hybrid search run against the same store, so an agent can find the record that mentions a phrase and the records merely similar to it. Everything ships as one binary with one data directory, speaking HTTP on port 3000, PostgreSQL on 5432, and Bolt on 7687 to the drivers and tools you already use. Point your SDKs, SQL clients, BI tools, or local MCP-connected agents at it, and back it up, replicate it, or restore to a point in time with the engine's own tooling. Running on a dedicated VPS on RepoCloud with guaranteed CPU, RAM, and SSD, full root SSH access, and a browser serial console. Apache-2.0 licensed.
InfraCanvas
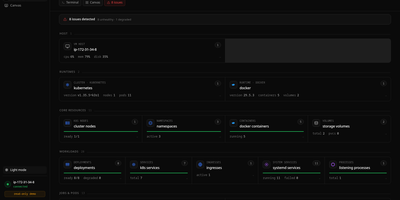
InfraCanvas draws the picture ten terminal commands cannot: a live map in your browser of every container, pod, service, volume and network on a machine, showing what runs where, what talks to what, and what is broken in one glance. Nodes turn green, amber or red from real state, including container health, pod phases, ready replicas, zombie processes and host thresholds, and real connection edges appear between processes, like your app server talking to Postgres on port 5432, read straight from the machine. It works where workloads already live: Docker and Podman containers, full Kubernetes object graphs from nodes to ingresses, LXD and Incus containers, and plain systemd or PM2 services on VMs with no container runtime. From any node you can shell into the container, pod or host, tail logs, restart or stop a service, scale a deployment, run a rolling restart, change an image or kill a process, with secrets masked before anything reaches the screen. A second machine joins through an outbound-only agent, and clusters connect by dropping in a kubeconfig with nothing installed inside them. The self-hosted binary needs no account, sends no telemetry and opens no inbound port: it binds localhost on port 7777 behind a random per-install token, with an optional read-only mode, and every action is audit-logged. Running on a dedicated VPS on RepoCloud with guaranteed CPU, RAM, and SSD, full root SSH access, and a browser serial console. AGPL-3.0 licensed.

Nanocl
One server, treated properly: Nanocl runs your containers and full virtual machines from a single declarative Statefile, reconciling what is running against what the file says, so a lone host gets cluster discipline without cluster ceremony. Containers group into Cargoes with replica counts, ordered init containers, and health-aware restarts; finite jobs run to completion and stop. When a workload needs a real kernel or a custom disk image, it boots as a QEMU virtual machine beside the containers instead of forcing a second platform. Publishing is built in: the proxy controller terminates TLS and routes HTTP and TCP traffic, and the DNS controller keeps service names resolving while workloads come and go. Secrets for registries, certificates, and environment variables attach where they are used, never inside the file itself. The daily loop is a CLI and an API: list processes, follow logs, exec into a container, watch events, and back up the entire deployment state before you change it. Namespaces keep projects apart on the same host, and Statefile arguments, templates, and sub-states carry one definition from staging to production. Running on a dedicated VPS on RepoCloud with guaranteed CPU, RAM, and SSD, full root SSH access, and a browser serial console. MIT or Apache-2.0 licensed.
Tunnel Panel
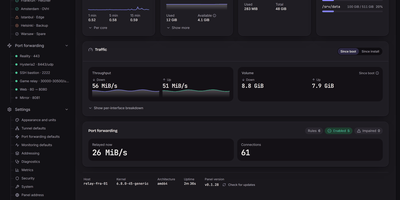
Tunnel Panel manages GRE tunnels and port forwarding on Linux servers from a web panel that previews every change before it runs and verifies the result against the kernel. Create GRE, GRETAP, IP6GRE, and IP6GRETAP tunnels and see the exact commands, unit file, and rollback before anything is applied. The far end configures itself from a pairing code, as text or QR, with the sides flipped automatically so the two ends cannot disagree by a typo. Native ICMP probing with hysteresis keeps a single dropped packet from flapping a tunnel between down and back, and when ICMP is filtered the panel knocks over TCP and says so instead of crying wolf. Forward any TCP or UDP port, or a whole range, with round-robin, source-hash, or weighted balancing across destinations, and a backend that stops answering its health knock leaves the ruleset until it recovers. Watch every connection crossing the relay, who connected, which destination took them, and how much has moved, and set traffic limits per tunnel, rule, or destination. When something breaks, diagnostics reach a verdict with evidence and a suggested fix, backed by a streaming manual probe and a path-MTU search that offers to apply its findings. The panel reads your kernel's relay limits, recommends values from the host's memory and cores, and refuses changes that would lock you out of your own server. Running on a dedicated VPS on RepoCloud with guaranteed CPU, RAM, and SSD, full root SSH access, and a browser serial console. AGPL-3.0 licensed.
Nixopus
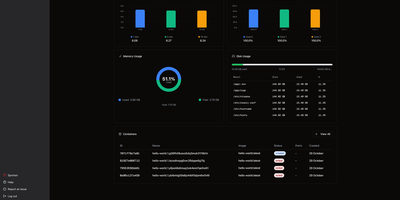
Tell an AI agent to deploy your app and watch it actually happen. Nixopus connects to your GitHub repo, analyzes the codebase to detect your framework, generates the right Docker configuration, resolves dependency conflicts, and ships the whole thing to your server with HTTPS enabled. When something breaks, the agent reads the logs, creates a pull request with a fix, and redeploys without waking you up. The chat interface lets you deploy, add custom domains, check logs, roll back, and troubleshoot in plain English from the web dashboard or directly from your VS Code or Cursor editor. Extensions bring one-click installs for 100+ self-hostable apps like Appwrite, Excalidraw, and Ollama, each showing you exactly what it runs on your server before installation. Connect multiple servers and monitor CPU, memory, disk, and running containers across your entire fleet from a single dashboard with draggable widget layouts. The built-in terminal opens SSH sessions right in the browser with split-pane support, so you can watch logs in one pane while running commands in another. Framework detection covers Next.js, Django, Rails, Go, FastAPI, and anything else that fits a container image. Every deployment gets automatic TLS via Caddy with Let's Encrypt certificates provisioned and renewed silently. Previous container images are retained so rollbacks skip the rebuild step entirely. Deploy on a dedicated VPS on RepoCloud with guaranteed CPU, RAM, and SSD, full root SSH access, and a browser serial console. AGPL-3.0 licensed.
Maintenant
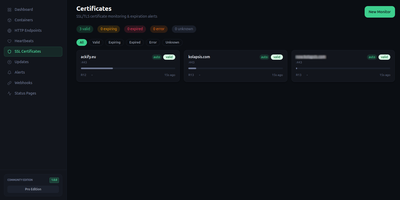
Maintenant replaces three to five separate monitoring tools with a single Go binary that consolidates container discovery, endpoint monitoring, SSL tracking, resource metrics, and public status pages without requiring any external database. The embedded Vue 3 frontend serves on port 8080 immediately after deployment, auto-discovering Docker containers and Kubernetes pods through direct socket and API access without configuration. HTTP and TCP endpoint monitoring validates availability with configurable intervals, while TLS certificate tracking alerts before expiration across all monitored domains. Resource metrics collect CPU, RAM, network throughput, and disk usage per container with real-time Server-Sent Events streaming to the dashboard. Heartbeat and cron monitoring accepts pings from external scheduled jobs, triggering alerts on missed check-ins via webhook callbacks and Discord notifications. The built-in alert engine supports escalation rules and notification batching. Public status pages expose component health to end users without authentication, customizable per monitored service. Network security insights analyze exposed ports, container privilege levels, and host configuration to produce a posture score. Update intelligence scans OCI registries to detect available container image updates with digest comparison. The REST API with SSE broker enables automation, and the integrated MCP server provides tooling for AI assistant integration. SQLite in WAL mode stores all data with zero operational overhead. Running on a dedicated VPS on RepoCloud with guaranteed CPU, RAM, and SSD, full root SSH access, and a browser serial console. AGPL-3.0 licensed.