Developer links
InfraCanvas
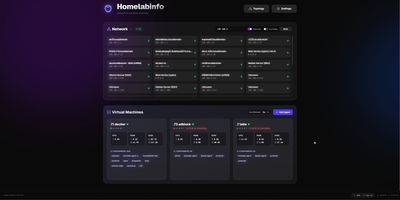
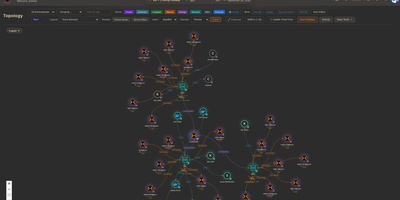
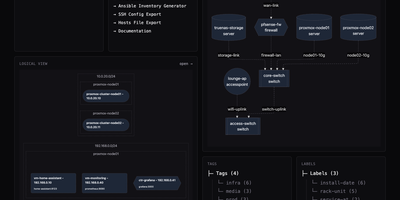
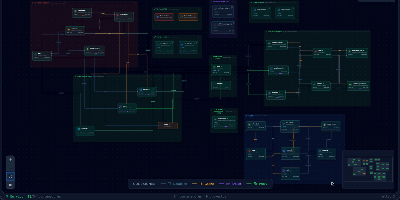
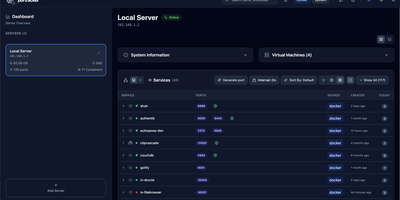
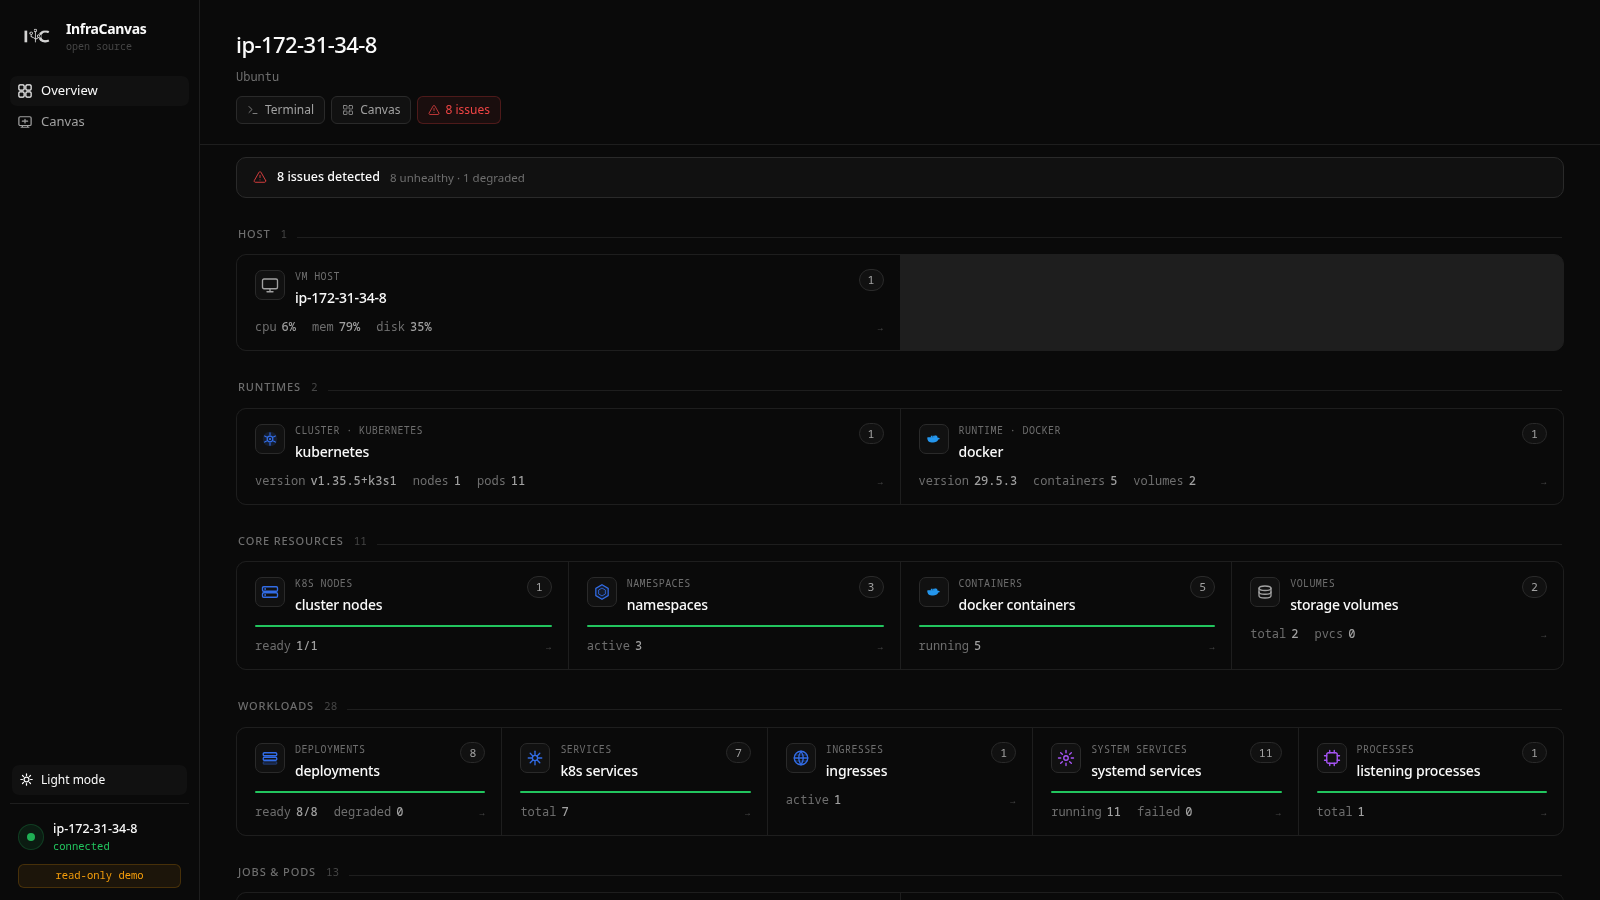
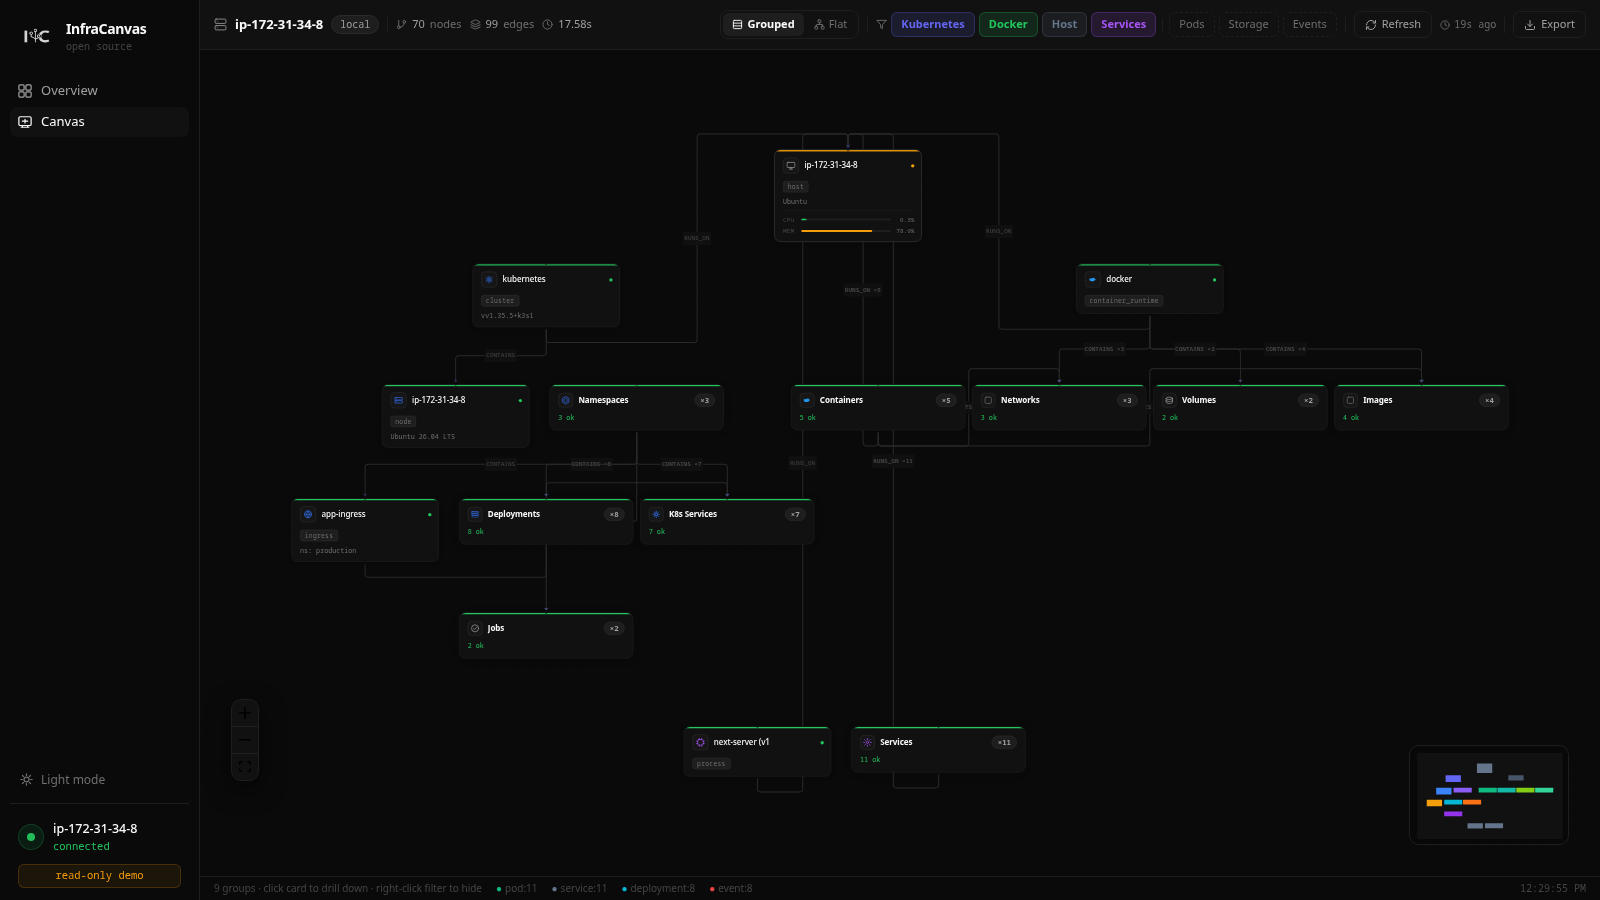
InfraCanvas draws the picture ten terminal commands cannot: a live map in your browser of every container, pod, service, volume and network on a machine, showing what runs where, what talks to what, and what is broken in one glance. Nodes turn green, amber or red from real state, including container health, pod phases, ready replicas, zombie processes and host thresholds, and real connection edges appear between processes, like your app server talking to Postgres on port 5432, read straight from the machine. It works where workloads already live: Docker and Podman containers, full Kubernetes object graphs from nodes to ingresses, LXD and Incus containers, and plain systemd or PM2 services on VMs with no container runtime. From any node you can shell into the container, pod or host, tail logs, restart or stop a service, scale a deployment, run a rolling restart, change an image or kill a process, with secrets masked before anything reaches the screen. A second machine joins through an outbound-only agent, and clusters connect by dropping in a kubeconfig with nothing installed inside them. The self-hosted binary needs no account, sends no telemetry and opens no inbound port: it binds localhost on port 7777 behind a random per-install token, with an optional read-only mode, and every action is audit-logged. Running on a dedicated VPS on RepoCloud with guaranteed CPU, RAM, and SSD, full root SSH access, and a browser serial console. AGPL-3.0 licensed.
Benefits
- A map, not another list
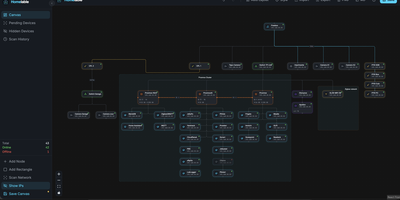
- Hosts, containers, pods, volumes and networks appear as connected nodes with live health colors and real connection edges, so architecture and failures are visible at a glance instead of reconstructed from commands.
- Works beyond Docker and Kubernetes
- Plain VMs get real workload nodes from systemd and PM2 services plus listening ports read from the system, and LXD or Incus containers join the same canvas beside Docker and Kubernetes resources.
- Operate without leaving the page
- Interactive terminals open inside containers, pods and hosts, logs tail with one click, and actions restart, scale, roll out or stop workloads, all scoped to the node you selected.
- Private by architecture
- The binary binds localhost behind a random token, masks secrets before display, opens no inbound ports, keeps an audit log of every action, and offers a read-only mode for shared dashboards.
Features
- Zero-config auto discovery
- One binary detects Docker, Podman, the current kubeconfig context, LXD sockets and systemd units on its own, building the topology graph without configuration files.
- Live diff-updated canvas
- Discovery passes rebuild the graph and only the diff streams to the browser over WebSocket, so containers starting and pods rescheduling appear as they happen.
- Real connection edges
- Listening ports and established connections read from /proc/net/tcp become CONNECTS_TO edges between workloads, showing actual traffic paths like app to database.
- Multi-machine hub
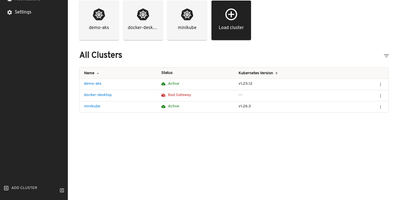
- Additional VMs join with an outbound-only agent streaming to one hub, and Kubernetes clusters connect directly through a kubeconfig with no in-cluster install.
- Fleet metrics and alerts
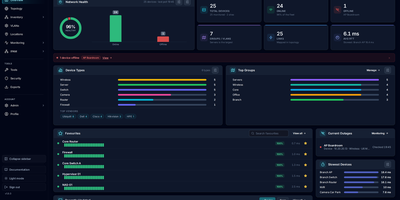
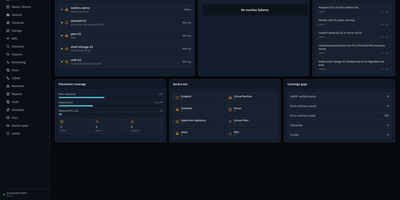
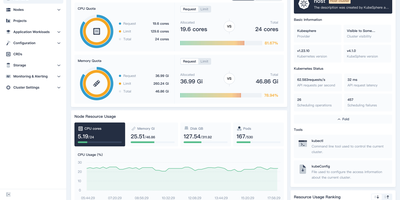
- CPU, memory, disk and network history chart per machine and across the fleet, while a live event feed flags CrashLoopBackOff, OOMKills and probe failures.